| Param | Original file | Final file |
|---|---|---|
| Filename | modeM0/AS1A03_009T01_9000001234_08870cztM0_level2.evt | modeM0/AS1A03_009T01_9000001234_08870cztM0_level2_quad_clean.evt |
| Size (bytes) | 288,322,560 | 39,674,880 |
| Size | 275.0 MB | 37.8 MB |
| Events in quadrant A | 2,303,353 | 235,367 |
| Events in quadrant B | 1,882,941 | 241,967 |
| Events in quadrant C | 1,683,881 | 236,261 |
| Events in quadrant D | 2,606,888 | 223,395 |
| Mode SS | |||
|---|---|---|---|
| Quadrant | BADHDUFLAG | Total packets | Discarded packets |
| A | 0 | 76 | 0 |
| B | 0 | 76 | 0 |
| C | 0 | 76 | 0 |
| D | 0 | 76 | 0 |
| Mode M0 | |||
|---|---|---|---|
| Quadrant | BADHDUFLAG | Total packets | Discarded packets |
| A | 0 | 9286 | 0 |
| B | 0 | 7959 | 0 |
| C | 0 | 7519 | 0 |
| D | 0 | 10147 | 0 |
| Quadrant | Total seconds | Saturated seconds | Saturation percentage |
|---|---|---|---|
| A | 3727 | 80 | 2.146499% |
| B | 3727 | 23 | 0.617118% |
| C | 3727 | 1 | 0.026831% |
| D | 3727 | 122 | 3.273410% |
Noise dominated data is calculated using 1-second bins in cleaned event files. If a bin has >2000 counts, and if more than 50% of those come from <1% of pixels, then it is considered to be noise-dominated and hence unusable.
| Quadrant | # 1 sec bins | Bins with >0 counts | Bins with >2000 counts | High rate bins dominated by noise | Noise dominated (total time) | Noise dominated (detector-on time) | Marked lightcurve |
|---|---|---|---|---|---|---|---|
| A | 3727 | 3727 | 55 | 55 | 1.48% | 1.48% | 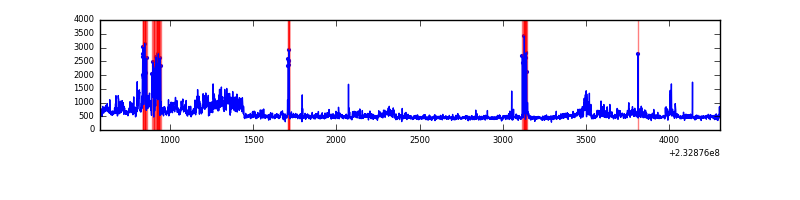 |
| B | 3727 | 3727 | 16 | 16 | 0.43% | 0.43% | 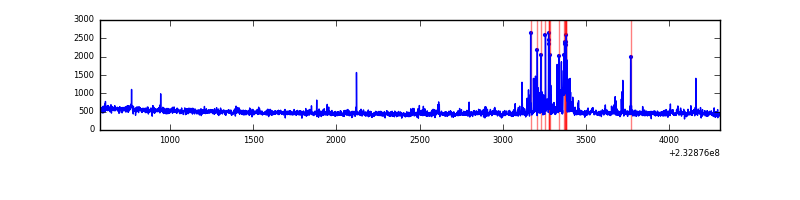 |
| C | 3727 | 3727 | 0 | 0 | 0.00% | 0.00% | 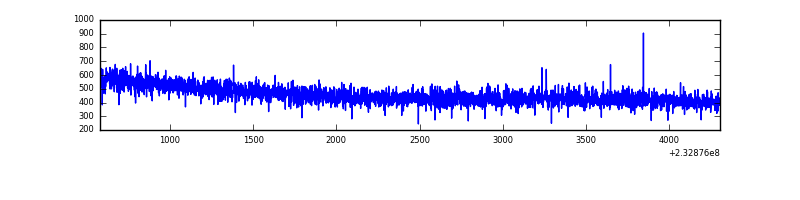 |
| D | 3727 | 3727 | 119 | 119 | 3.19% | 3.19% | 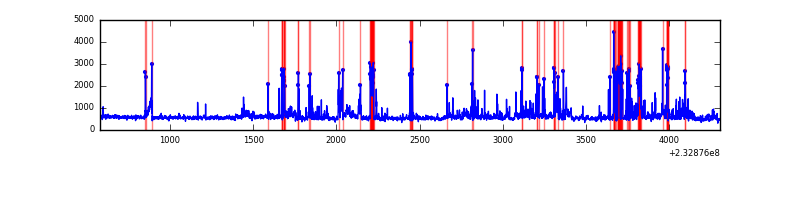 |
Top three noisy pixels from each quadrant. If the there are fewer than three noisy pixels in the level2.evt file, extra rows are filled as -1
| Pixel properties | Quadrant properties | ||||||
|---|---|---|---|---|---|---|---|
| Quadrant | DetID | PixID | Counts | Sigma | Mean | Median | Sigma |
| A | 8 | 5 | 418323 | 4586.68 | 441 | 431 | 91.1 |
| A | 5 | 16 | 133867 | 1464.56 | 441 | 431 | 91.1 |
| A | 15 | 174 | 43897 | 477.07 | 441 | 431 | 91.1 |
| B | 4 | 48 | 119299 | 1402.14 | 444 | 434 | 84.8 |
| B | 0 | 214 | 17114 | 196.76 | 444 | 434 | 84.8 |
| B | 10 | 16 | 10280 | 116.14 | 444 | 434 | 84.8 |
| C | 13 | 61 | 3375 | 29.36 | 431 | 434 | 100.2 |
| C | 9 | 54 | 1754 | 13.18 | 431 | 434 | 100.2 |
| C | 3 | 202 | 1125 | 6.9 | 431 | 434 | 100.2 |
| D | 13 | 105 | 489471 | 4637.76 | 425 | 414 | 105.5 |
| D | 8 | 195 | 293157 | 2776.1 | 425 | 414 | 105.5 |
| D | 7 | 71 | 118087 | 1115.9 | 425 | 414 | 105.5 |
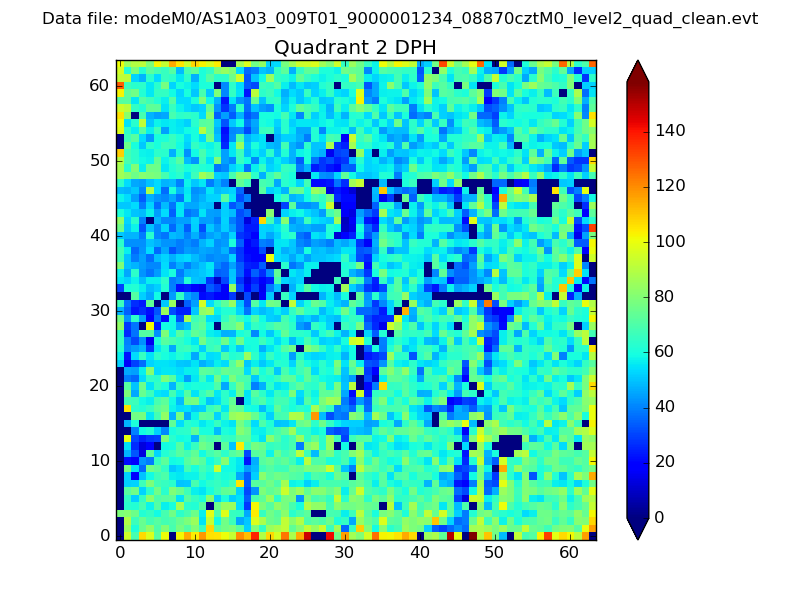
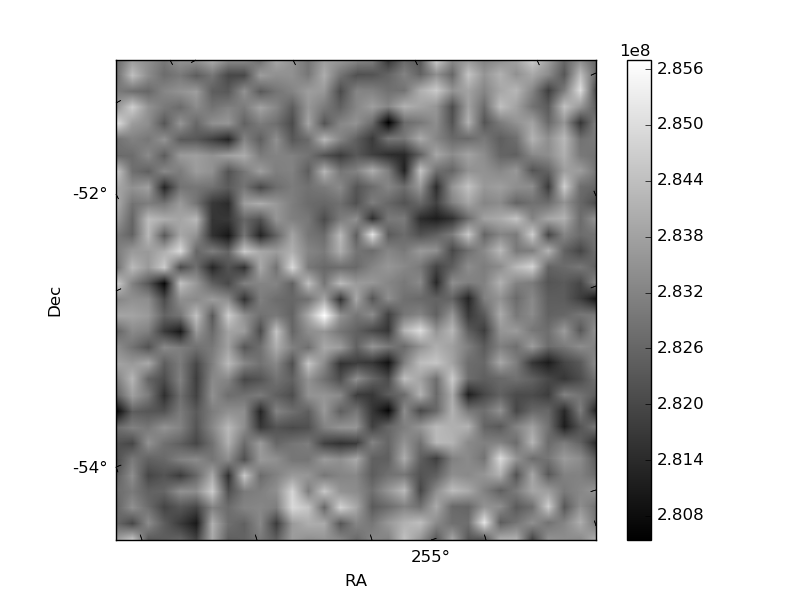
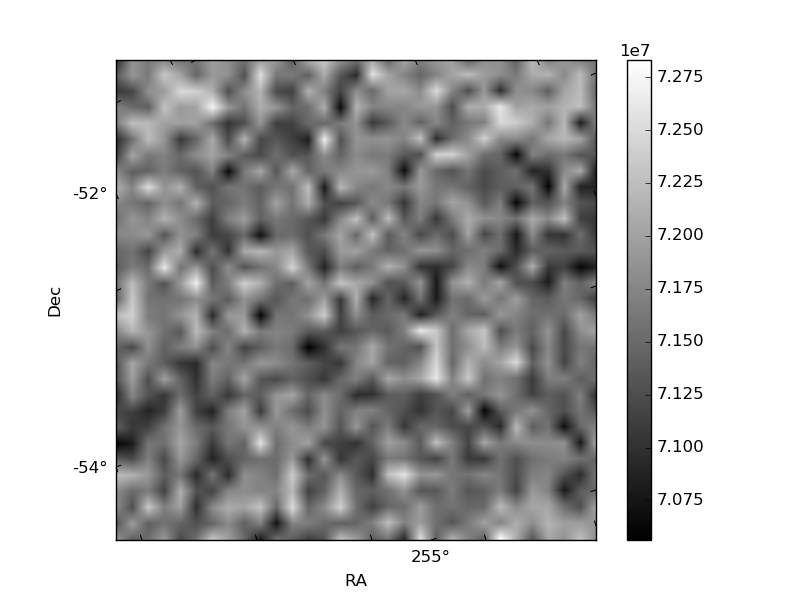
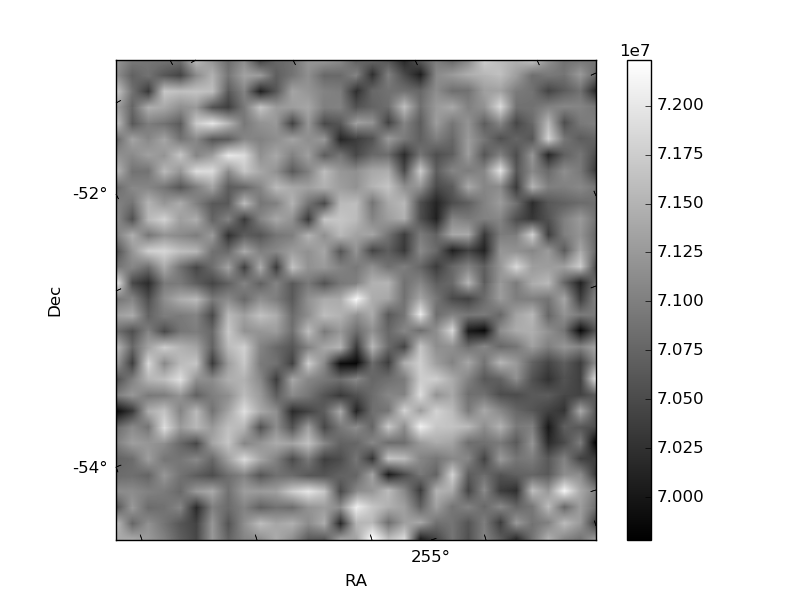
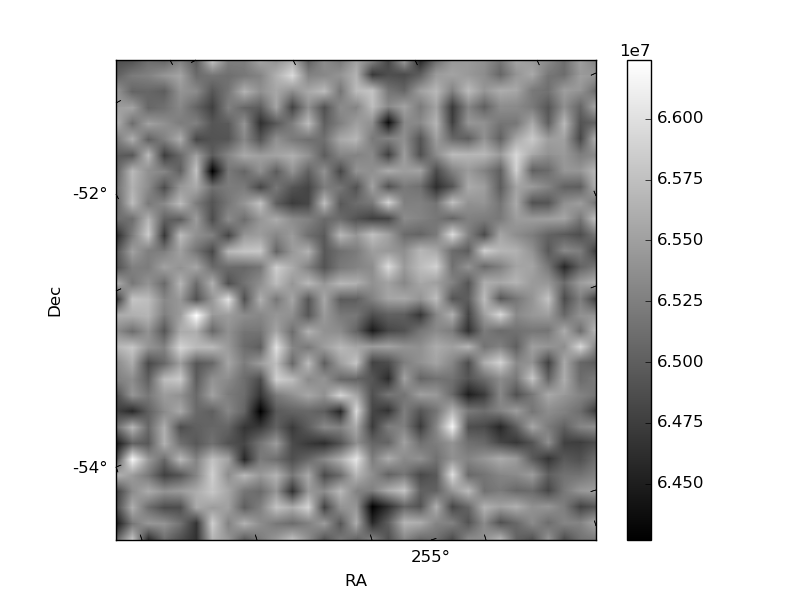
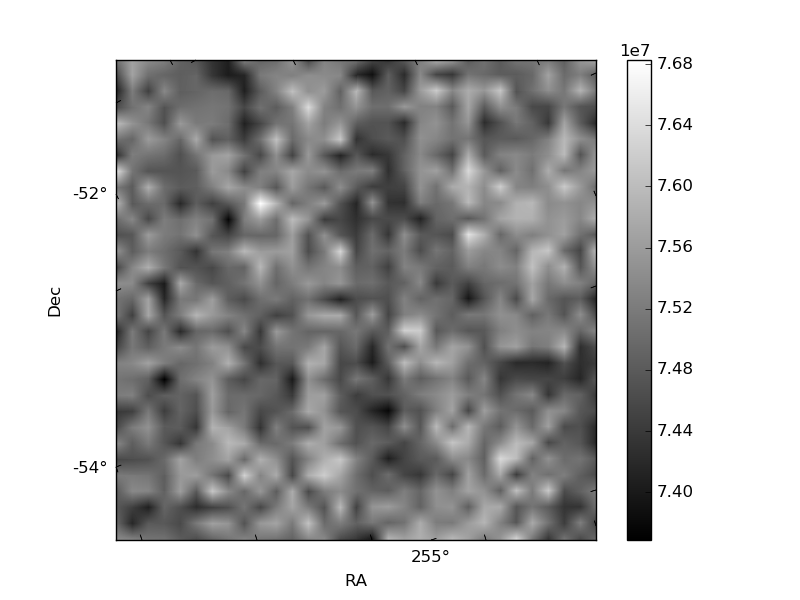
Histogram calculated using DETX and DETY for each event in the final _common_clean file
| Quadrant A | 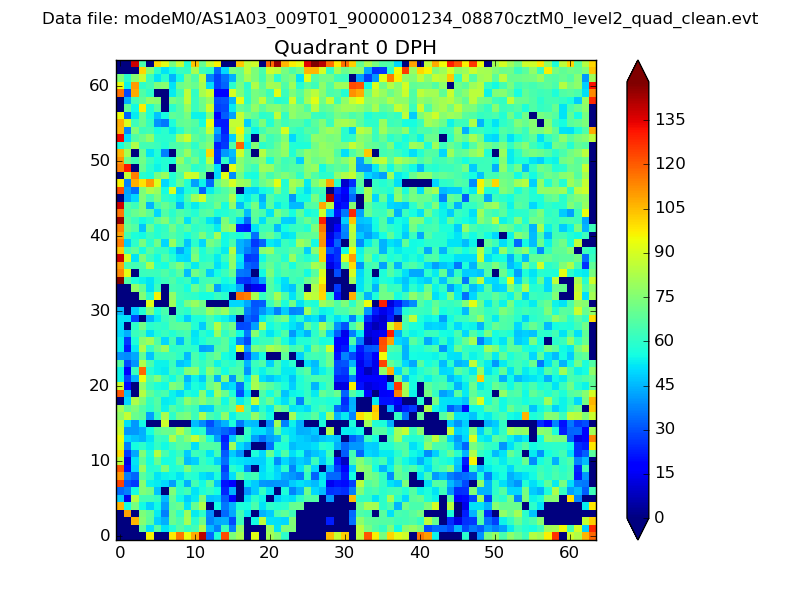 |
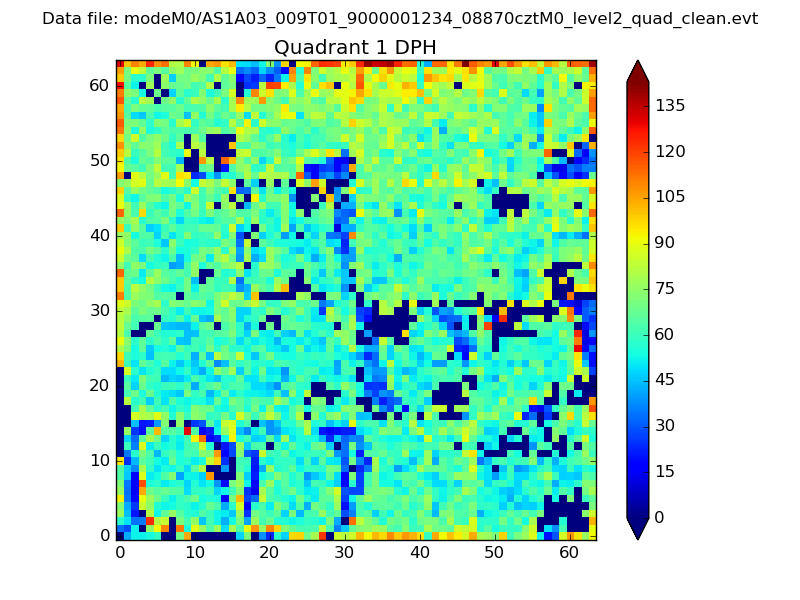 |
Quadrant B |
|---|---|---|---|
| Quadrant D | 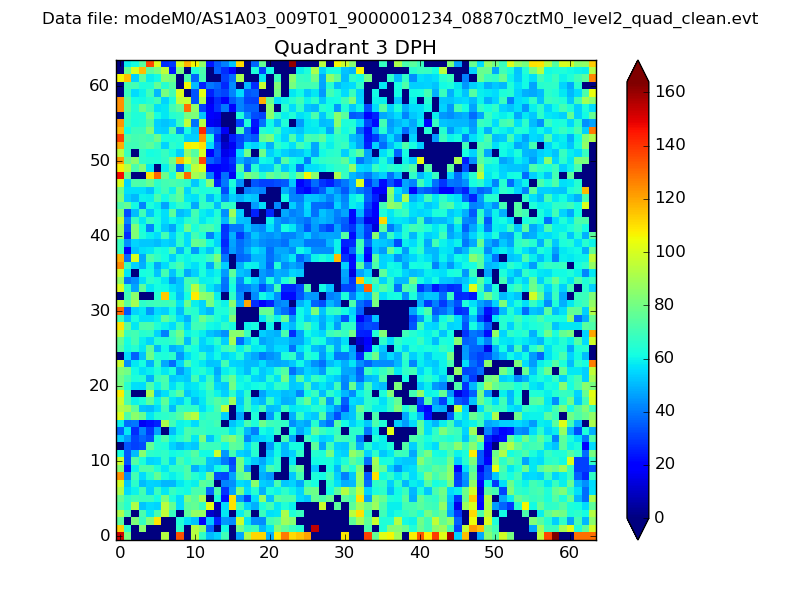 |
 |
Quadrant C |
| Plot type | Count rate plots | Images |
|---|---|---|
| Comparison with Poisson distribution Blue bars denote a histogram of data divided into 1 sec bins. Red curve is a Poisson curve with rate = median count rate of data. |
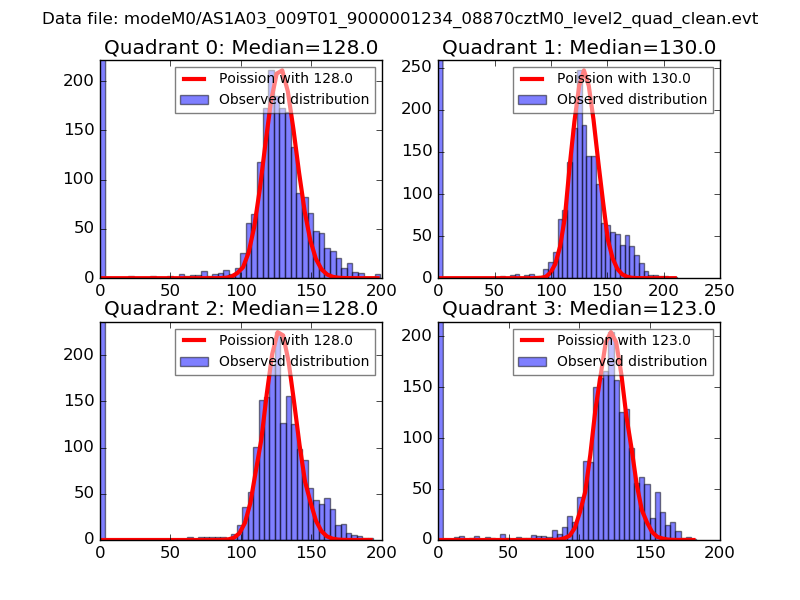 |
 |
| Quadrant-wise count rates Data is divided into 100 sec bins |
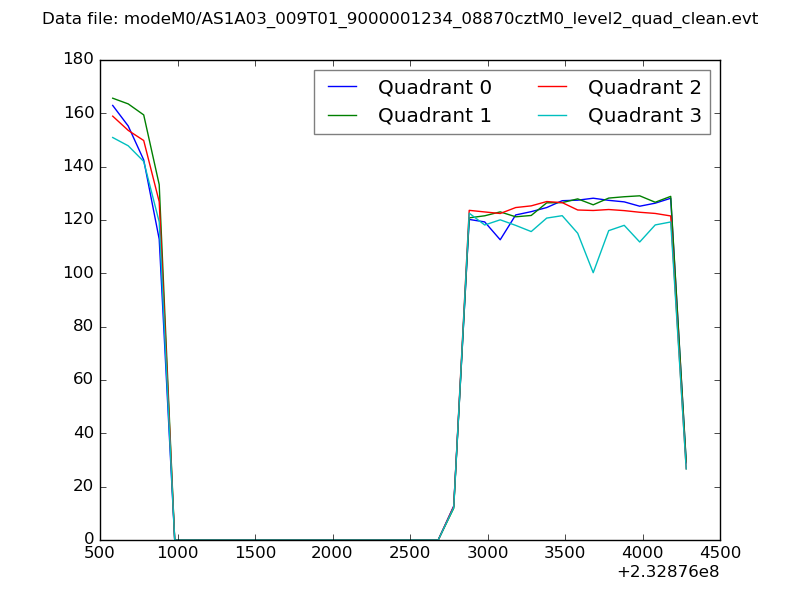 |
|
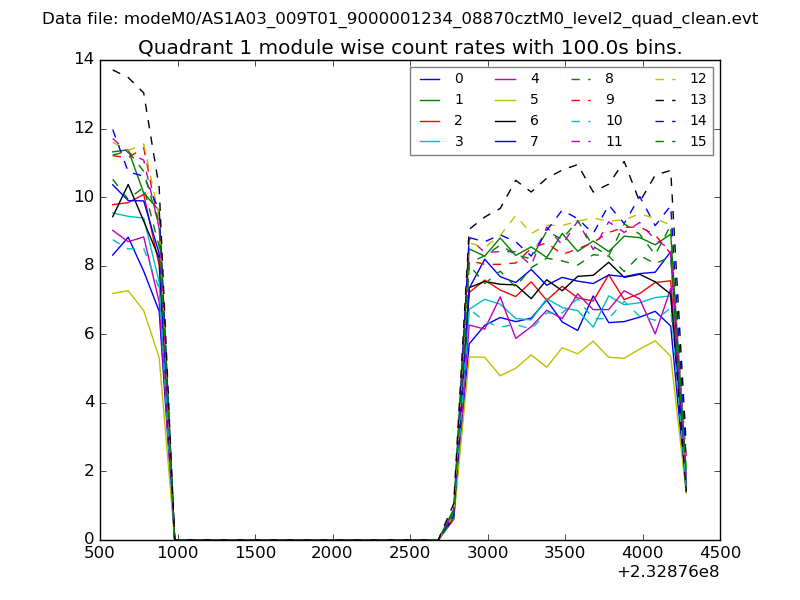
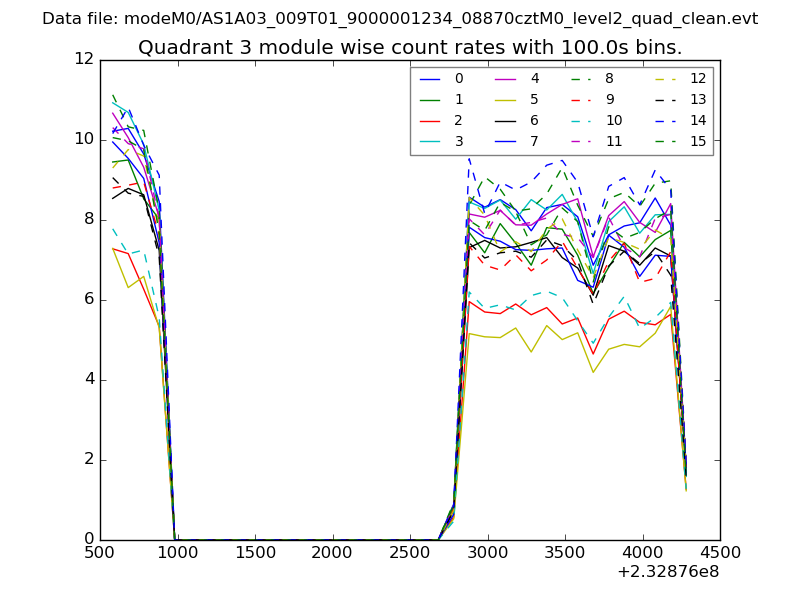
| Module-wise count rates for Quadrant A Data is divided into 100 sec bins |
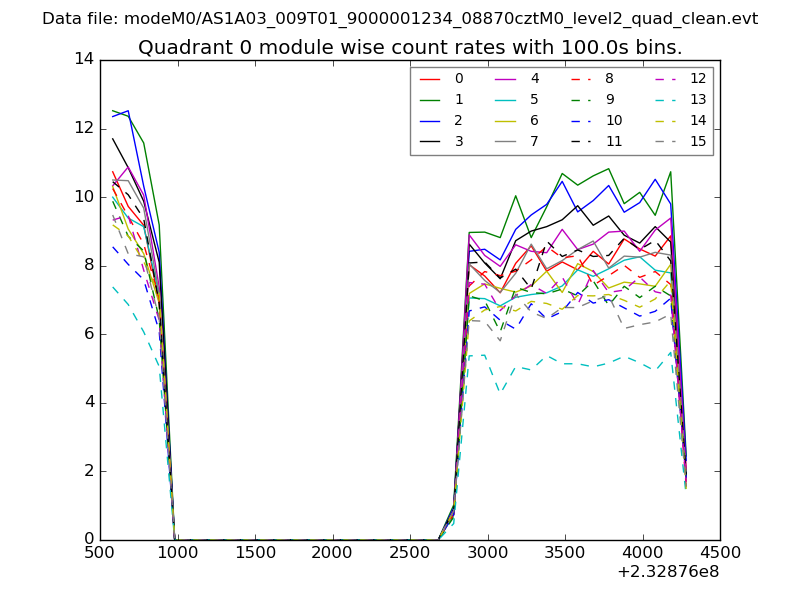 |
 |
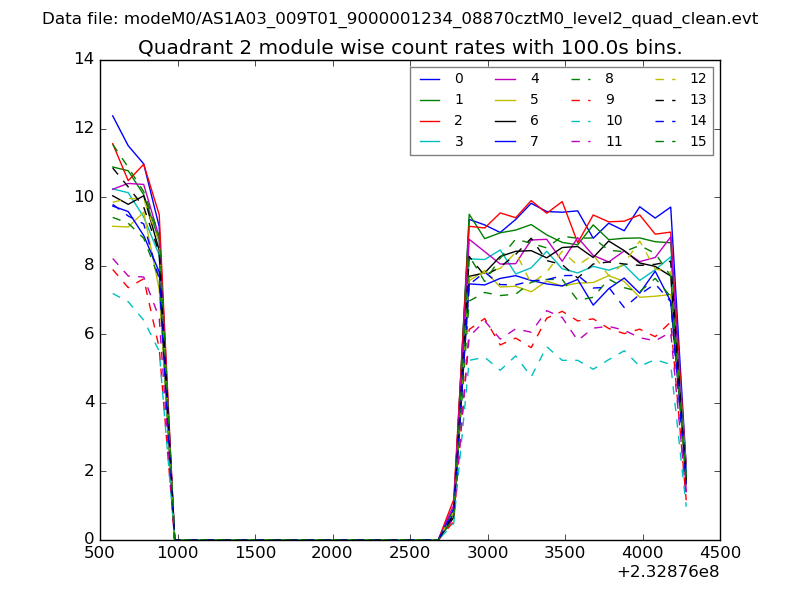
| Module-wise count rates for Quadrant B Data is divided into 100 sec bins |
 |
 |
| Module-wise count rates for Quadrant C Data is divided into 100 sec bins |
 |
 |
| Module-wise count rates for Quadrant D Data is divided into 100 sec bins |
 |
 |
| Parameter | Plot |
|---|---|
| CZT HV Monitor | 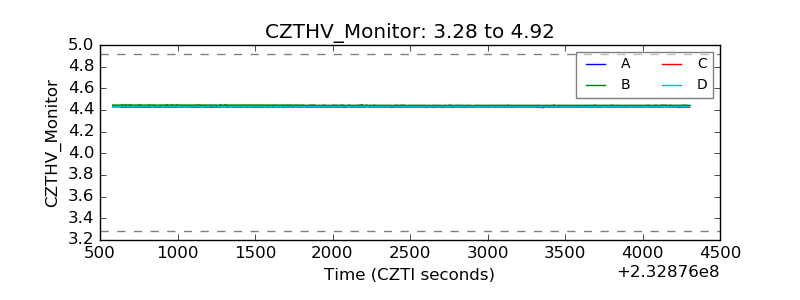 |
| D_VDD | 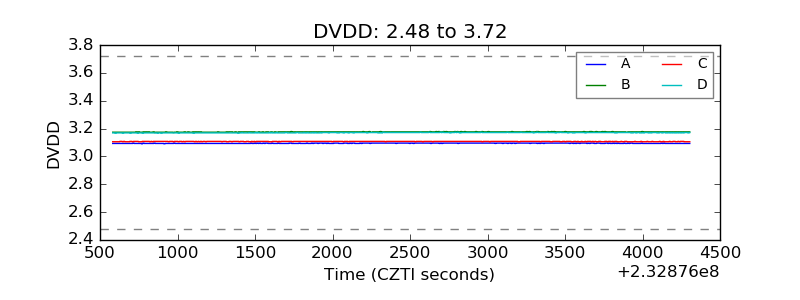 |
| Temperature 1 | 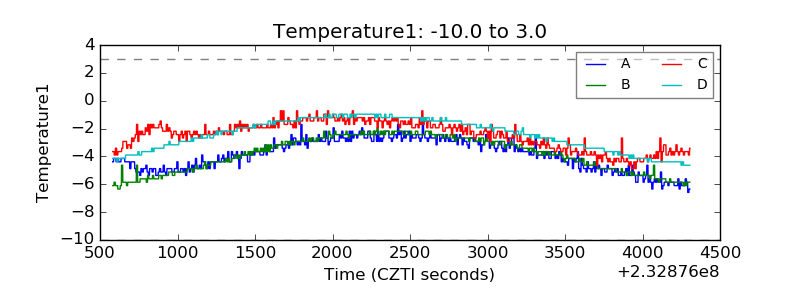 |
| Veto HV Monitor | 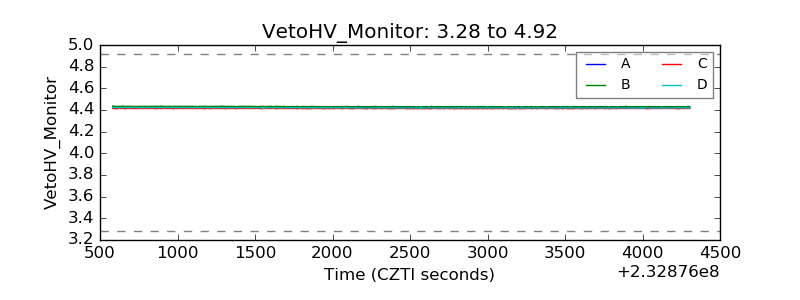 |
| Veto LLD | 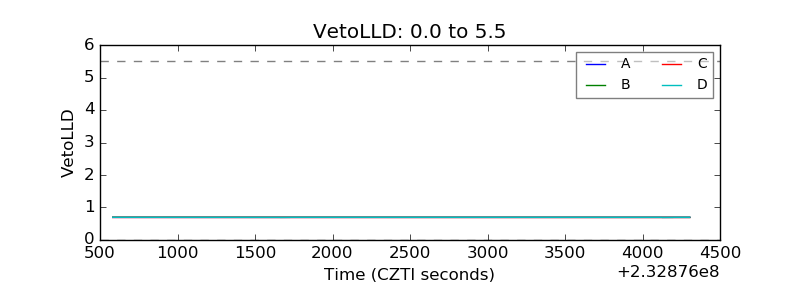 |
| Alpha Counter | 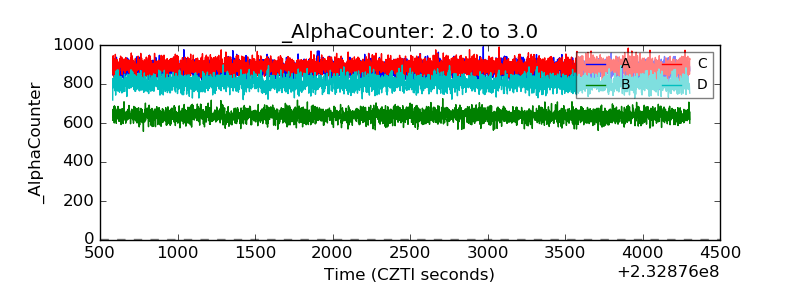 |
| _CPM_Rate | 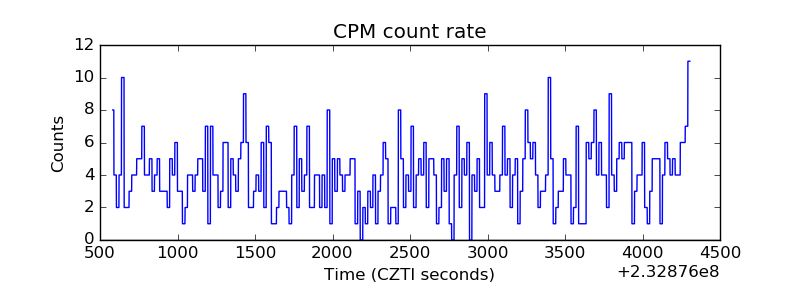 |
| CZT Counter | 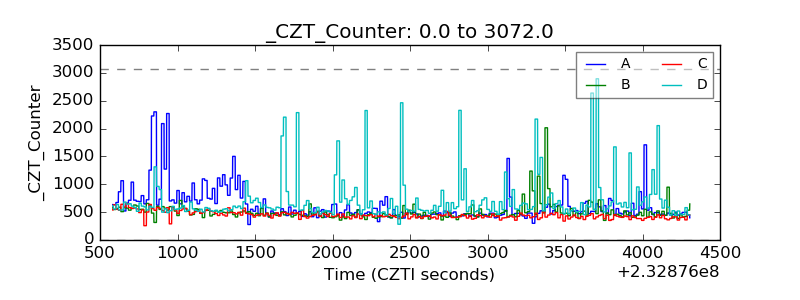 |
| +2.5 Volts monitor | 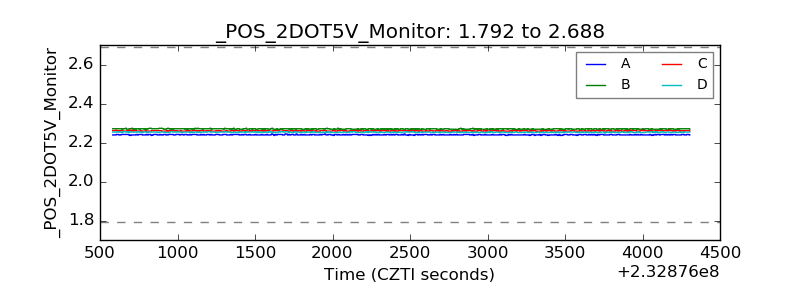 |
| +5 Volts monitor |  |
| _ROLL_ROT | 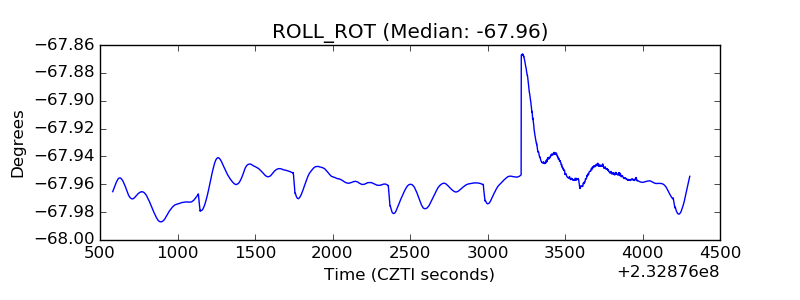 |
| _Roll_DEC | 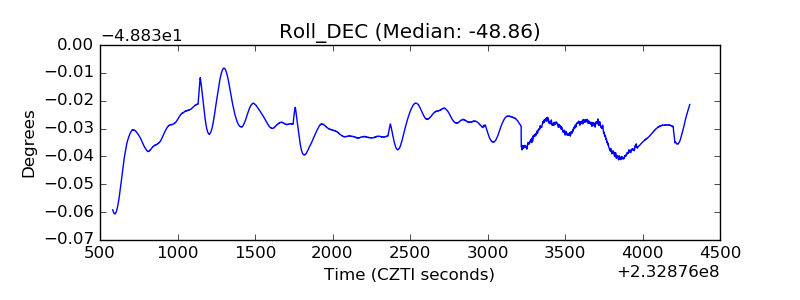 |
| _Roll_RA | 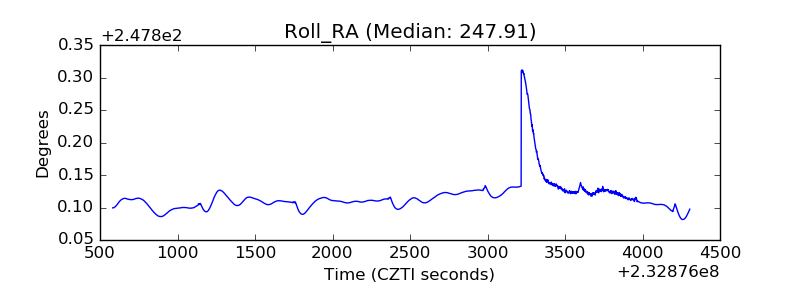 |
| Veto Counter | 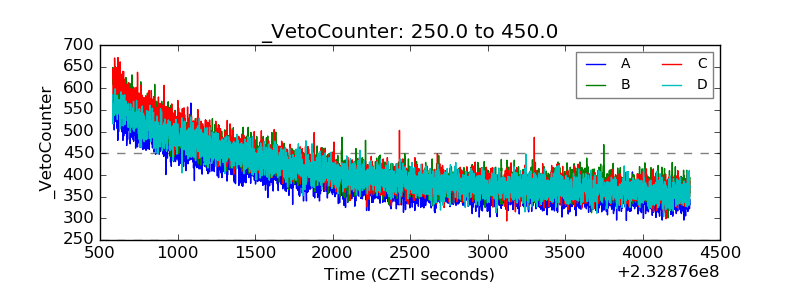 |