| Param | Original file | Final file |
|---|---|---|
| Filename | modeM0/AS1A03_065T01_9000001238cztM0_level2.fits | modeM0/AS1A03_065T01_9000001238cztM0_level2_quad_clean.evt |
| Size (bytes) | 372,939,840 | 315,046,080 |
| Size | 355.7 MB | 300.5 MB |
| Events in quadrant A | 2,237,204 | 1,758,745 |
| Events in quadrant B | 2,185,144 | 1,791,841 |
| Events in quadrant C | 2,216,612 | 1,690,993 |
| Events in quadrant D | 1,918,980 | 1,561,940 |
| Mode SS | |||
|---|---|---|---|
| Quadrant | BADHDUFLAG | Total packets | Discarded packets |
| A | 0 | 812 | 0 |
| B | 0 | 812 | 0 |
| C | 0 | 812 | 0 |
| D | 0 | 812 | 0 |
| Mode M9 | |||
|---|---|---|---|
| Quadrant | BADHDUFLAG | Total packets | Discarded packets |
| A | 0 | 56 | 0 |
| B | 0 | 56 | 0 |
| C | 0 | 56 | 0 |
| D | 0 | 56 | 0 |
| Mode M0 | |||
|---|---|---|---|
| Quadrant | BADHDUFLAG | Total packets | Discarded packets |
| A | 0 | 98665 | 0 |
| B | 0 | 82387 | 0 |
| C | 0 | 83799 | 0 |
| D | 0 | 92983 | 0 |
| Quadrant | Total seconds | Saturated seconds | Saturation percentage |
|---|---|---|---|
| A | 39847 | 700 | 1.756719% |
| B | 39851 | 357 | 0.895837% |
| C | 39857 | 257 | 0.644805% |
| D | 39850 | 644 | 1.616060% |
Noise dominated data is calculated using 1-second bins in cleaned event files. If a bin has >2000 counts, and if more than 50% of those come from <1% of pixels, then it is considered to be noise-dominated and hence unusable.
| Quadrant | # 1 sec bins | Bins with >0 counts | Bins with >2000 counts | High rate bins dominated by noise | Noise dominated (total time) | Noise dominated (detector-on time) | Marked lightcurve |
|---|---|---|---|---|---|---|---|
| A | 45460 | 39856 | 0 | 0 | 0.00% | 0.00% |  |
| B | 45460 | 39858 | 0 | 0 | 0.00% | 0.00% |  |
| C | 45460 | 39858 | 0 | 0 | 0.00% | 0.00% |  |
| D | 45460 | 39851 | 0 | 0 | 0.00% | 0.00% | 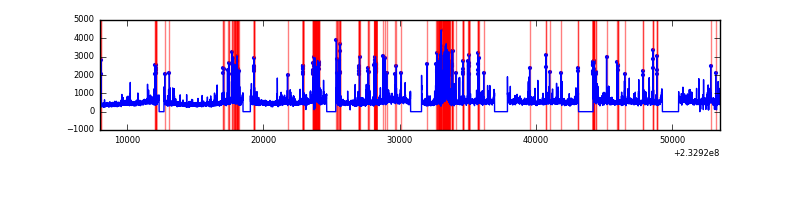 |
Top three noisy pixels from each quadrant. If the there are fewer than three noisy pixels in the level2.evt file, extra rows are filled as -1
| Pixel properties | Quadrant properties | ||||||
|---|---|---|---|---|---|---|---|
| Quadrant | DetID | PixID | Counts | Sigma | Mean | Median | Sigma |
| A | 0 | 29 | 2196 | 11.04 | 582 | 543 | 149.7 |
| A | 7 | 110 | 1858 | 8.79 | 582 | 543 | 149.7 |
| A | 14 | 79 | 1647 | 7.38 | 582 | 543 | 149.7 |
| B | 2 | 9 | 1950 | 11.9 | 576 | 545 | 118.0 |
| B | 12 | 226 | 1462 | 7.77 | 576 | 545 | 118.0 |
| B | 14 | 254 | 1453 | 7.69 | 576 | 545 | 118.0 |
| C | 1 | 80 | 1592 | 6.72 | 585 | 540 | 156.6 |
| C | 1 | 81 | 1587 | 6.69 | 585 | 540 | 156.6 |
| C | 12 | 241 | 1565 | 6.55 | 585 | 540 | 156.6 |
| D | 3 | 14 | 1427 | 6.33 | 547 | 498 | 146.9 |
| D | 7 | 5 | 1413 | 6.23 | 547 | 498 | 146.9 |
| D | 3 | 31 | 1368 | 5.92 | 547 | 498 | 146.9 |
Histogram calculated using DETX and DETY for each event in the final _common_clean file
| Quadrant A |  |
 |
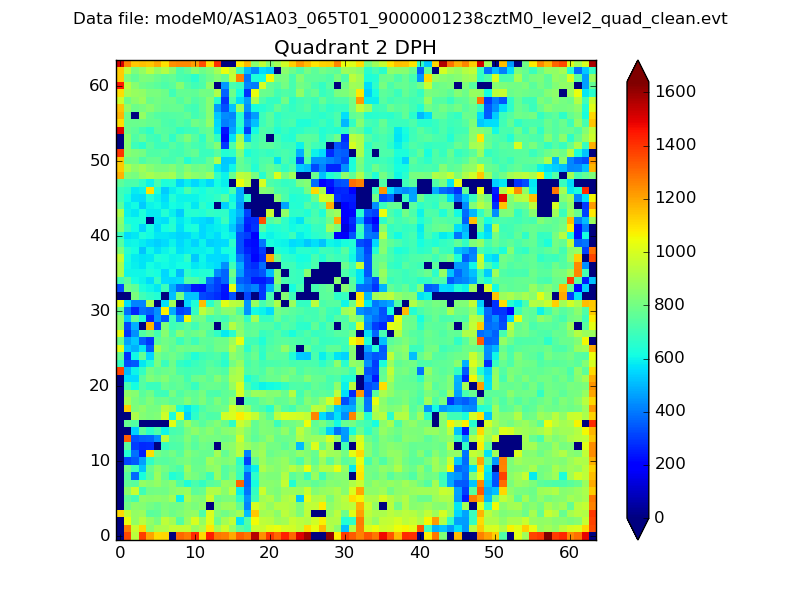
Quadrant B |
|---|---|---|---|
| Quadrant D | 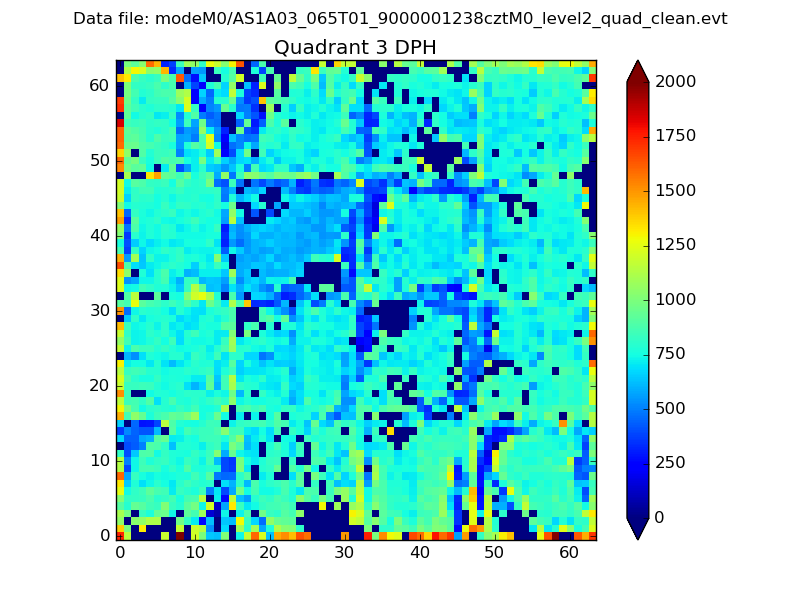 |
 |
Quadrant C |
| Plot type | Count rate plots | Images |
|---|---|---|
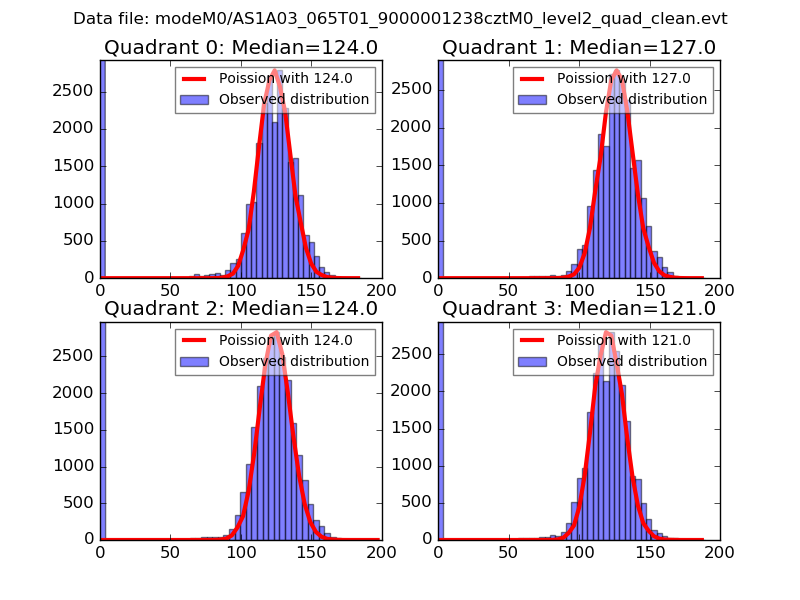
| Comparison with Poisson distribution Blue bars denote a histogram of data divided into 1 sec bins. Red curve is a Poisson curve with rate = median count rate of data. |
 |
 |
| Quadrant-wise count rates Data is divided into 100 sec bins |
 |
|
| Module-wise count rates for Quadrant A Data is divided into 100 sec bins |
 |
 |
| Module-wise count rates for Quadrant B Data is divided into 100 sec bins |
 |
 |
| Module-wise count rates for Quadrant C Data is divided into 100 sec bins |
 |
 |
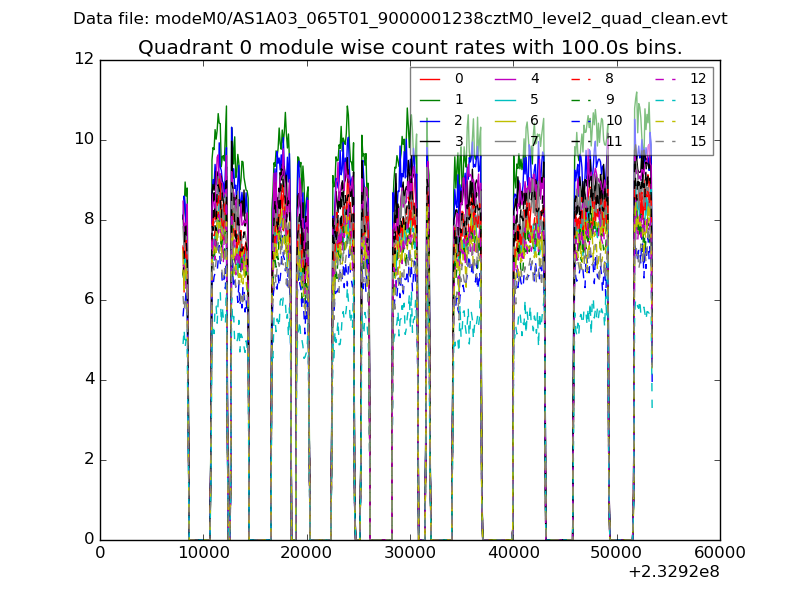
| Module-wise count rates for Quadrant D Data is divided into 100 sec bins |
 |
 |
| Parameter | Plot |
|---|---|
| CZT HV Monitor |  |
| D_VDD | 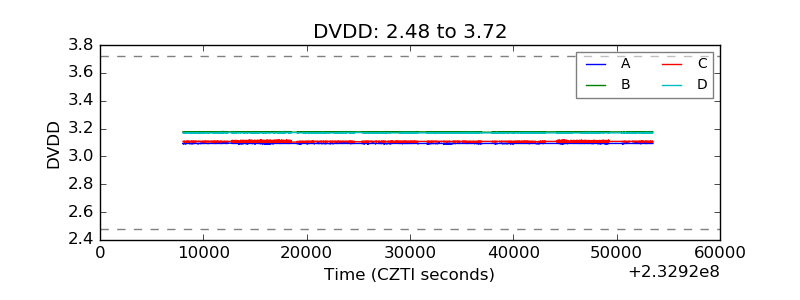 |
| Temperature 1 |  |
| Veto HV Monitor | 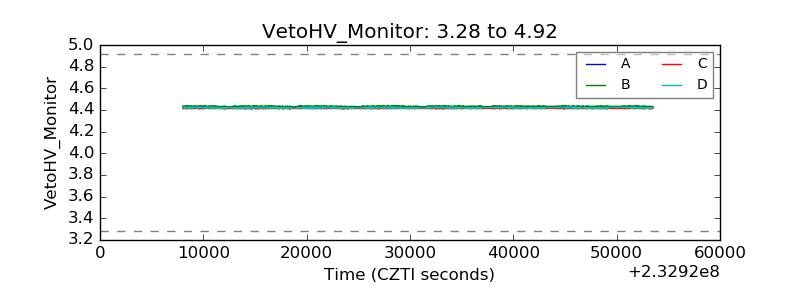 |
| Veto LLD |  |
| Alpha Counter |  |
| _CPM_Rate | 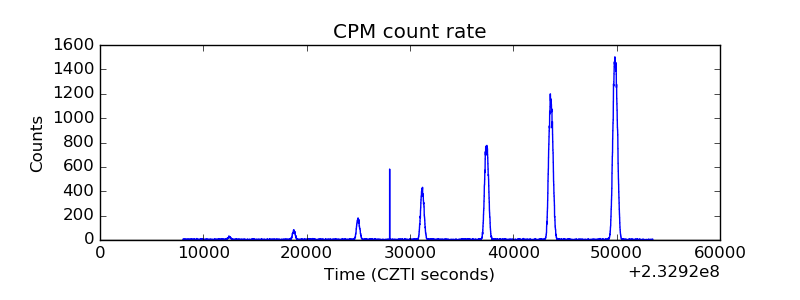 |
| CZT Counter |  |
| +2.5 Volts monitor |  |
| +5 Volts monitor |  |
| _ROLL_ROT |  |
| _Roll_DEC |  |
| _Roll_RA | 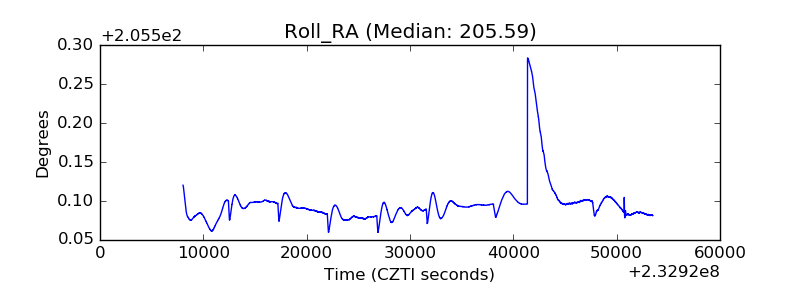 |
| Veto Counter | 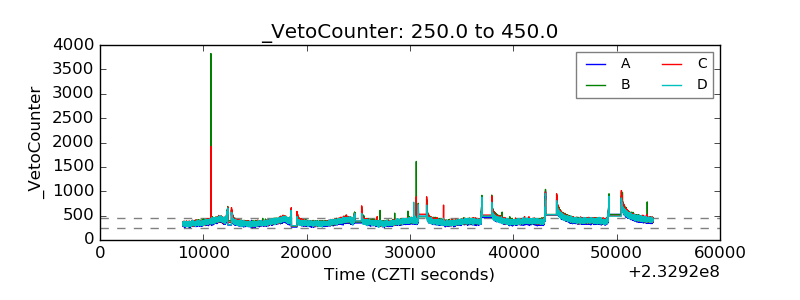 |