| Param | Original file | Final file |
|---|---|---|
| Filename | modeM0/AS1A03_065T01_9000001238_08878cztM0_level2.evt | modeM0/AS1A03_065T01_9000001238_08878cztM0_level2_quad_clean.evt |
| Size (bytes) | 420,382,080 | 73,987,200 |
| Size | 400.9 MB | 70.6 MB |
| Events in quadrant A | 3,592,121 | 453,563 |
| Events in quadrant B | 2,813,550 | 464,143 |
| Events in quadrant C | 3,140,277 | 456,216 |
| Events in quadrant D | 2,779,314 | 449,091 |
| Mode SS | |||
|---|---|---|---|
| Quadrant | BADHDUFLAG | Total packets | Discarded packets |
| A | 0 | 120 | 0 |
| B | 0 | 120 | 0 |
| C | 0 | 120 | 0 |
| D | 0 | 120 | 0 |
| Mode M9 | |||
|---|---|---|---|
| Quadrant | BADHDUFLAG | Total packets | Discarded packets |
| A | 0 | 4 | 0 |
| B | 0 | 4 | 0 |
| C | 0 | 4 | 0 |
| D | 0 | 4 | 0 |
| Mode M0 | |||
|---|---|---|---|
| Quadrant | BADHDUFLAG | Total packets | Discarded packets |
| A | 0 | 14939 | 2 |
| B | 0 | 12449 | 1 |
| C | 0 | 13135 | 1 |
| D | 0 | 12588 | 1 |
| Quadrant | Total seconds | Saturated seconds | Saturation percentage |
|---|---|---|---|
| A | 5978 | 53 | 0.886584% |
| B | 5978 | 29 | 0.485112% |
| C | 5978 | 7 | 0.117096% |
| D | 5978 | 18 | 0.301104% |
Noise dominated data is calculated using 1-second bins in cleaned event files. If a bin has >2000 counts, and if more than 50% of those come from <1% of pixels, then it is considered to be noise-dominated and hence unusable.
| Quadrant | # 1 sec bins | Bins with >0 counts | Bins with >2000 counts | High rate bins dominated by noise | Noise dominated (total time) | Noise dominated (detector-on time) | Marked lightcurve |
|---|---|---|---|---|---|---|---|
| A | 6338 | 5979 | 12 | 12 | 0.19% | 0.20% | 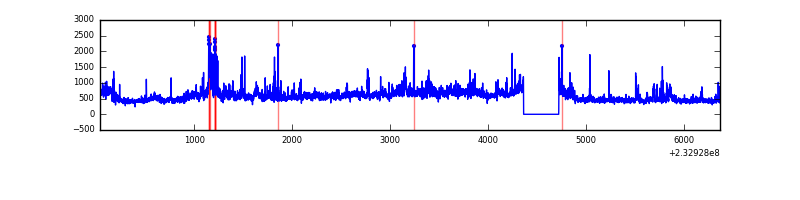 |
| B | 6338 | 5979 | 5 | 5 | 0.08% | 0.08% | 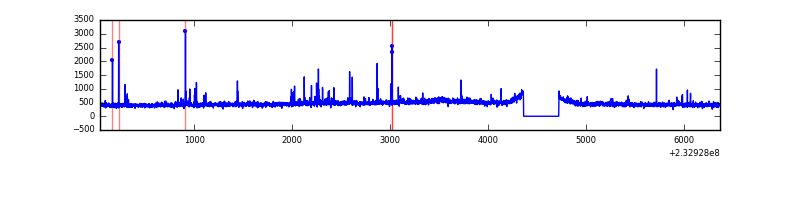 |
| C | 6338 | 5979 | 1 | 1 | 0.02% | 0.02% | 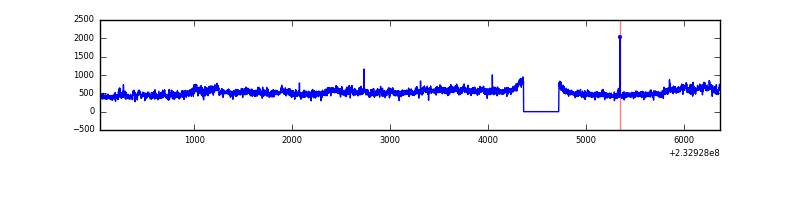 |
| D | 6338 | 5979 | 11 | 11 | 0.17% | 0.18% | 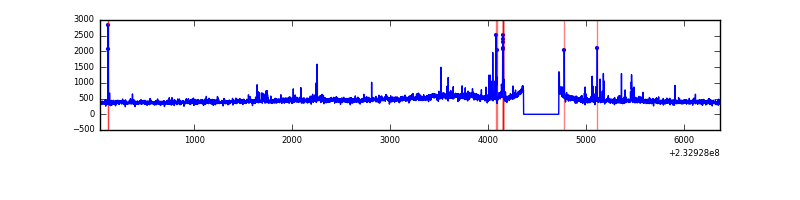 |
Top three noisy pixels from each quadrant. If the there are fewer than three noisy pixels in the level2.evt file, extra rows are filled as -1
| Pixel properties | Quadrant properties | ||||||
|---|---|---|---|---|---|---|---|
| Quadrant | DetID | PixID | Counts | Sigma | Mean | Median | Sigma |
| A | 8 | 5 | 746328 | 5245.46 | 693 | 677 | 142.2 |
| A | 15 | 174 | 113165 | 791.32 | 693 | 677 | 142.2 |
| A | 5 | 16 | 30930 | 212.82 | 693 | 677 | 142.2 |
| B | 10 | 16 | 77641 | 569.95 | 697 | 680 | 135.0 |
| B | 12 | 111 | 14972 | 105.84 | 697 | 680 | 135.0 |
| B | 11 | 111 | 12344 | 86.38 | 697 | 680 | 135.0 |
| C | 9 | 68 | 487616 | 3086.4 | 677 | 681 | 157.8 |
| C | 8 | 128 | 5596 | 31.15 | 677 | 681 | 157.8 |
| C | 13 | 61 | 5059 | 27.75 | 677 | 681 | 157.8 |
| D | 8 | 195 | 76314 | 459.76 | 672 | 656 | 164.6 |
| D | 1 | 52 | 46427 | 278.14 | 672 | 656 | 164.6 |
| D | 2 | 234 | 23458 | 138.56 | 672 | 656 | 164.6 |
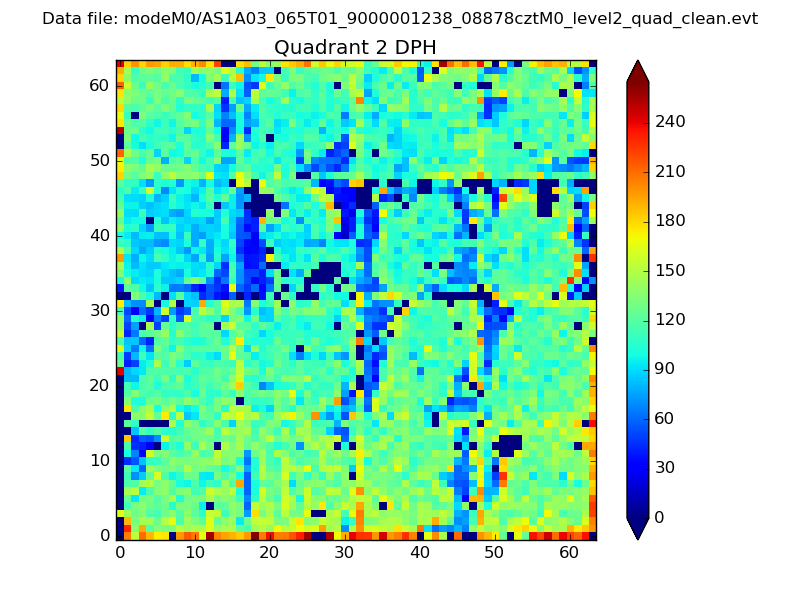
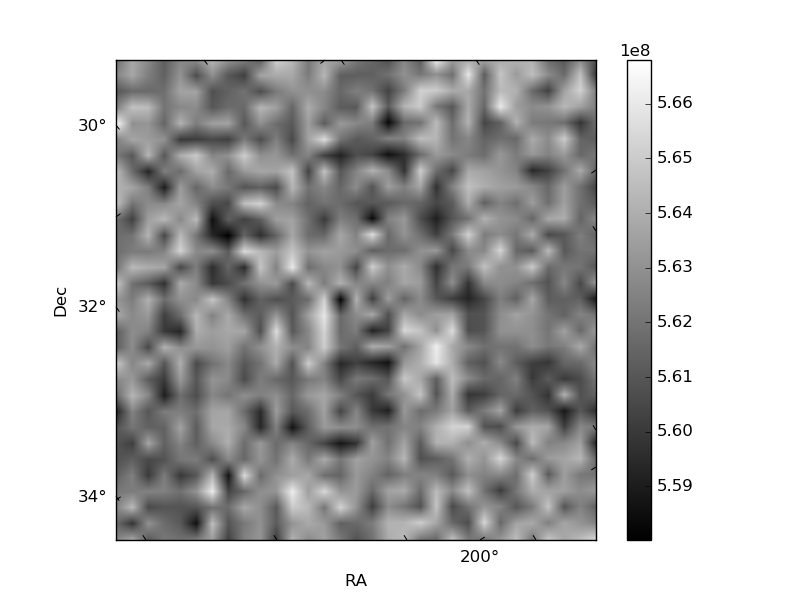
Histogram calculated using DETX and DETY for each event in the final _common_clean file
| Quadrant A | 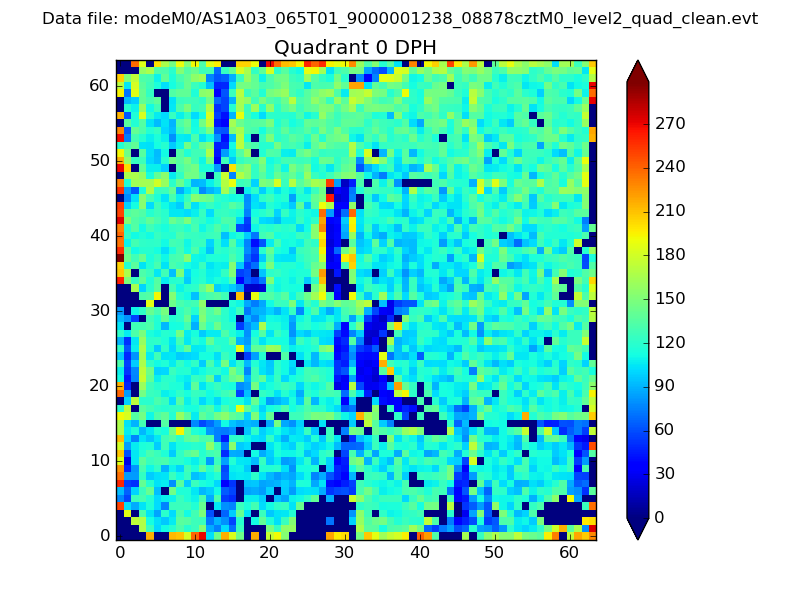 |
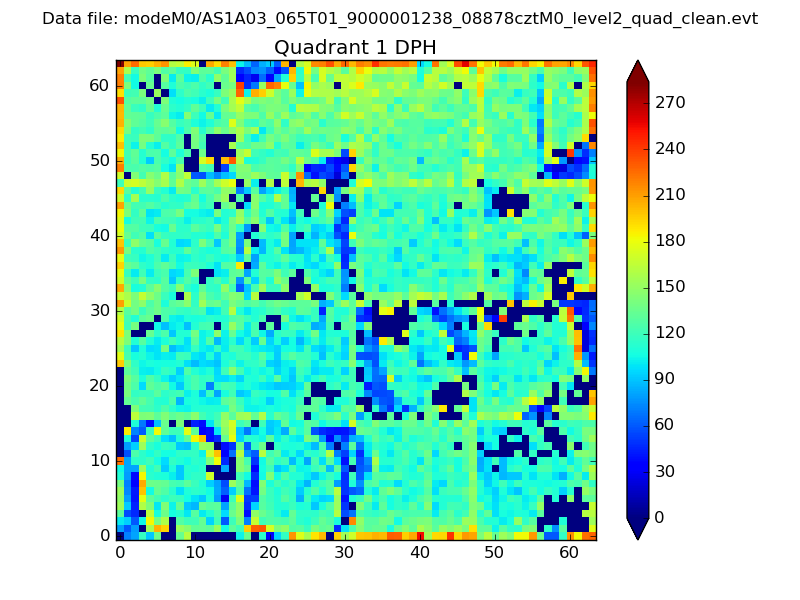 |
Quadrant B |
|---|---|---|---|
| Quadrant D | 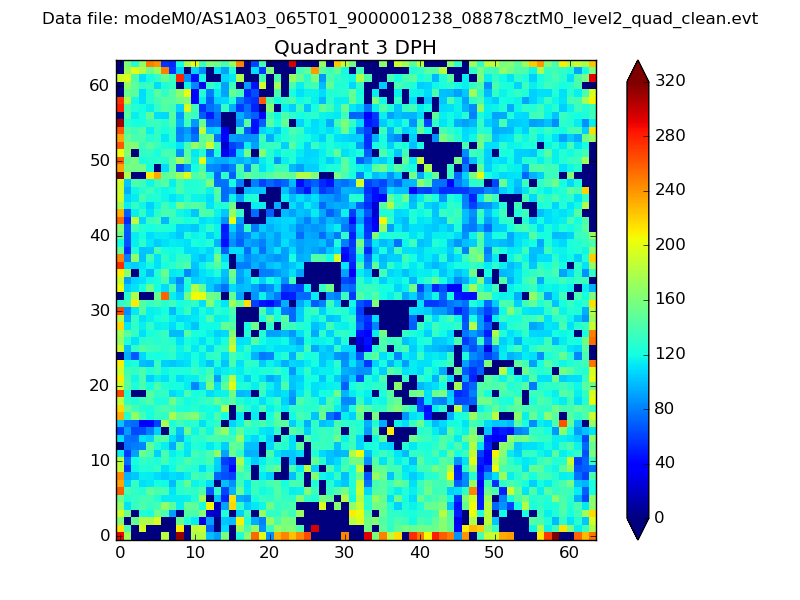 |
 |
Quadrant C |
| Plot type | Count rate plots | Images |
|---|---|---|
| Comparison with Poisson distribution Blue bars denote a histogram of data divided into 1 sec bins. Red curve is a Poisson curve with rate = median count rate of data. |
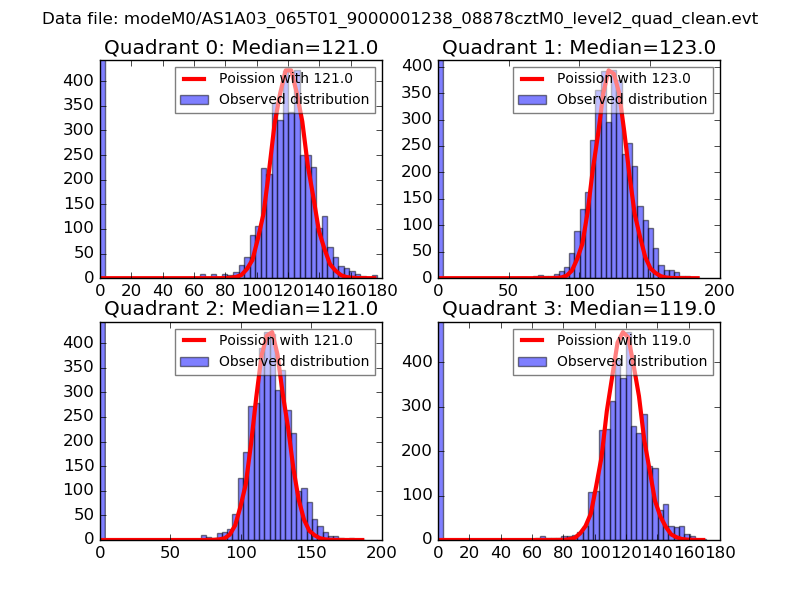 |
 |
| Quadrant-wise count rates Data is divided into 100 sec bins |
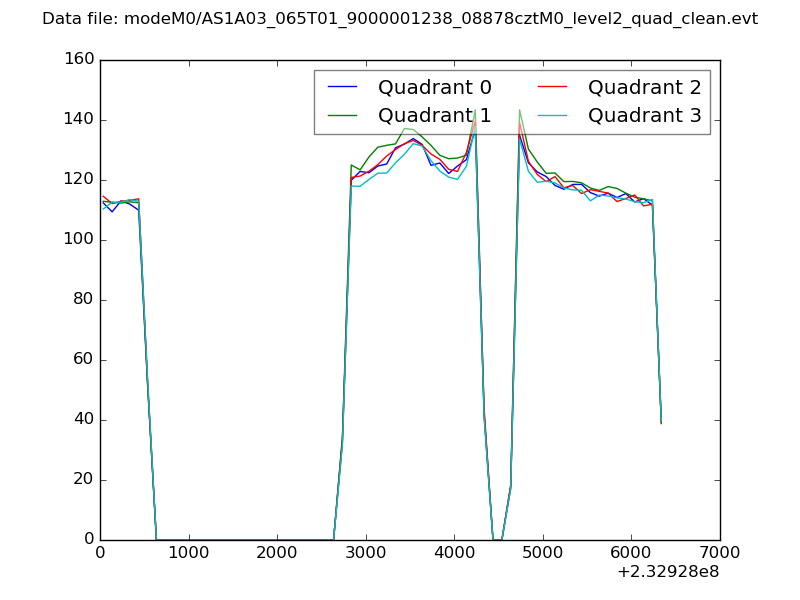 |
|
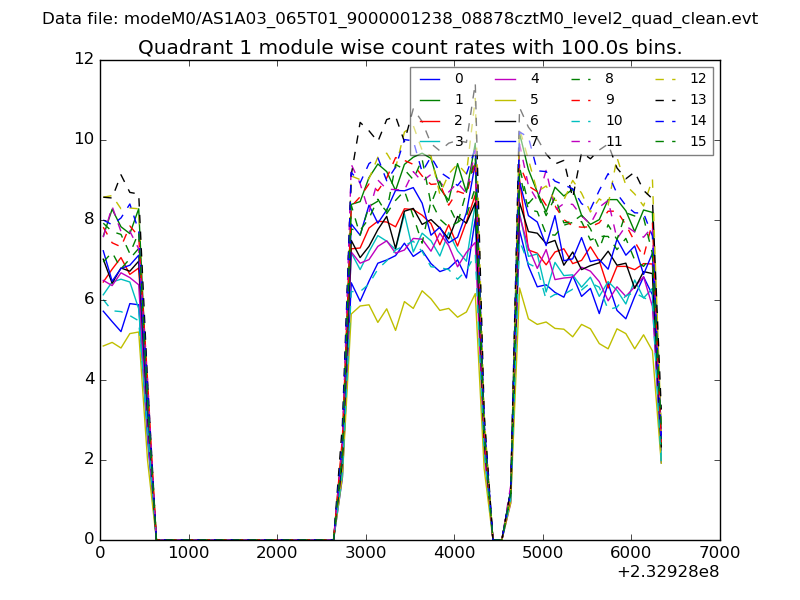
| Module-wise count rates for Quadrant A Data is divided into 100 sec bins |
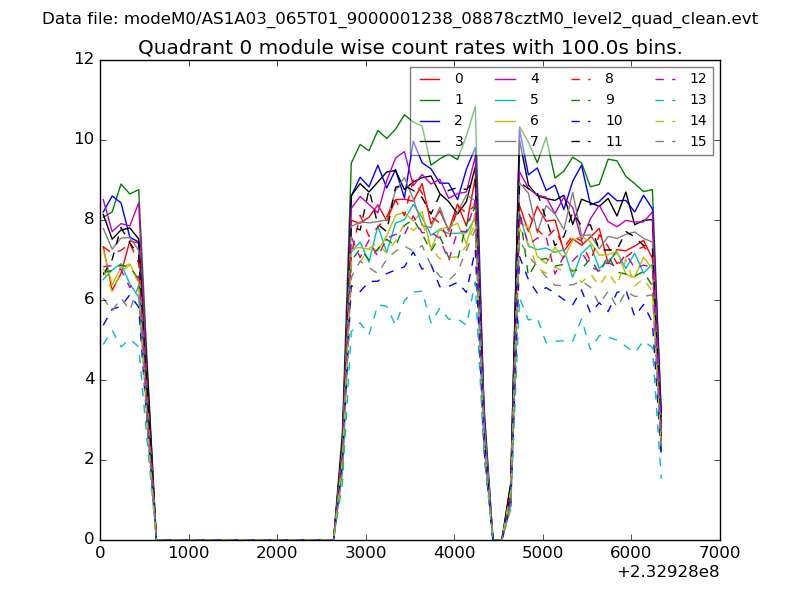 |
 |
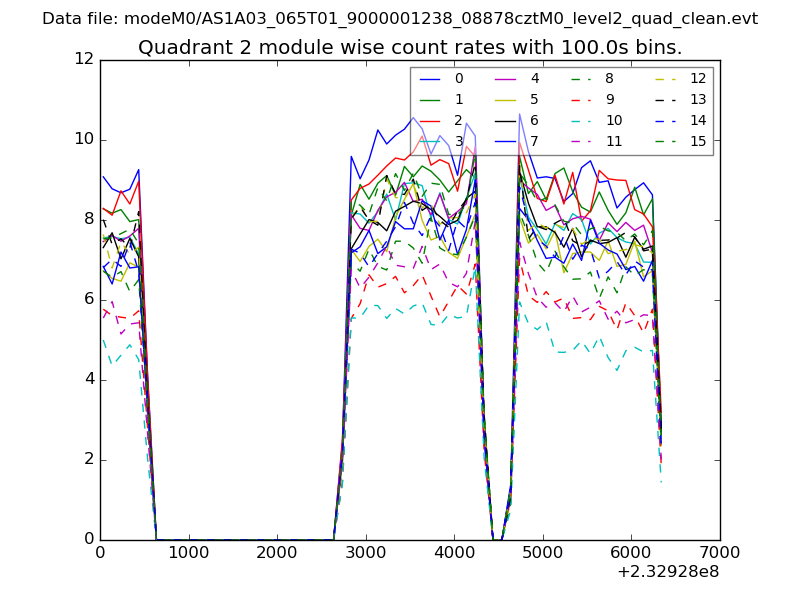
| Module-wise count rates for Quadrant B Data is divided into 100 sec bins |
 |
 |
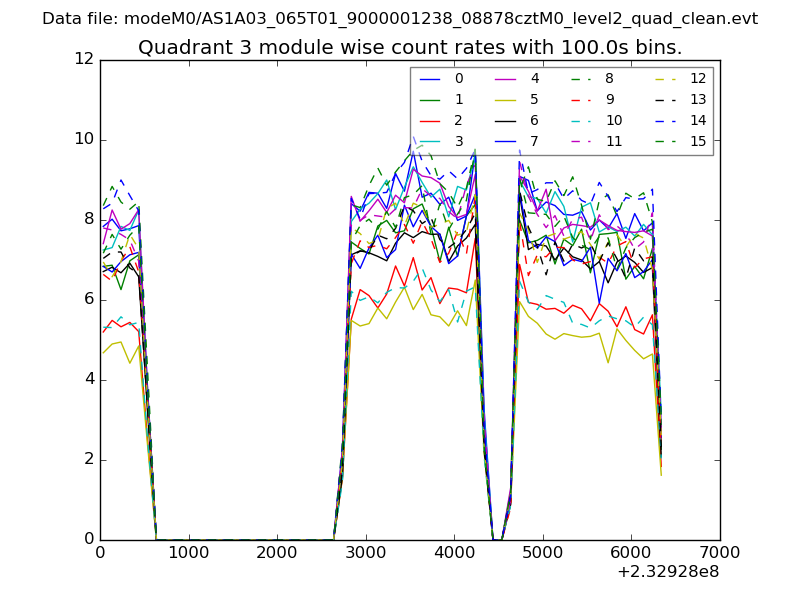
| Module-wise count rates for Quadrant C Data is divided into 100 sec bins |
 |
 |
| Module-wise count rates for Quadrant D Data is divided into 100 sec bins |
 |
 |
| Parameter | Plot |
|---|---|
| CZT HV Monitor | 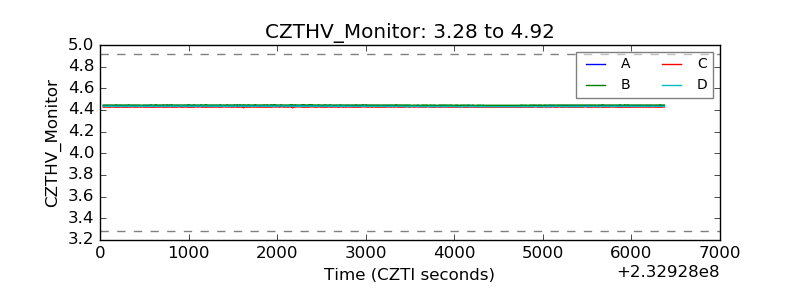 |
| D_VDD | 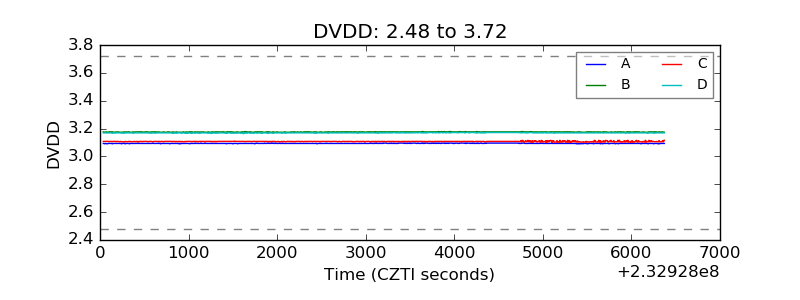 |
| Temperature 1 | 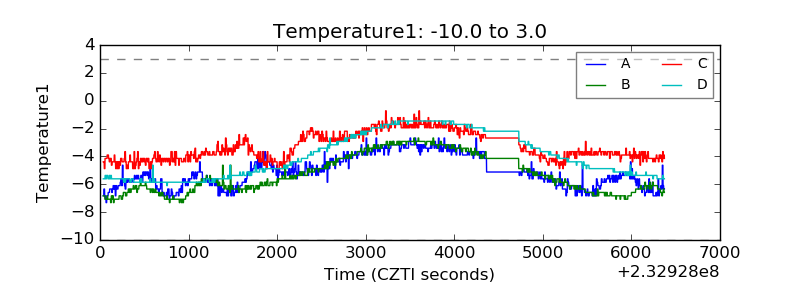 |
| Veto HV Monitor | 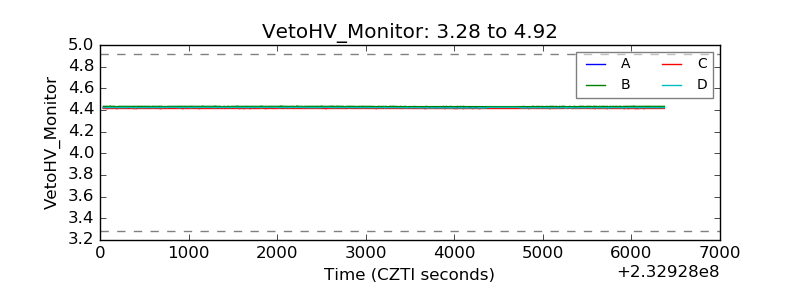 |
| Veto LLD | 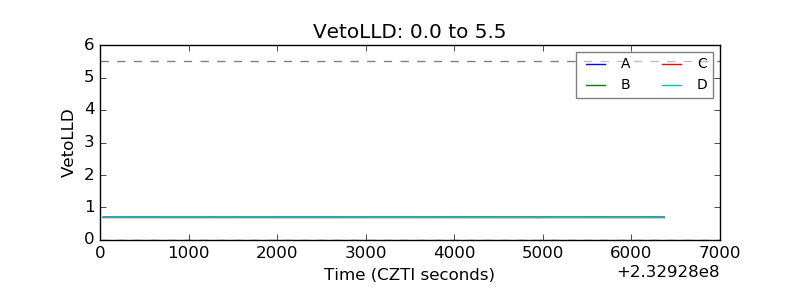 |
| Alpha Counter | 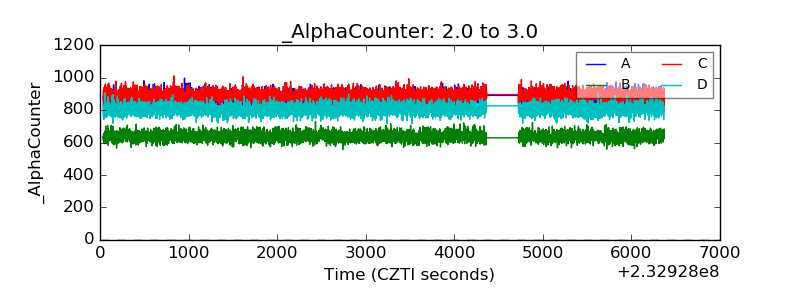 |
| _CPM_Rate | 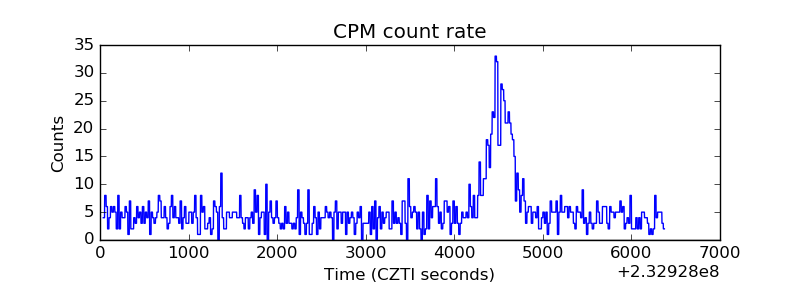 |
| CZT Counter |  |
| +2.5 Volts monitor |  |
| +5 Volts monitor |  |
| _ROLL_ROT | 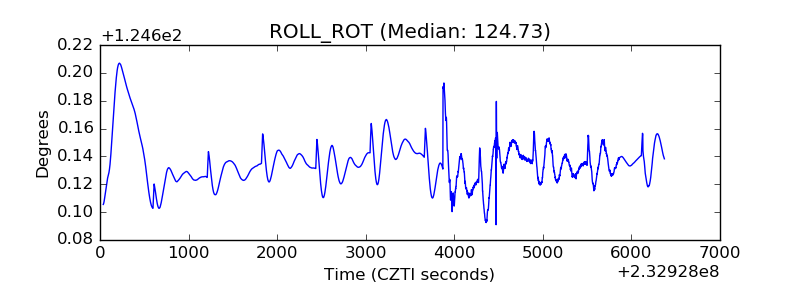 |
| _Roll_DEC | 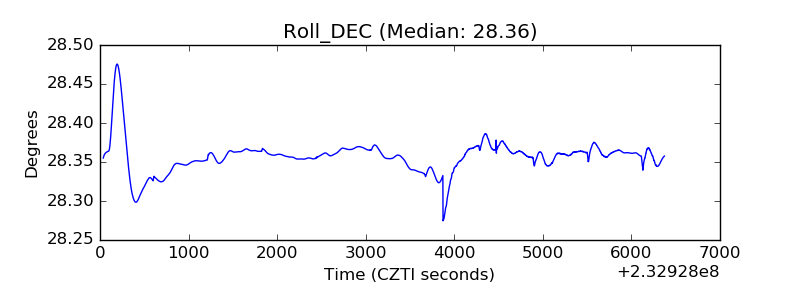 |
| _Roll_RA | 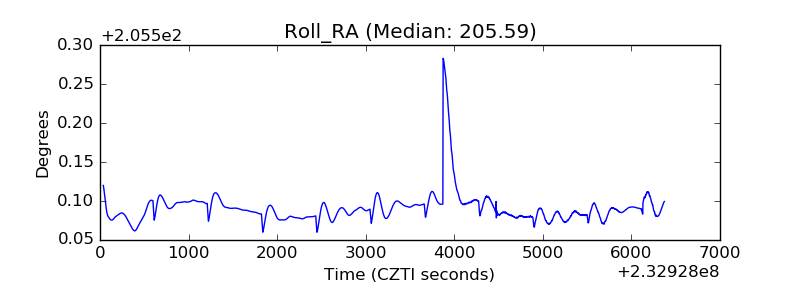 |
| Veto Counter | 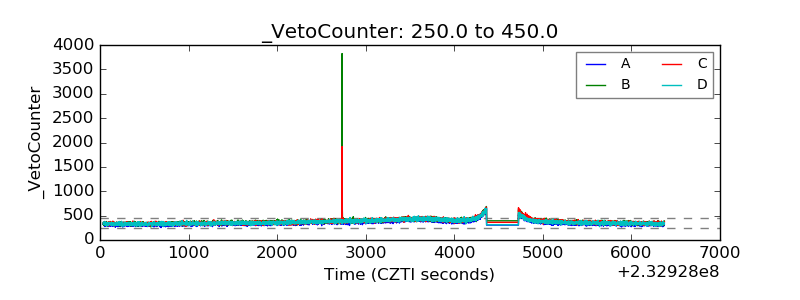 |