| Param | Original file | Final file |
|---|---|---|
| Filename | modeM0/AS1A03_065T01_9000001238_08880cztM0_level2.evt | modeM0/AS1A03_065T01_9000001238_08880cztM0_level2_quad_clean.evt |
| Size (bytes) | 1,018,624,320 | 171,907,200 |
| Size | 971.4 MB | 163.9 MB |
| Events in quadrant A | 9,058,691 | 1,056,664 |
| Events in quadrant B | 6,575,650 | 1,086,906 |
| Events in quadrant C | 6,944,302 | 1,069,769 |
| Events in quadrant D | 7,333,793 | 1,036,091 |
| Mode SS | |||
|---|---|---|---|
| Quadrant | BADHDUFLAG | Total packets | Discarded packets |
| A | 0 | 282 | 0 |
| B | 0 | 282 | 0 |
| C | 0 | 282 | 0 |
| D | 0 | 282 | 0 |
| Mode M9 | |||
|---|---|---|---|
| Quadrant | BADHDUFLAG | Total packets | Discarded packets |
| A | 0 | 16 | 0 |
| B | 0 | 16 | 0 |
| C | 0 | 16 | 0 |
| D | 0 | 16 | 0 |
| Mode M0 | |||
|---|---|---|---|
| Quadrant | BADHDUFLAG | Total packets | Discarded packets |
| A | 0 | 36403 | 25 |
| B | 0 | 28768 | 7 |
| C | 0 | 30057 | 7 |
| D | 0 | 31168 | 12 |
| Quadrant | Total seconds | Saturated seconds | Saturation percentage |
|---|---|---|---|
| A | 13859 | 269 | 1.940977% |
| B | 13863 | 84 | 0.605929% |
| C | 13863 | 25 | 0.180336% |
| D | 13861 | 146 | 1.053315% |
Noise dominated data is calculated using 1-second bins in cleaned event files. If a bin has >2000 counts, and if more than 50% of those come from <1% of pixels, then it is considered to be noise-dominated and hence unusable.
| Quadrant | # 1 sec bins | Bins with >0 counts | Bins with >2000 counts | High rate bins dominated by noise | Noise dominated (total time) | Noise dominated (detector-on time) | Marked lightcurve |
|---|---|---|---|---|---|---|---|
| A | 15440 | 13867 | 178 | 178 | 1.15% | 1.28% | 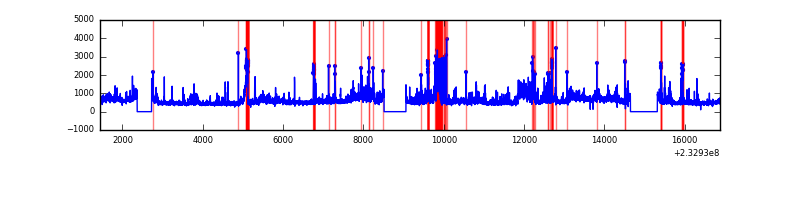 |
| B | 15440 | 13868 | 12 | 12 | 0.08% | 0.09% | 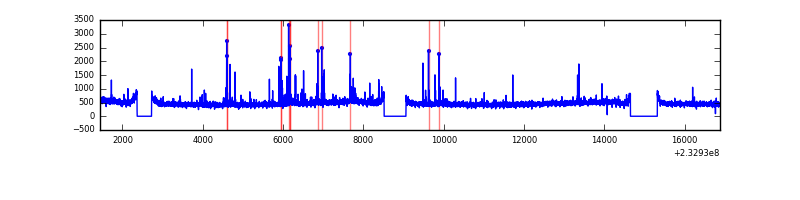 |
| C | 15440 | 13868 | 6 | 6 | 0.04% | 0.04% | 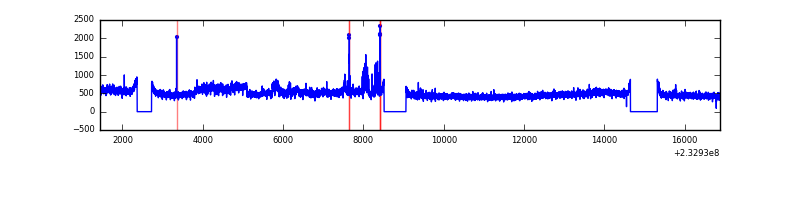 |
| D | 15440 | 13868 | 100 | 100 | 0.65% | 0.72% | 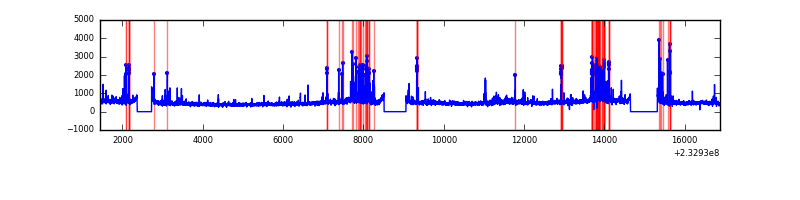 |
Top three noisy pixels from each quadrant. If the there are fewer than three noisy pixels in the level2.evt file, extra rows are filled as -1
| Pixel properties | Quadrant properties | ||||||
|---|---|---|---|---|---|---|---|
| Quadrant | DetID | PixID | Counts | Sigma | Mean | Median | Sigma |
| A | 8 | 5 | 2410018 | 7292.38 | 1615 | 1579 | 330.3 |
| A | 15 | 174 | 323166 | 973.72 | 1615 | 1579 | 330.3 |
| A | 5 | 16 | 84201 | 250.17 | 1615 | 1579 | 330.3 |
| B | 10 | 16 | 132898 | 416.35 | 1635 | 1594 | 315.4 |
| B | 6 | 51 | 40947 | 124.78 | 1635 | 1594 | 315.4 |
| B | 12 | 111 | 35922 | 108.85 | 1635 | 1594 | 315.4 |
| C | 9 | 68 | 704151 | 1904.83 | 1588 | 1592 | 368.8 |
| C | 8 | 128 | 15746 | 38.38 | 1588 | 1592 | 368.8 |
| C | 10 | 22 | 13241 | 31.58 | 1588 | 1592 | 368.8 |
| D | 8 | 195 | 612465 | 1602.8 | 1573 | 1533 | 381.2 |
| D | 7 | 71 | 290044 | 756.92 | 1573 | 1533 | 381.2 |
| D | 1 | 52 | 203561 | 530.03 | 1573 | 1533 | 381.2 |
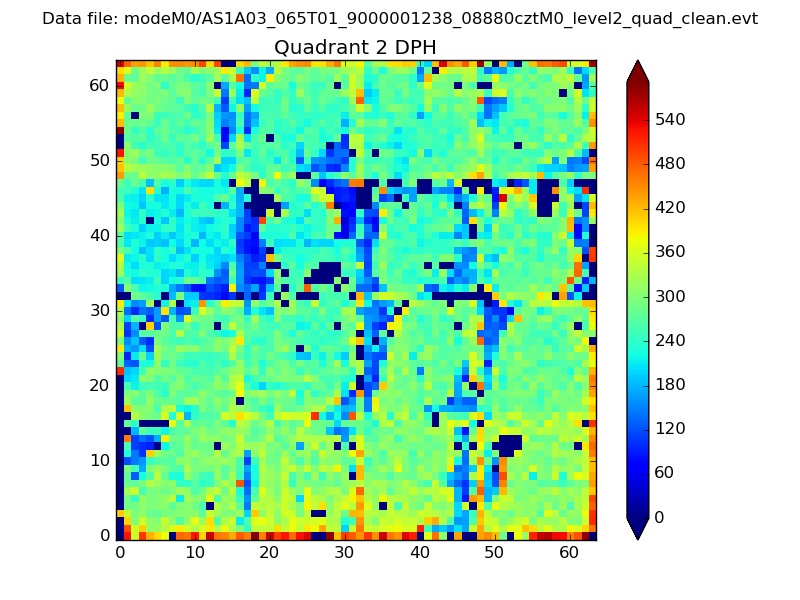
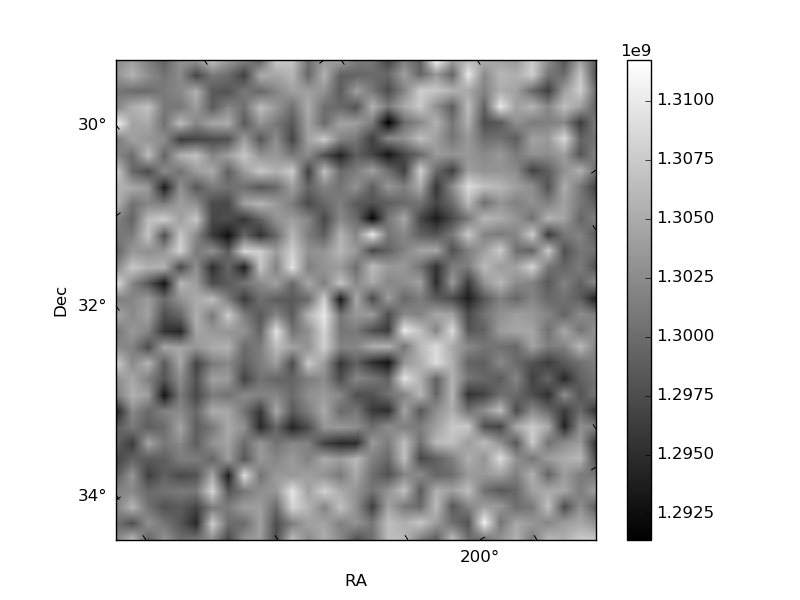
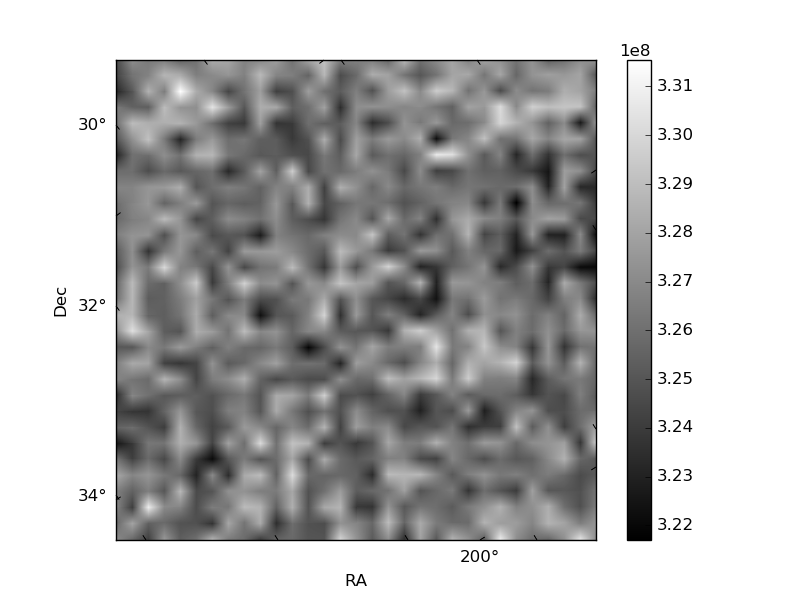
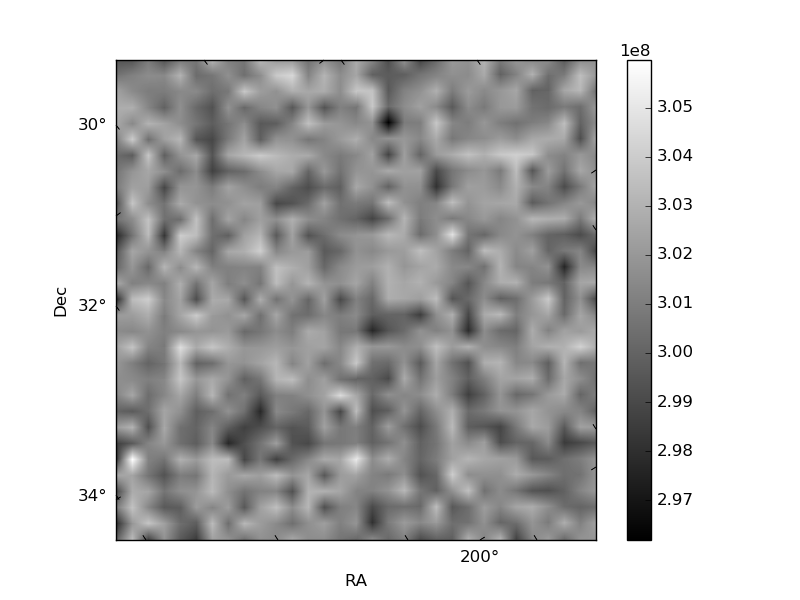
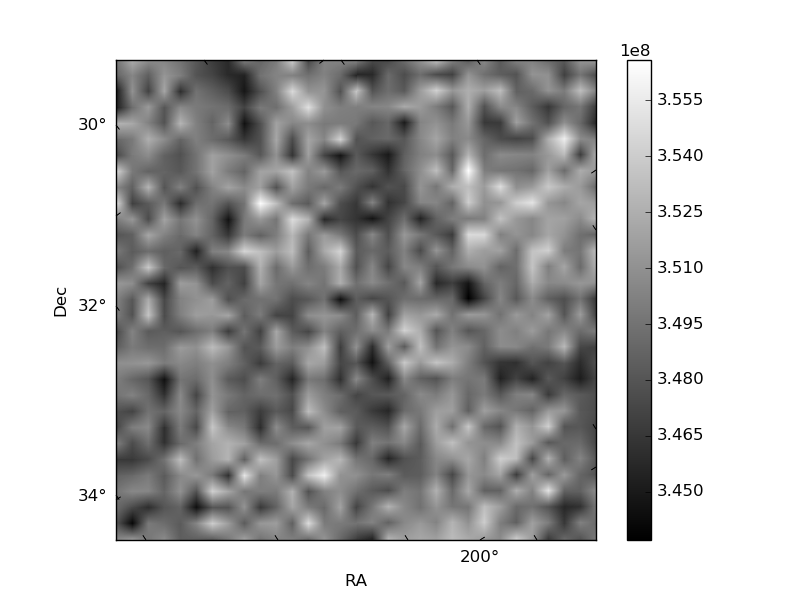
Histogram calculated using DETX and DETY for each event in the final _common_clean file
| Quadrant A | 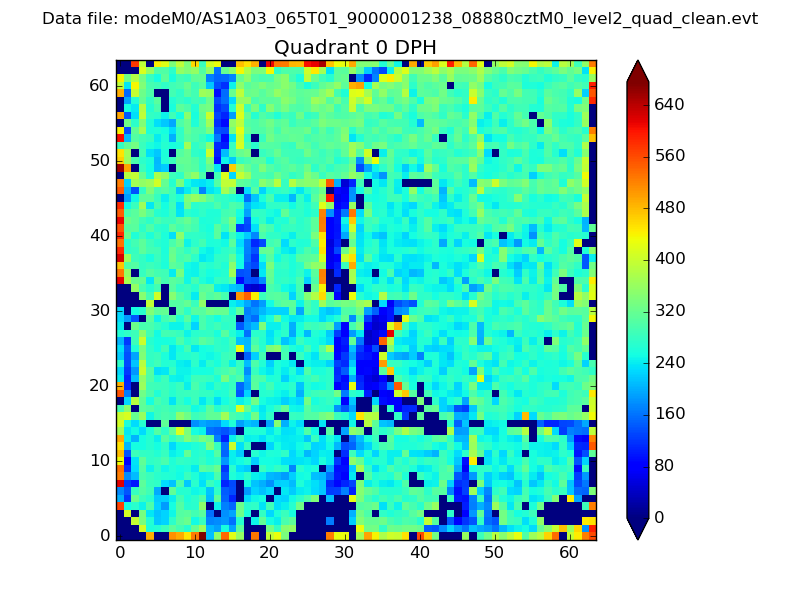 |
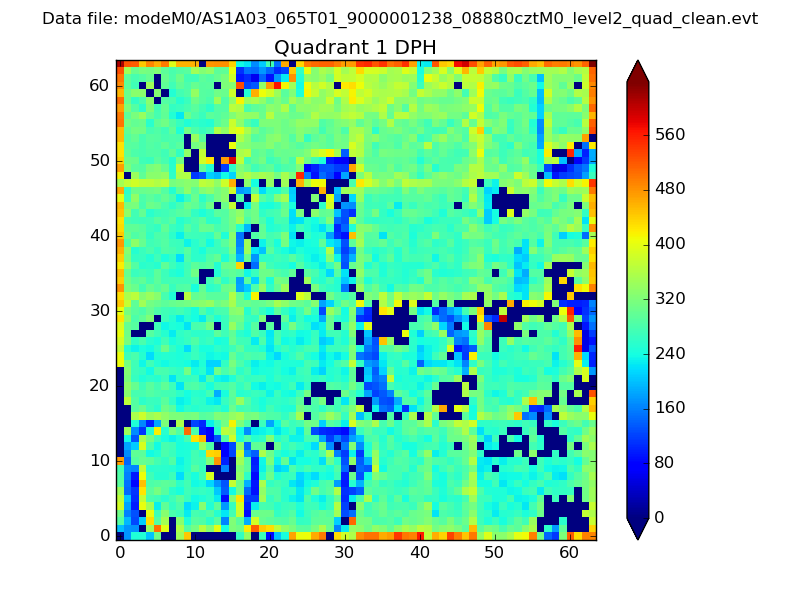 |
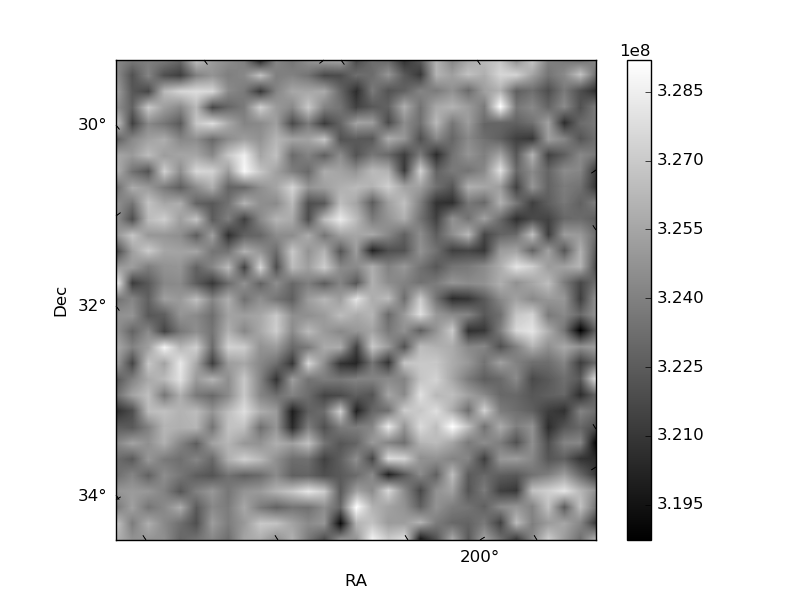
Quadrant B |
|---|---|---|---|
| Quadrant D | 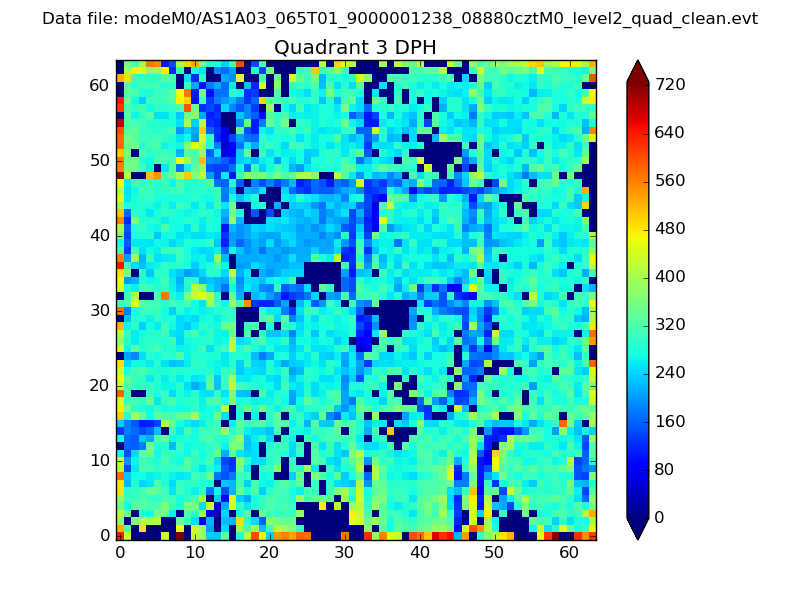 |
 |
Quadrant C |
| Plot type | Count rate plots | Images |
|---|---|---|
| Comparison with Poisson distribution Blue bars denote a histogram of data divided into 1 sec bins. Red curve is a Poisson curve with rate = median count rate of data. |
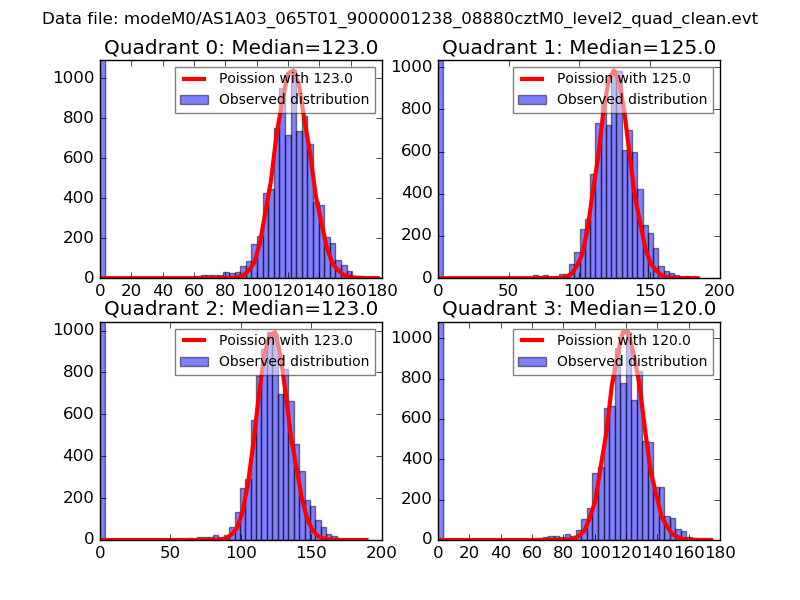 |
 |
| Quadrant-wise count rates Data is divided into 100 sec bins |
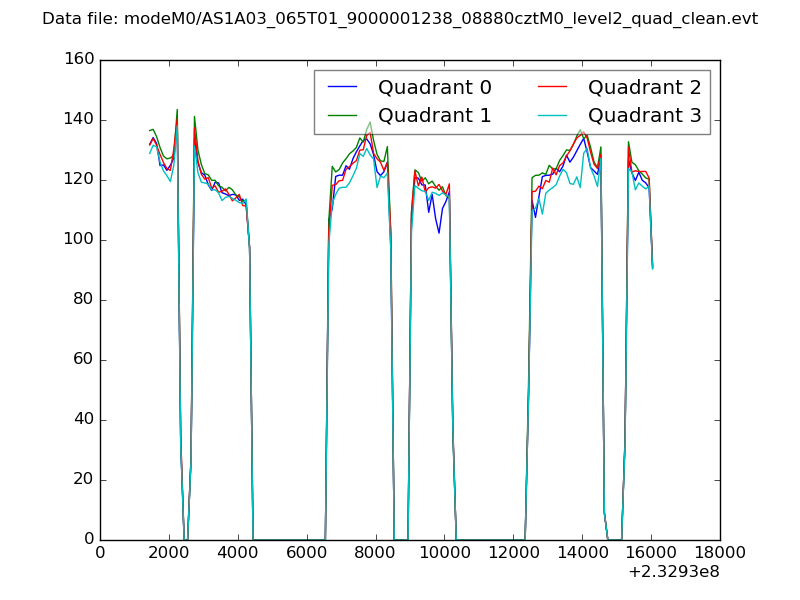 |
|
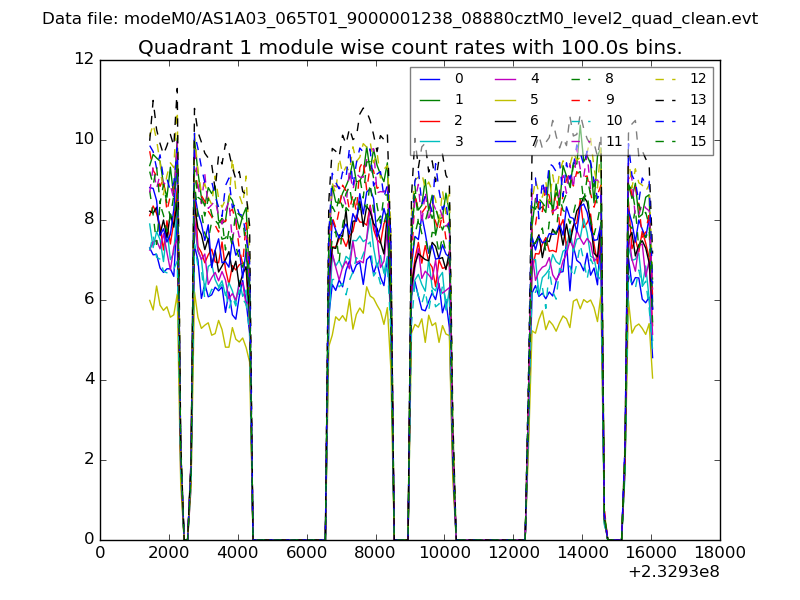
| Module-wise count rates for Quadrant A Data is divided into 100 sec bins |
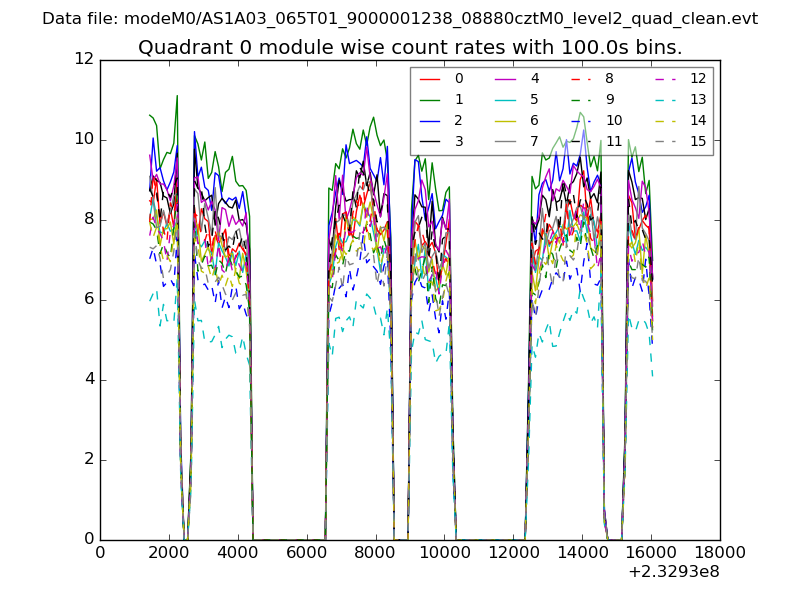 |
 |
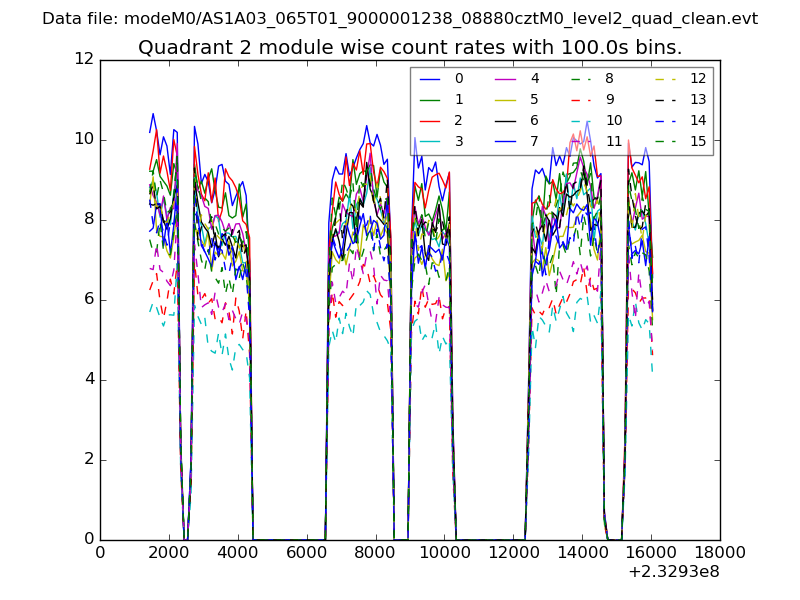
| Module-wise count rates for Quadrant B Data is divided into 100 sec bins |
 |
 |
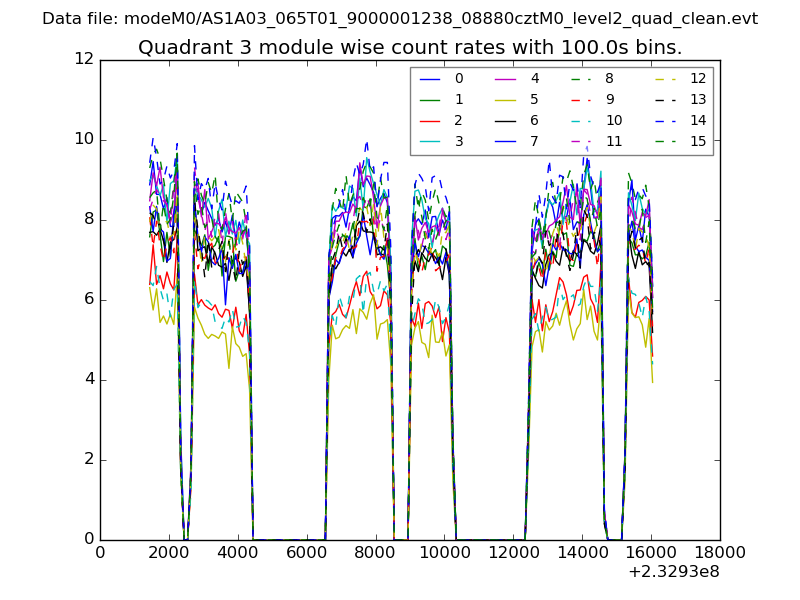
| Module-wise count rates for Quadrant C Data is divided into 100 sec bins |
 |
 |
| Module-wise count rates for Quadrant D Data is divided into 100 sec bins |
 |
 |
| Parameter | Plot |
|---|---|
| CZT HV Monitor | 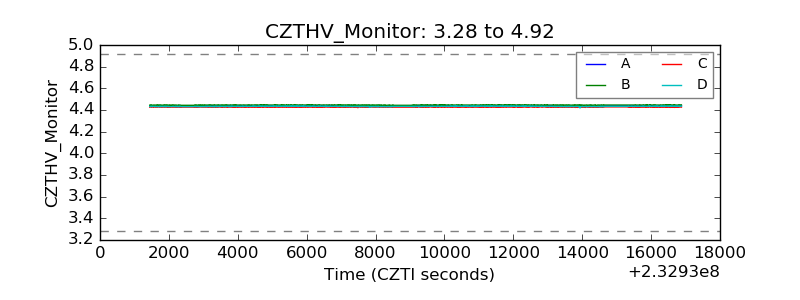 |
| D_VDD | 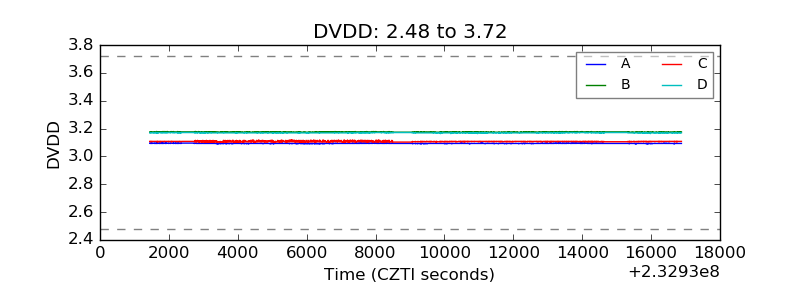 |
| Temperature 1 | 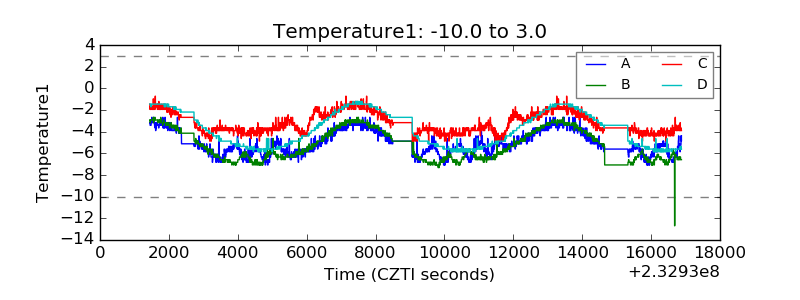 |
| Veto HV Monitor |  |
| Veto LLD | 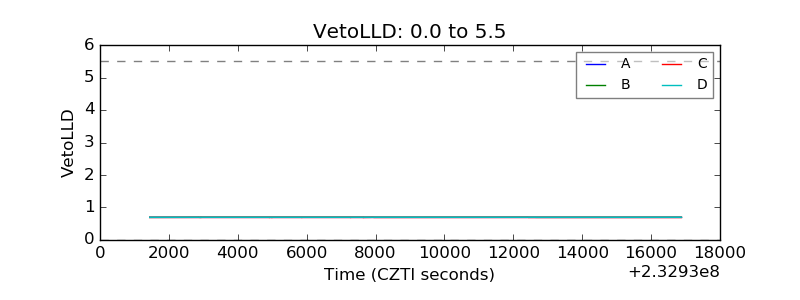 |
| Alpha Counter | 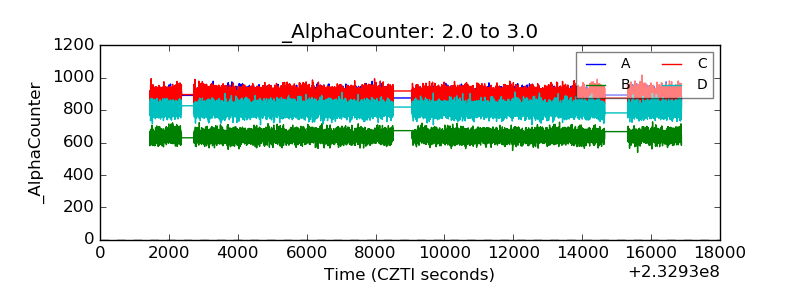 |
| _CPM_Rate | 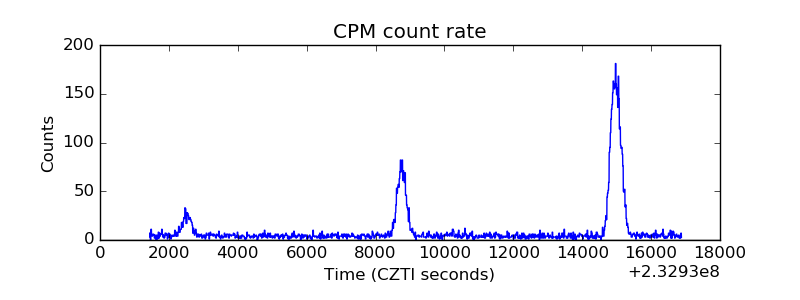 |
| CZT Counter | 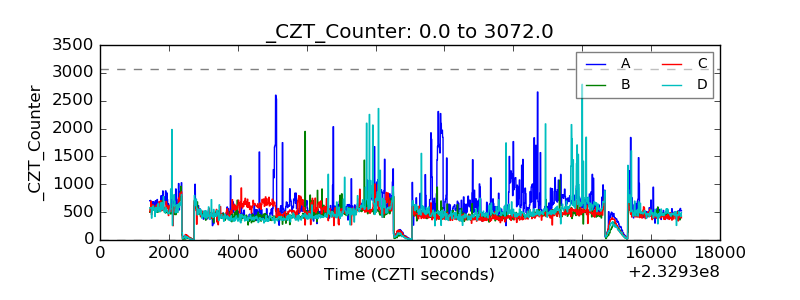 |
| +2.5 Volts monitor |  |
| +5 Volts monitor | 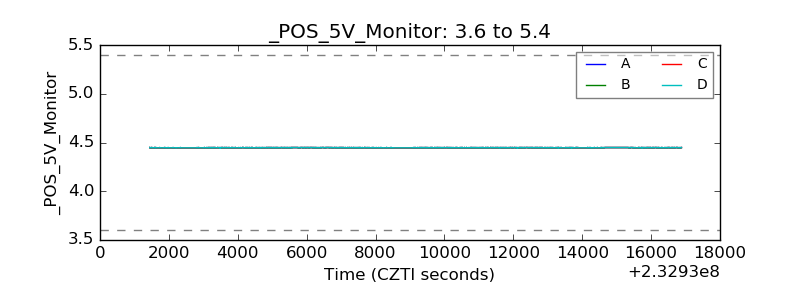 |
| _ROLL_ROT |  |
| _Roll_DEC | 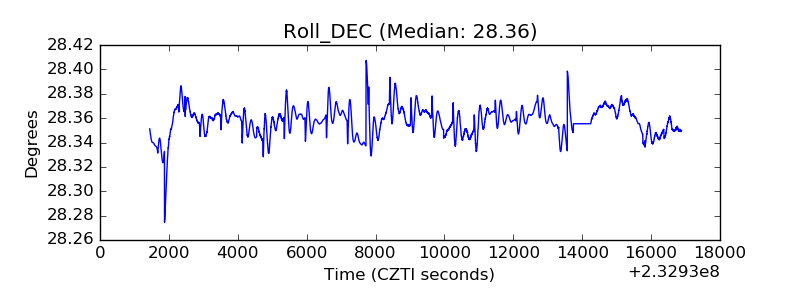 |
| _Roll_RA | 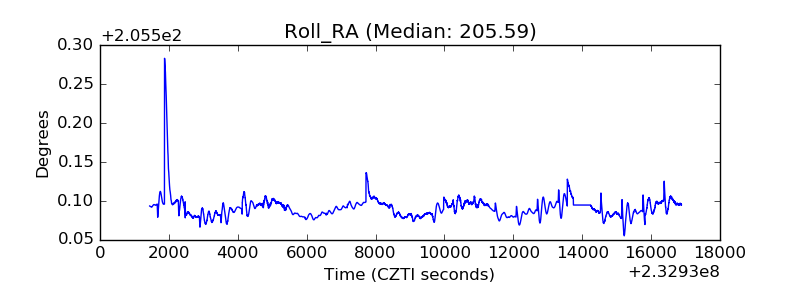 |
| Veto Counter | 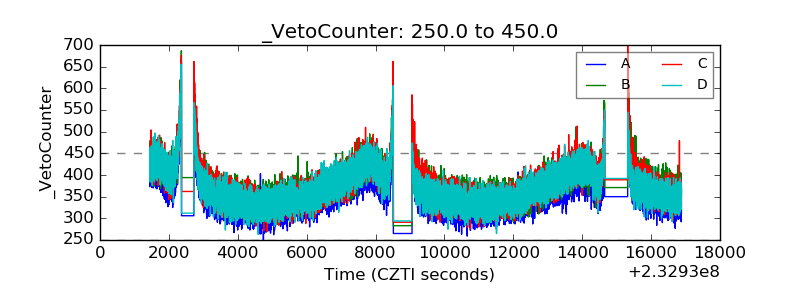 |