| Param | Original file | Final file |
|---|---|---|
| Filename | modeM0/AS1A03_065T01_9000001238_08882cztM0_level2.evt | modeM0/AS1A03_065T01_9000001238_08882cztM0_level2_quad_clean.evt |
| Size (bytes) | 497,053,440 | 66,032,640 |
| Size | 474.0 MB | 63.0 MB |
| Events in quadrant A | 3,918,800 | 383,449 |
| Events in quadrant B | 3,140,325 | 396,642 |
| Events in quadrant C | 3,109,742 | 384,404 |
| Events in quadrant D | 4,437,711 | 375,659 |
| Mode SS | |||
|---|---|---|---|
| Quadrant | BADHDUFLAG | Total packets | Discarded packets |
| A | 0 | 132 | 0 |
| B | 0 | 132 | 0 |
| C | 0 | 132 | 0 |
| D | 0 | 132 | 0 |
| Mode M9 | |||
|---|---|---|---|
| Quadrant | BADHDUFLAG | Total packets | Discarded packets |
| A | 0 | 17 | 0 |
| B | 0 | 17 | 0 |
| C | 0 | 17 | 0 |
| D | 0 | 17 | 0 |
| Mode M0 | |||
|---|---|---|---|
| Quadrant | BADHDUFLAG | Total packets | Discarded packets |
| A | 0 | 15677 | 3 |
| B | 0 | 13542 | 2 |
| C | 0 | 13732 | 4 |
| D | 0 | 17272 | 2 |
| Quadrant | Total seconds | Saturated seconds | Saturation percentage |
|---|---|---|---|
| A | 6588 | 183 | 2.777778% |
| B | 6588 | 95 | 1.442016% |
| C | 6587 | 98 | 1.487779% |
| D | 6588 | 273 | 4.143898% |
Noise dominated data is calculated using 1-second bins in cleaned event files. If a bin has >2000 counts, and if more than 50% of those come from <1% of pixels, then it is considered to be noise-dominated and hence unusable.
| Quadrant | # 1 sec bins | Bins with >0 counts | Bins with >2000 counts | High rate bins dominated by noise | Noise dominated (total time) | Noise dominated (detector-on time) | Marked lightcurve |
|---|---|---|---|---|---|---|---|
| A | 7538 | 6588 | 71 | 71 | 0.94% | 1.08% |  |
| B | 7538 | 6588 | 1 | 1 | 0.01% | 0.02% | 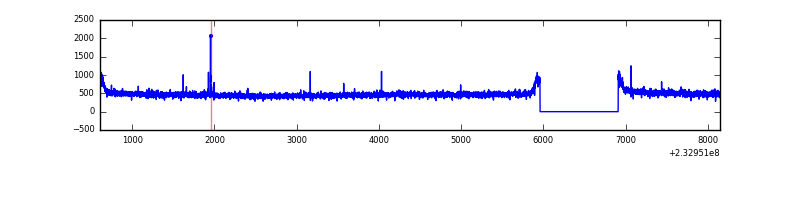 |
| C | 7538 | 6588 | 25 | 25 | 0.33% | 0.38% | 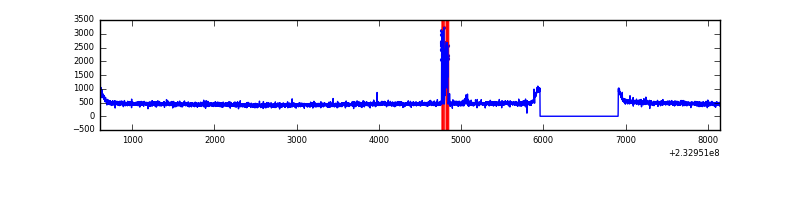 |
| D | 7538 | 6588 | 200 | 200 | 2.65% | 3.04% | 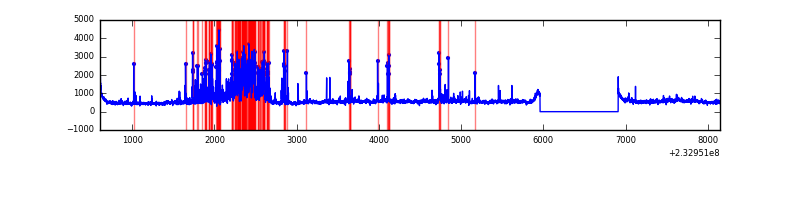 |
Top three noisy pixels from each quadrant. If the there are fewer than three noisy pixels in the level2.evt file, extra rows are filled as -1
| Pixel properties | Quadrant properties | ||||||
|---|---|---|---|---|---|---|---|
| Quadrant | DetID | PixID | Counts | Sigma | Mean | Median | Sigma |
| A | 15 | 174 | 449416 | 2736.34 | 794 | 776 | 164.0 |
| A | 8 | 5 | 383242 | 2332.74 | 794 | 776 | 164.0 |
| A | 5 | 16 | 24099 | 142.25 | 794 | 776 | 164.0 |
| B | 12 | 111 | 17490 | 107.84 | 801 | 782 | 154.9 |
| B | 0 | 198 | 14432 | 88.1 | 801 | 782 | 154.9 |
| B | 11 | 111 | 14041 | 85.58 | 801 | 782 | 154.9 |
| C | 14 | 234 | 99886 | 548.6 | 770 | 776 | 180.7 |
| C | 13 | 61 | 5990 | 28.86 | 770 | 776 | 180.7 |
| C | 9 | 68 | 5626 | 26.85 | 770 | 776 | 180.7 |
| D | 2 | 152 | 540557 | 2907.34 | 759 | 742 | 185.7 |
| D | 8 | 195 | 510930 | 2747.77 | 759 | 742 | 185.7 |
| D | 1 | 52 | 227559 | 1221.59 | 759 | 742 | 185.7 |
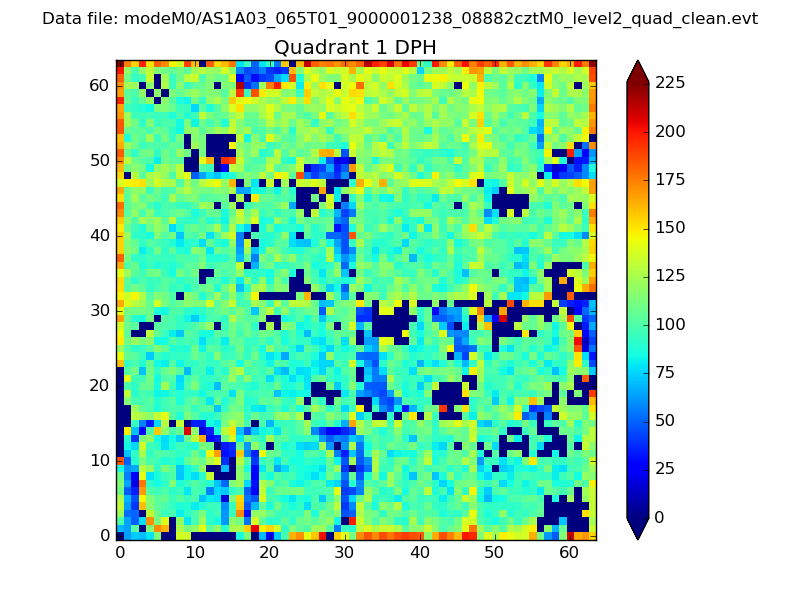
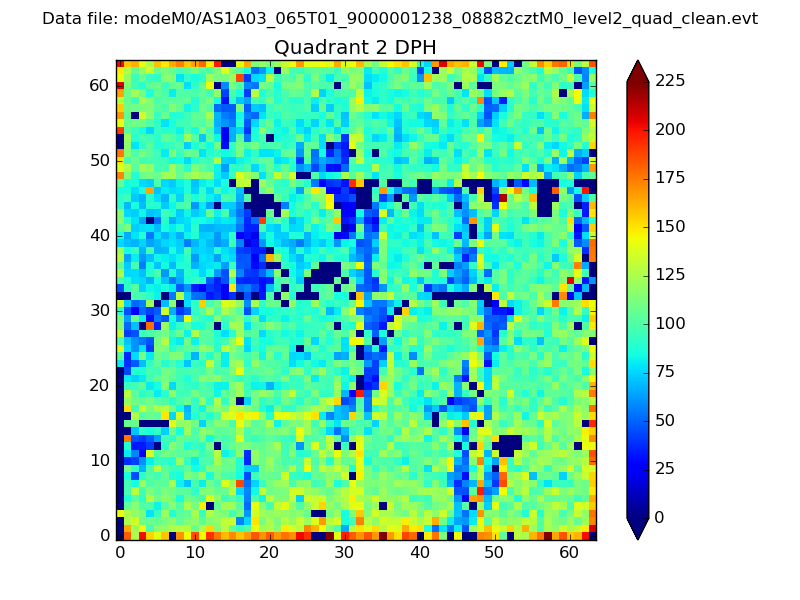
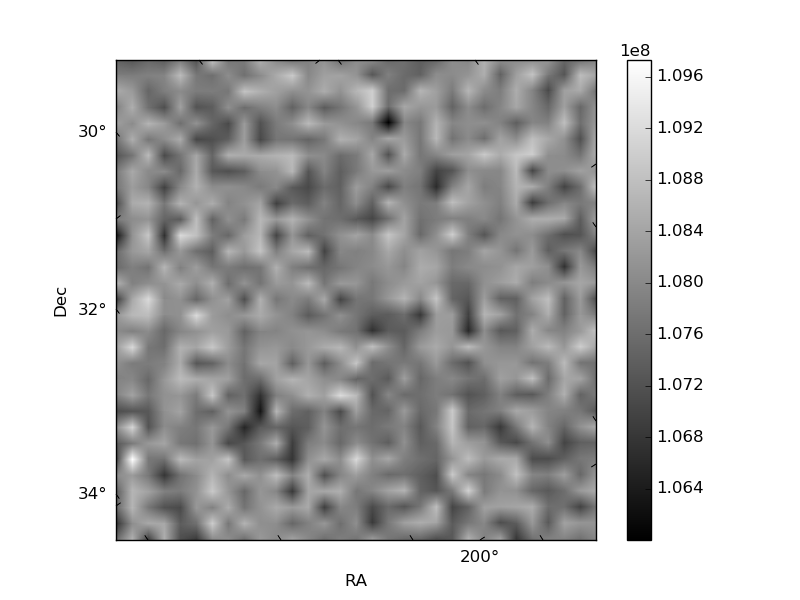
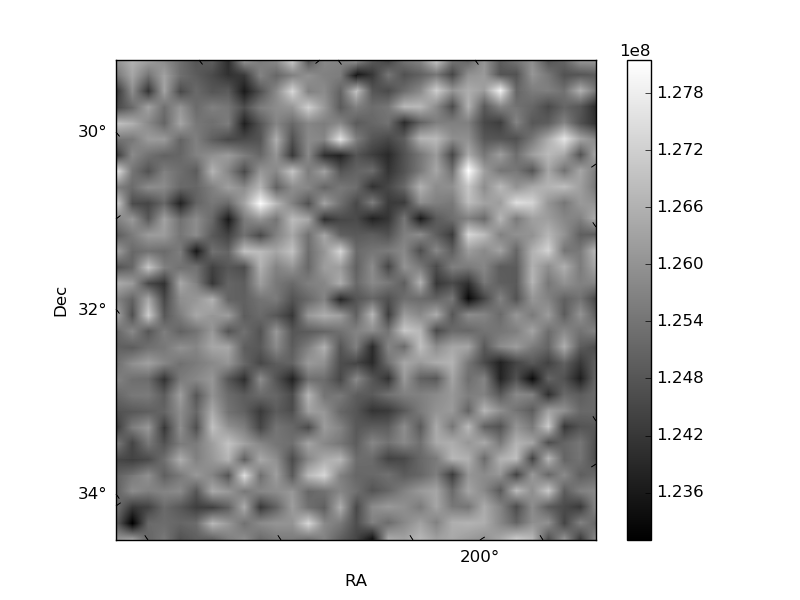
Histogram calculated using DETX and DETY for each event in the final _common_clean file
| Quadrant A | 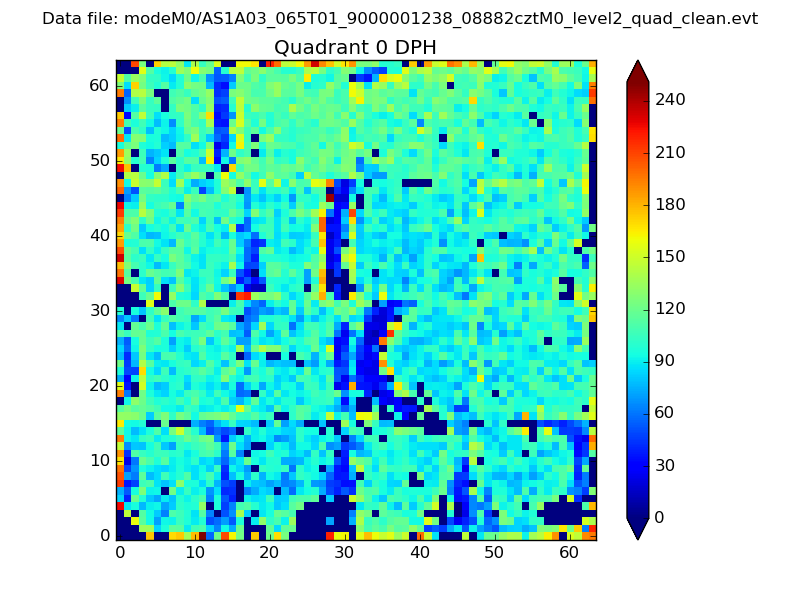 |
 |
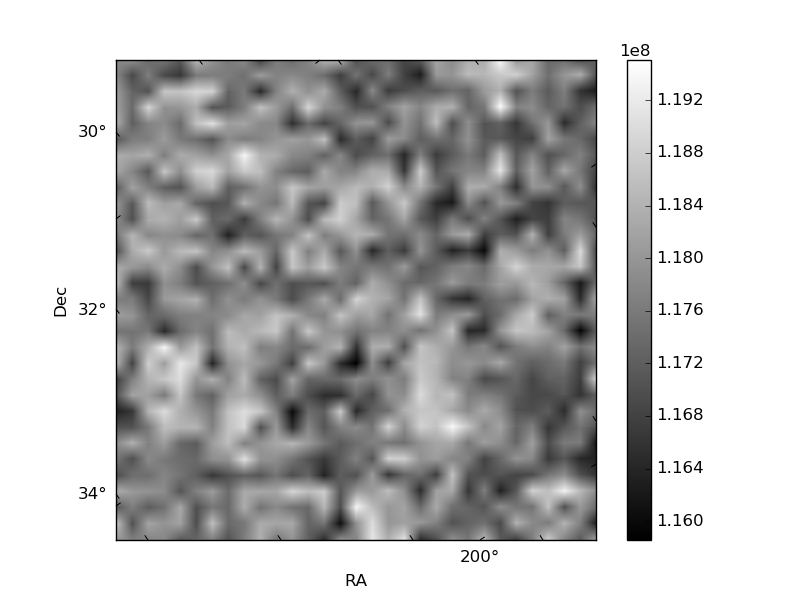
Quadrant B |
|---|---|---|---|
| Quadrant D |  |
 |
Quadrant C |
| Plot type | Count rate plots | Images |
|---|---|---|
| Comparison with Poisson distribution Blue bars denote a histogram of data divided into 1 sec bins. Red curve is a Poisson curve with rate = median count rate of data. |
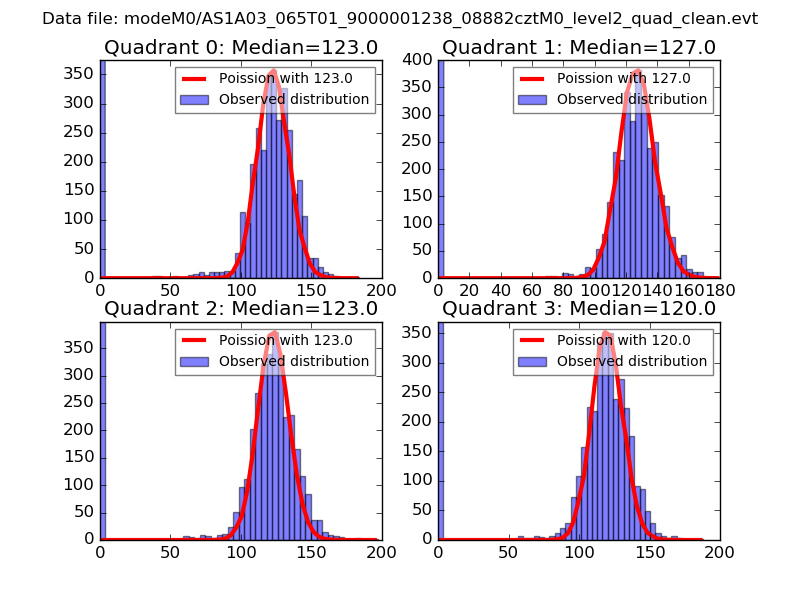 |
 |
| Quadrant-wise count rates Data is divided into 100 sec bins |
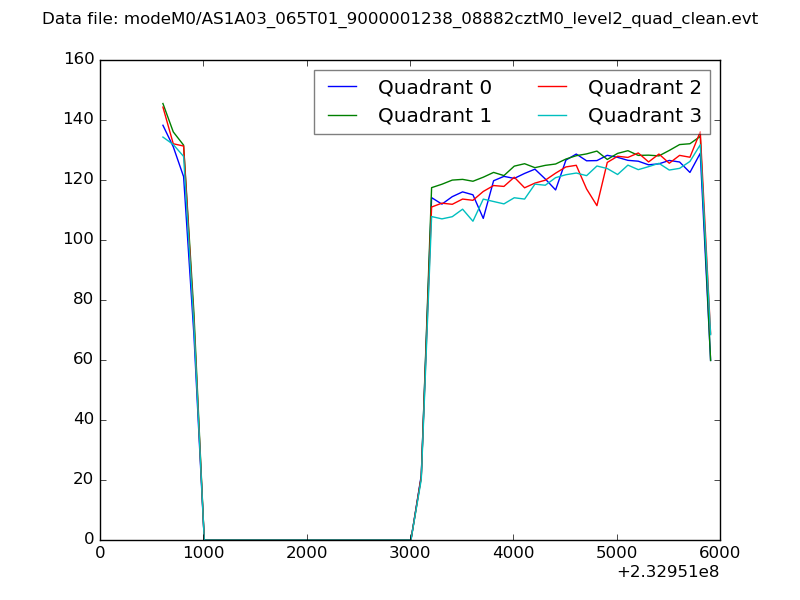 |
|
| Module-wise count rates for Quadrant A Data is divided into 100 sec bins |
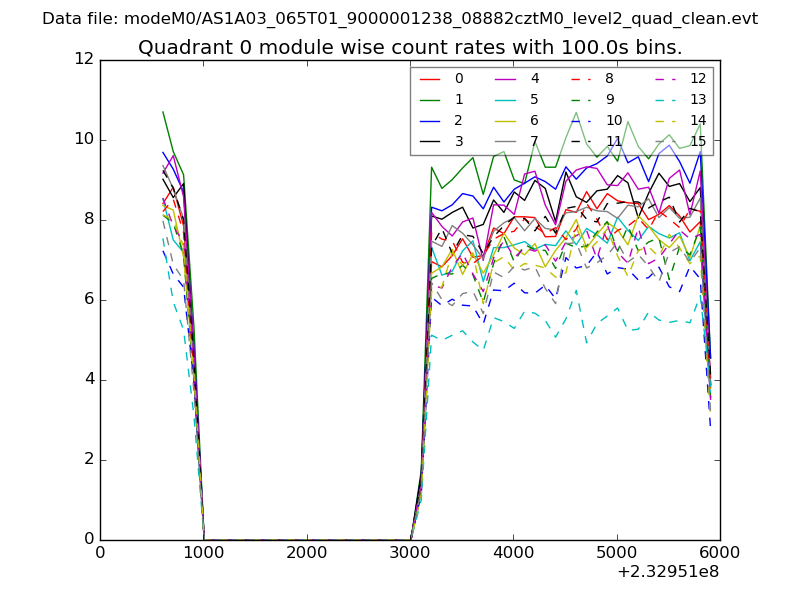 |
 |
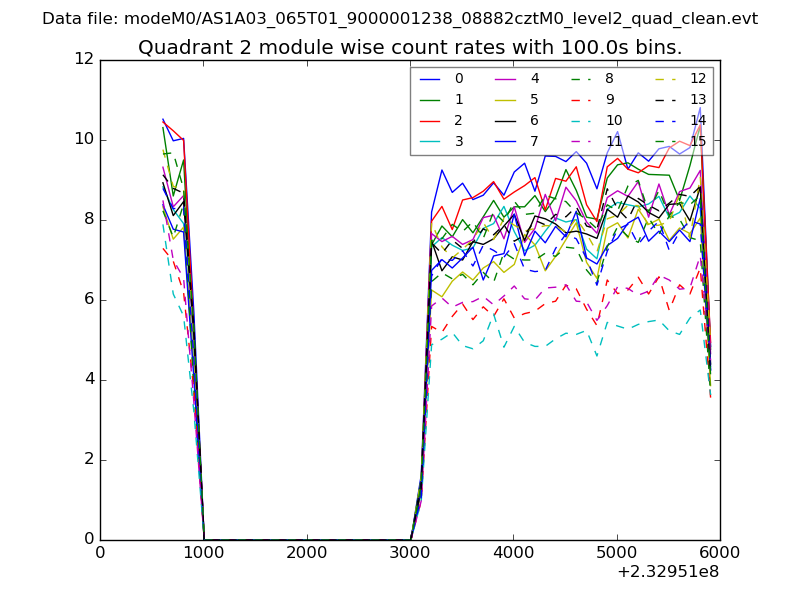
| Module-wise count rates for Quadrant B Data is divided into 100 sec bins |
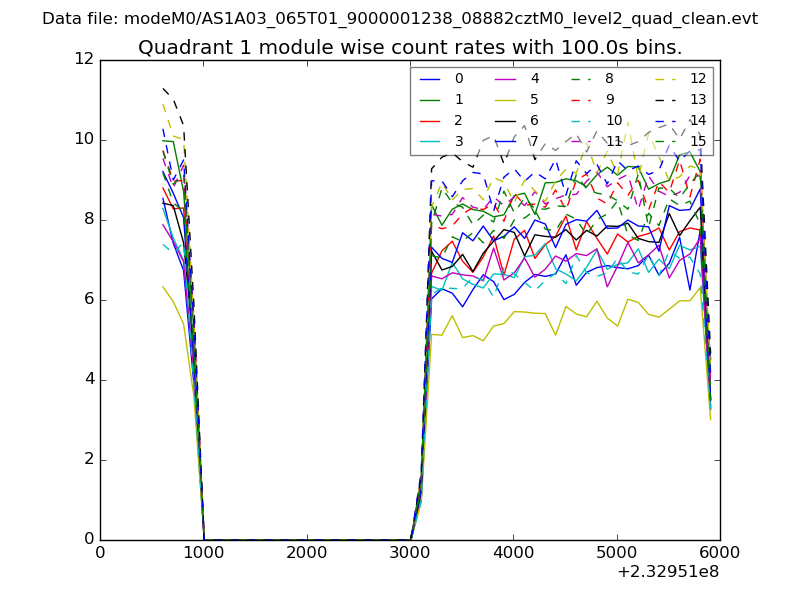 |
 |
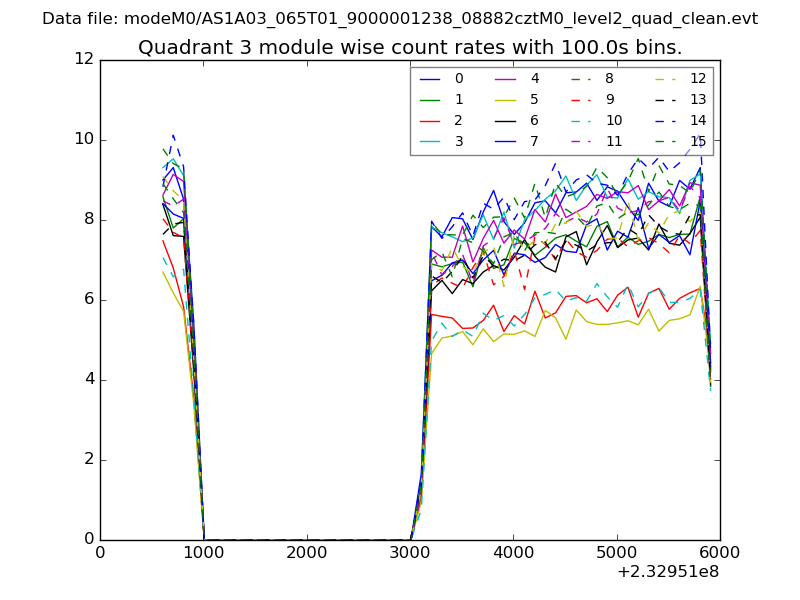
| Module-wise count rates for Quadrant C Data is divided into 100 sec bins |
 |
 |
| Module-wise count rates for Quadrant D Data is divided into 100 sec bins |
 |
 |
| Parameter | Plot |
|---|---|
| CZT HV Monitor | 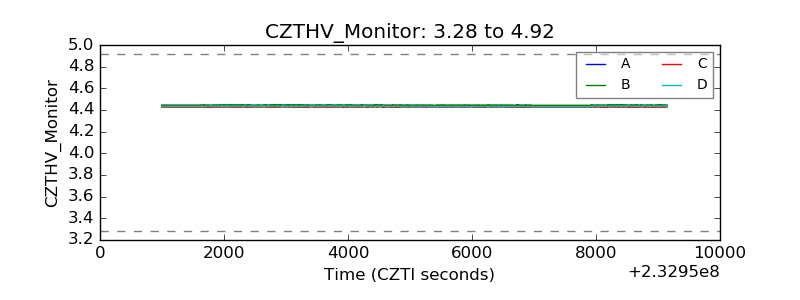 |
| D_VDD | 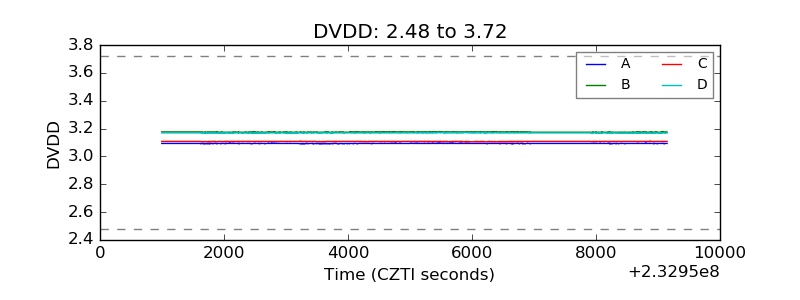 |
| Temperature 1 |  |
| Veto HV Monitor | 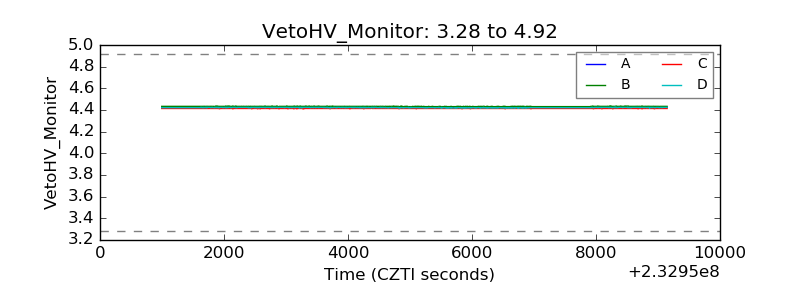 |
| Veto LLD | 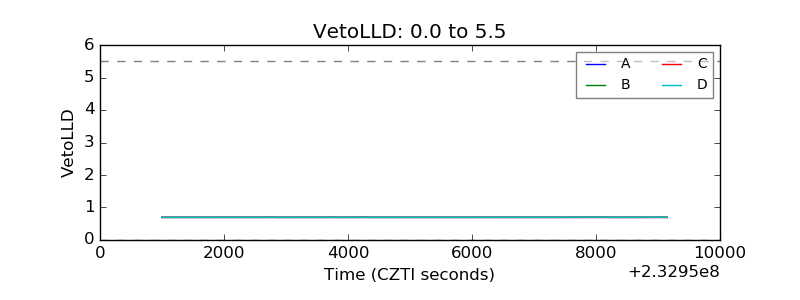 |
| Alpha Counter | 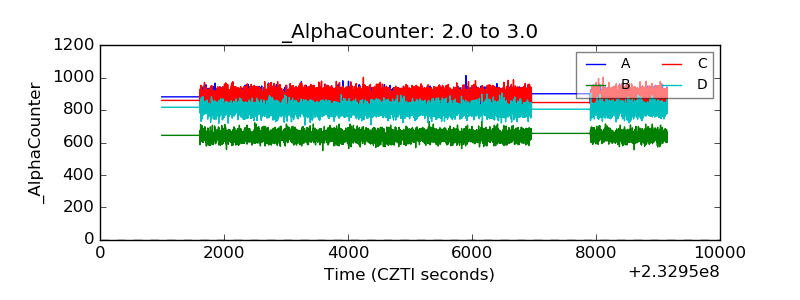 |
| _CPM_Rate | 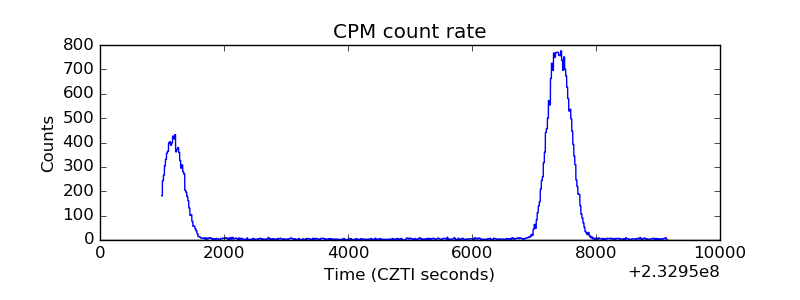 |
| CZT Counter | 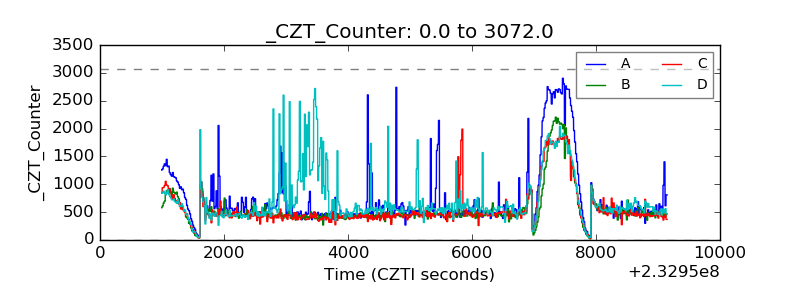 |
| +2.5 Volts monitor |  |
| +5 Volts monitor |  |
| _ROLL_ROT | 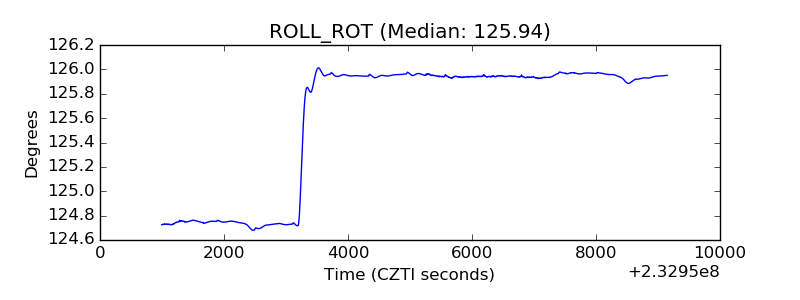 |
| _Roll_DEC | 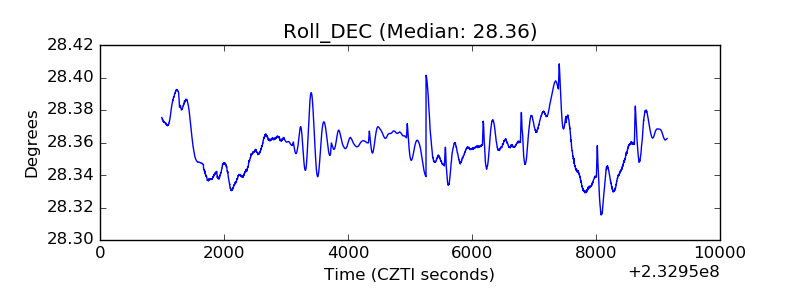 |
| _Roll_RA | 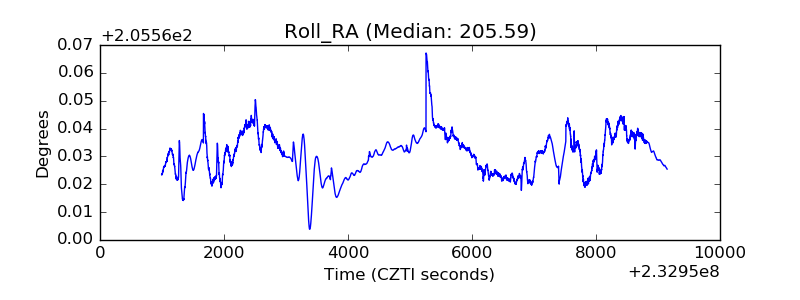 |
| Veto Counter | 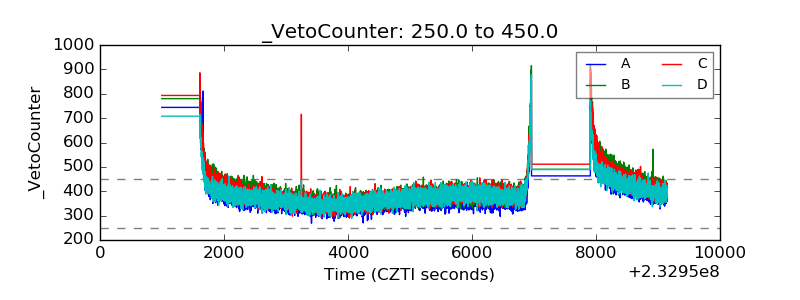 |