| Param | Original file | Final file |
|---|---|---|
| Filename | modeM0/AS1A03_065T01_9000001238_08884cztM0_level2.evt | modeM0/AS1A03_065T01_9000001238_08884cztM0_level2_quad_clean.evt |
| Size (bytes) | 525,749,760 | 78,840,000 |
| Size | 501.4 MB | 75.2 MB |
| Events in quadrant A | 4,253,692 | 471,975 |
| Events in quadrant B | 3,539,423 | 482,797 |
| Events in quadrant C | 3,454,606 | 471,551 |
| Events in quadrant D | 4,186,009 | 459,524 |
| Mode SS | |||
|---|---|---|---|
| Quadrant | BADHDUFLAG | Total packets | Discarded packets |
| A | 0 | 148 | 0 |
| B | 0 | 148 | 0 |
| C | 0 | 148 | 0 |
| D | 0 | 148 | 0 |
| Mode M9 | |||
|---|---|---|---|
| Quadrant | BADHDUFLAG | Total packets | Discarded packets |
| A | 0 | 20 | 0 |
| B | 0 | 20 | 0 |
| C | 0 | 20 | 0 |
| D | 0 | 20 | 0 |
| Mode M0 | |||
|---|---|---|---|
| Quadrant | BADHDUFLAG | Total packets | Discarded packets |
| A | 0 | 17108 | 3 |
| B | 0 | 14987 | 2 |
| C | 0 | 14964 | 2 |
| D | 0 | 16788 | 2 |
| Quadrant | Total seconds | Saturated seconds | Saturation percentage |
|---|---|---|---|
| A | 7199 | 163 | 2.264203% |
| B | 7199 | 139 | 1.930824% |
| C | 7199 | 107 | 1.486318% |
| D | 7199 | 123 | 1.708571% |
Noise dominated data is calculated using 1-second bins in cleaned event files. If a bin has >2000 counts, and if more than 50% of those come from <1% of pixels, then it is considered to be noise-dominated and hence unusable.
| Quadrant | # 1 sec bins | Bins with >0 counts | Bins with >2000 counts | High rate bins dominated by noise | Noise dominated (total time) | Noise dominated (detector-on time) | Marked lightcurve |
|---|---|---|---|---|---|---|---|
| A | 9224 | 7199 | 19 | 19 | 0.21% | 0.26% | 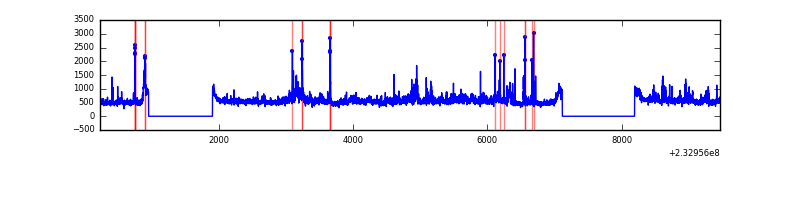 |
| B | 9224 | 7199 | 0 | 0 | 0.00% | 0.00% | 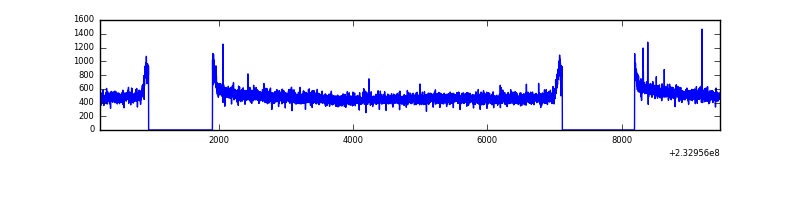 |
| C | 9224 | 7199 | 13 | 13 | 0.14% | 0.18% |  |
| D | 9224 | 7199 | 23 | 23 | 0.25% | 0.32% | 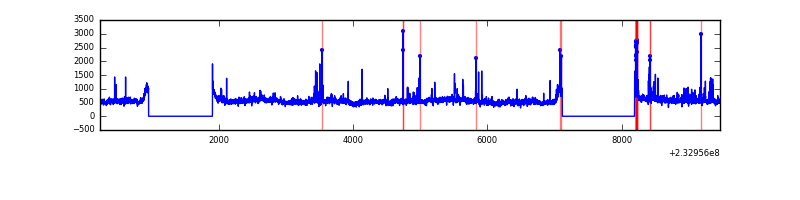 |
Top three noisy pixels from each quadrant. If the there are fewer than three noisy pixels in the level2.evt file, extra rows are filled as -1
| Pixel properties | Quadrant properties | ||||||
|---|---|---|---|---|---|---|---|
| Quadrant | DetID | PixID | Counts | Sigma | Mean | Median | Sigma |
| A | 8 | 5 | 603451 | 3279.14 | 901 | 883 | 183.8 |
| A | 15 | 174 | 140191 | 758.11 | 901 | 883 | 183.8 |
| A | 5 | 16 | 33598 | 178.03 | 901 | 883 | 183.8 |
| B | 12 | 111 | 19574 | 107.29 | 904 | 881 | 174.2 |
| B | 11 | 111 | 15661 | 84.83 | 904 | 881 | 174.2 |
| B | 4 | 173 | 12382 | 66.01 | 904 | 881 | 174.2 |
| C | 10 | 22 | 42408 | 203.92 | 871 | 876 | 203.7 |
| C | 13 | 61 | 6616 | 28.18 | 871 | 876 | 203.7 |
| C | 8 | 128 | 5513 | 22.77 | 871 | 876 | 203.7 |
| D | 8 | 195 | 601474 | 2815.75 | 866 | 844 | 213.3 |
| D | 2 | 152 | 68708 | 318.14 | 866 | 844 | 213.3 |
| D | 2 | 14 | 58119 | 268.5 | 866 | 844 | 213.3 |
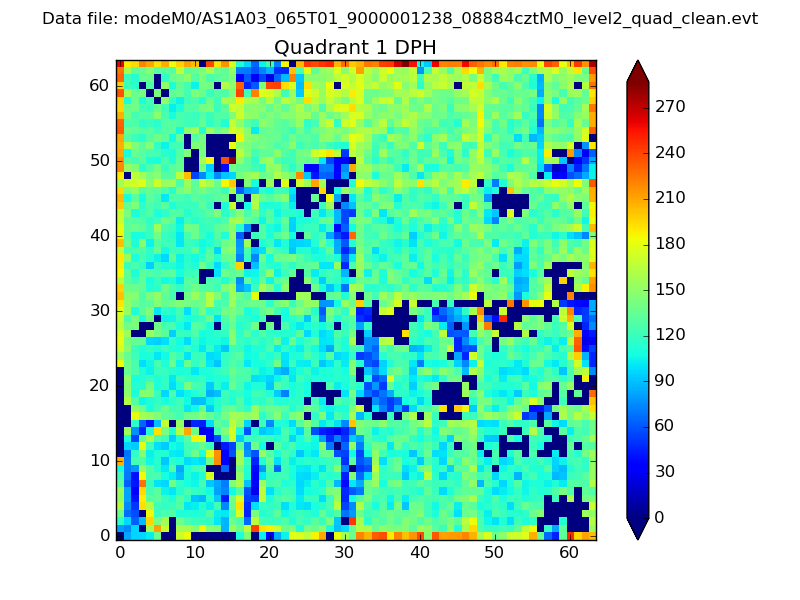
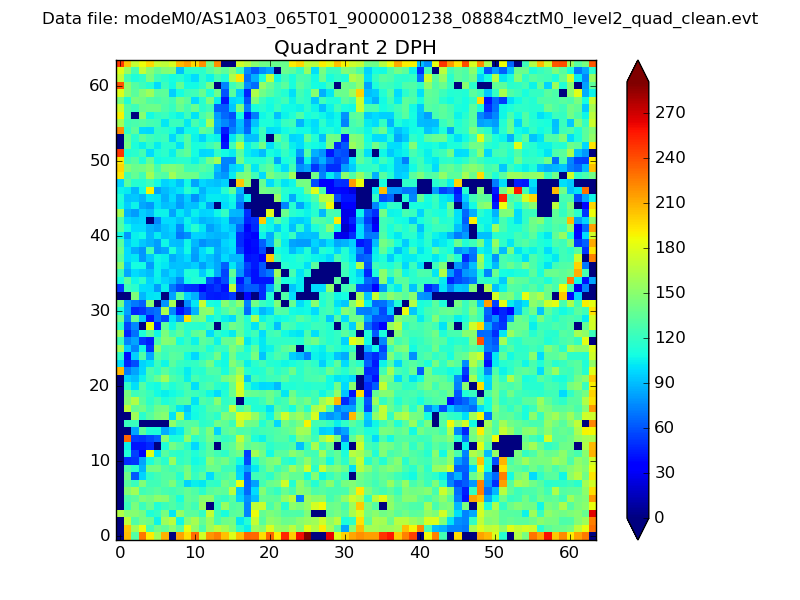
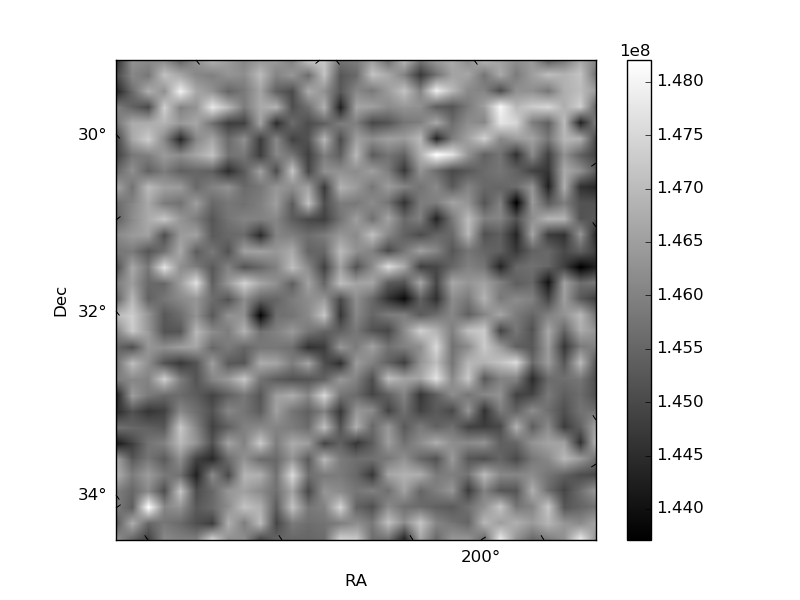
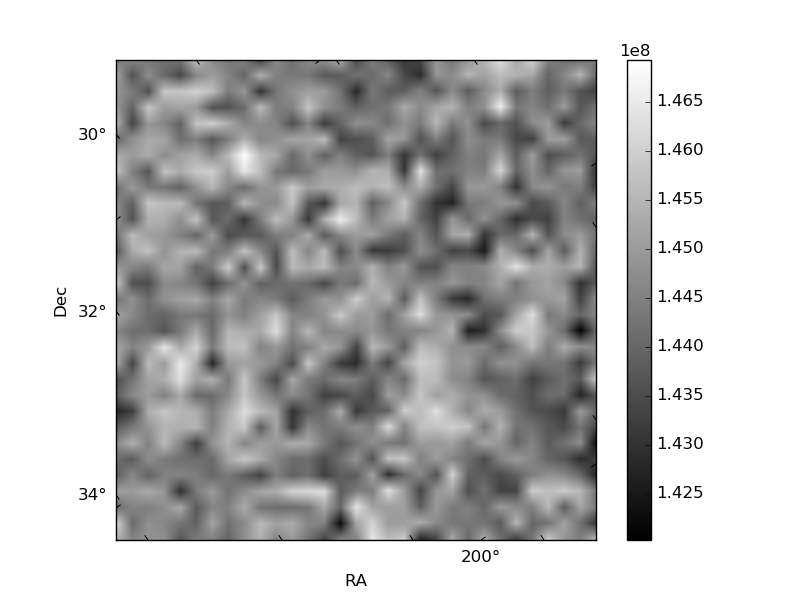
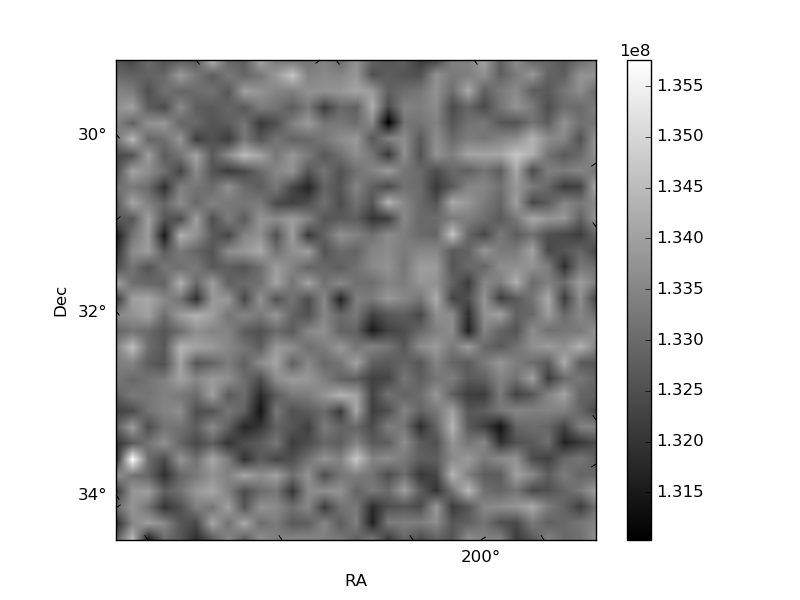
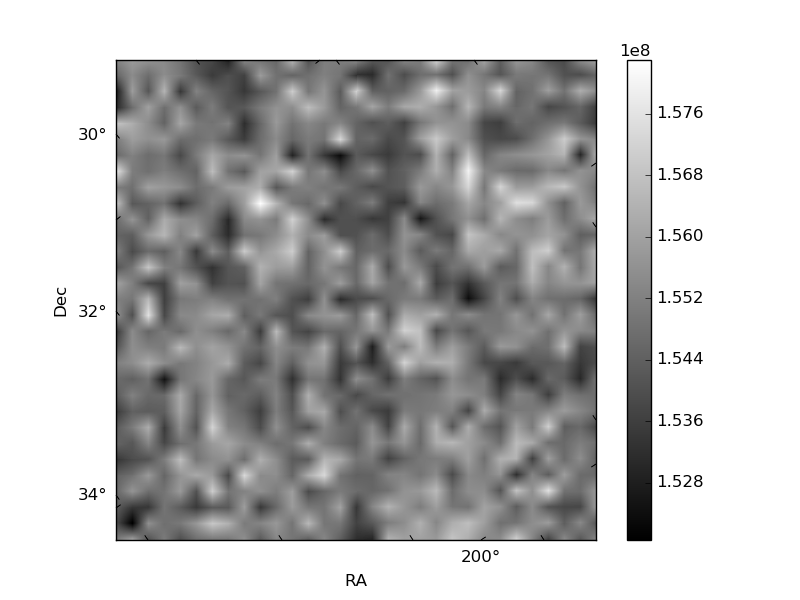
Histogram calculated using DETX and DETY for each event in the final _common_clean file
| Quadrant A | 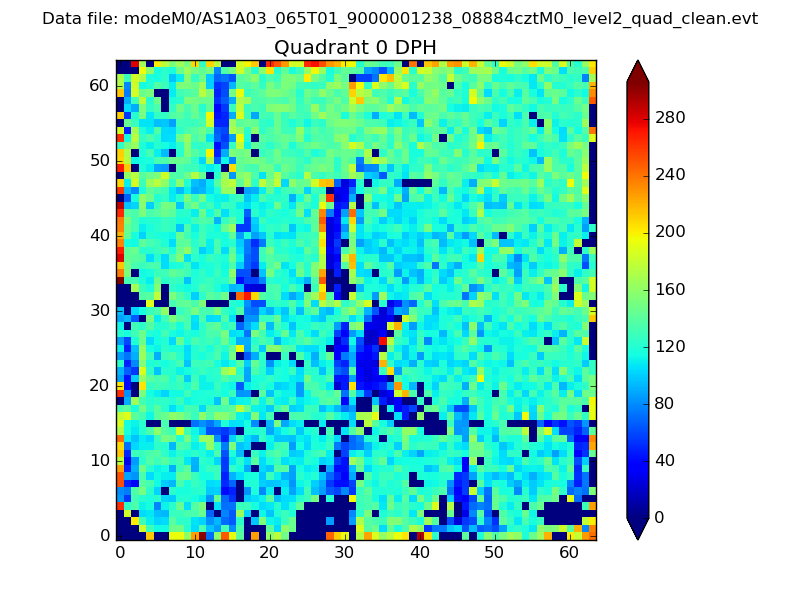 |
 |
Quadrant B |
|---|---|---|---|
| Quadrant D | 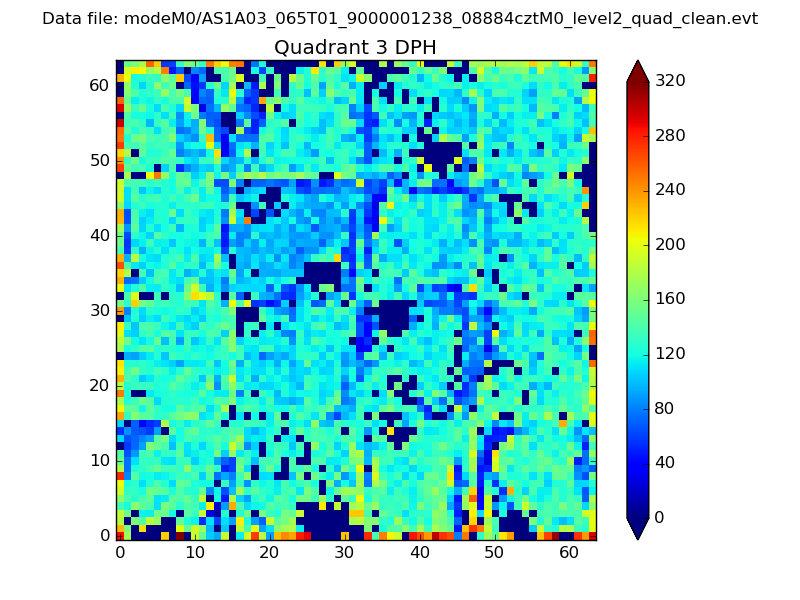 |
 |
Quadrant C |
| Plot type | Count rate plots | Images |
|---|---|---|
| Comparison with Poisson distribution Blue bars denote a histogram of data divided into 1 sec bins. Red curve is a Poisson curve with rate = median count rate of data. |
 |
 |
| Quadrant-wise count rates Data is divided into 100 sec bins |
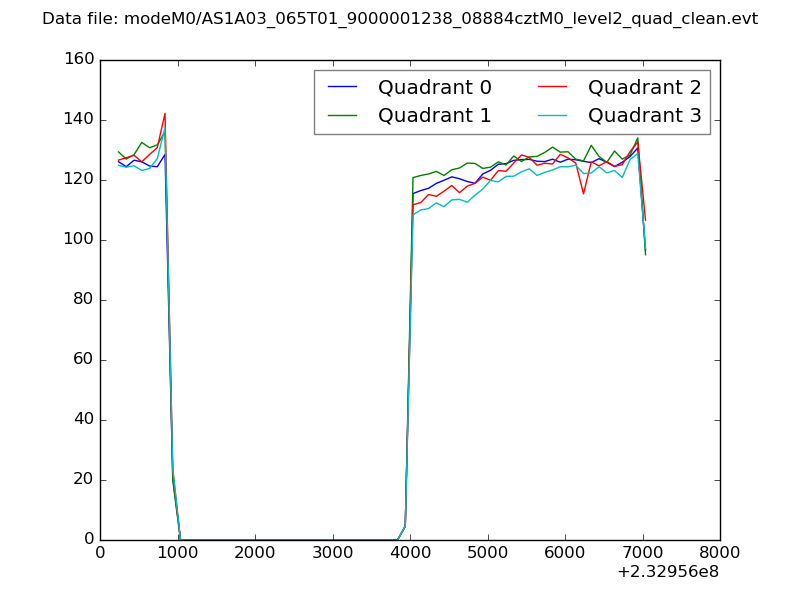 |
|
| Module-wise count rates for Quadrant A Data is divided into 100 sec bins |
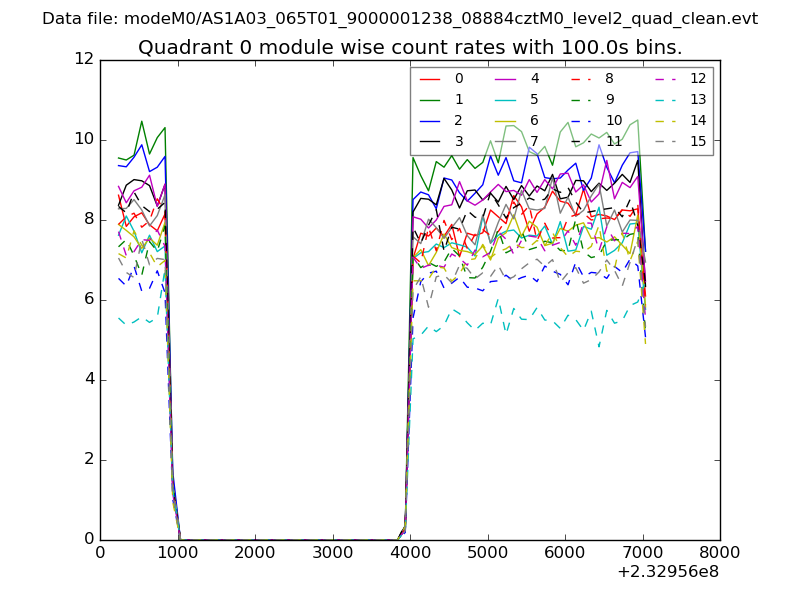 |
 |
| Module-wise count rates for Quadrant B Data is divided into 100 sec bins |
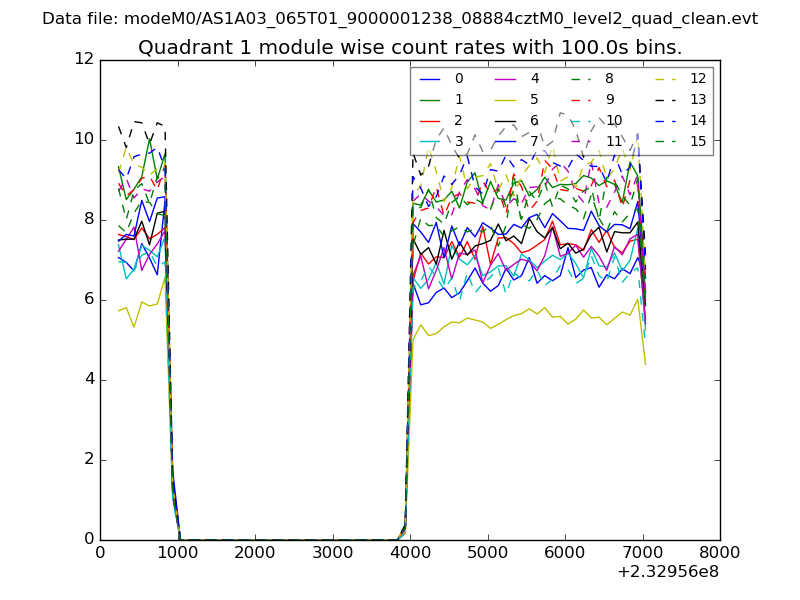 |
 |
| Module-wise count rates for Quadrant C Data is divided into 100 sec bins |
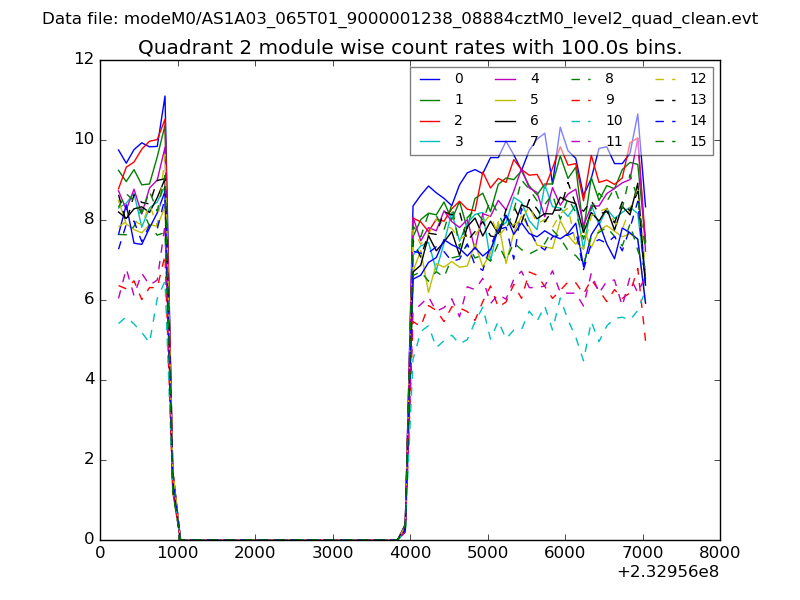 |
 |
| Module-wise count rates for Quadrant D Data is divided into 100 sec bins |
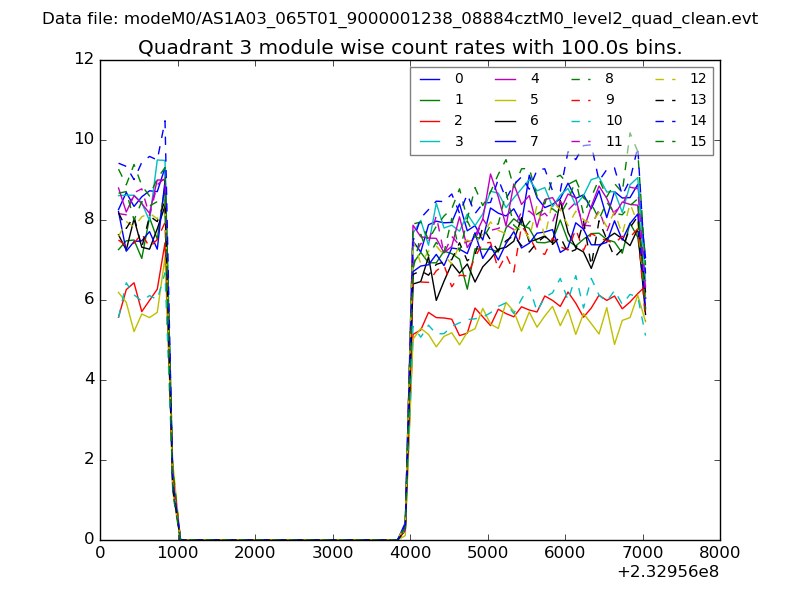 |
 |
| Parameter | Plot |
|---|---|
| CZT HV Monitor | 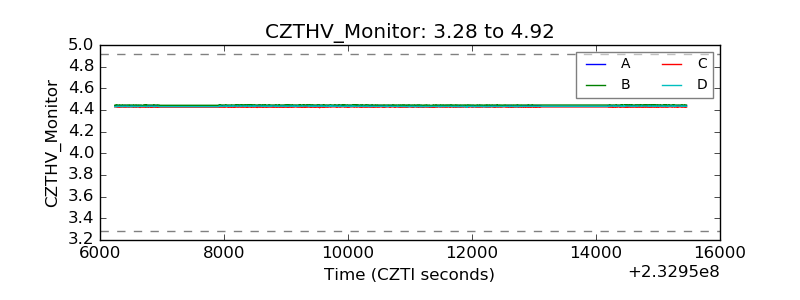 |
| D_VDD | 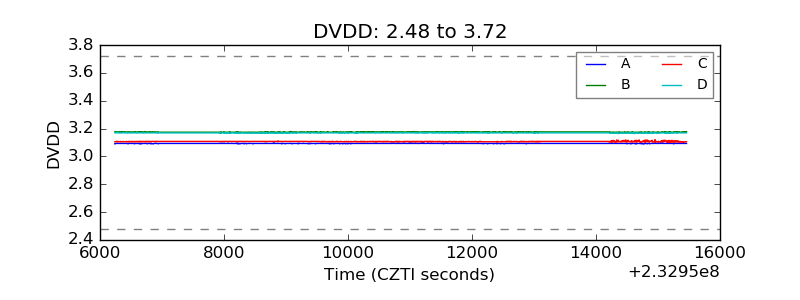 |
| Temperature 1 | 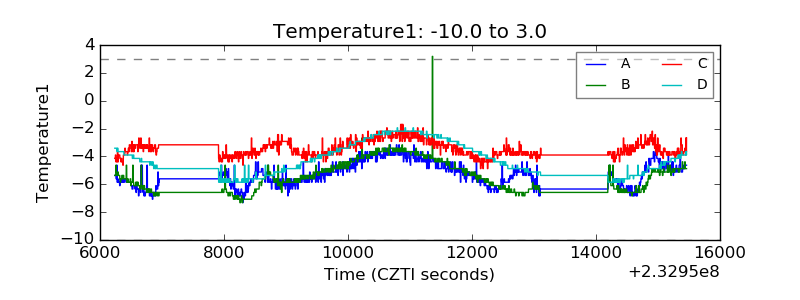 |
| Veto HV Monitor | 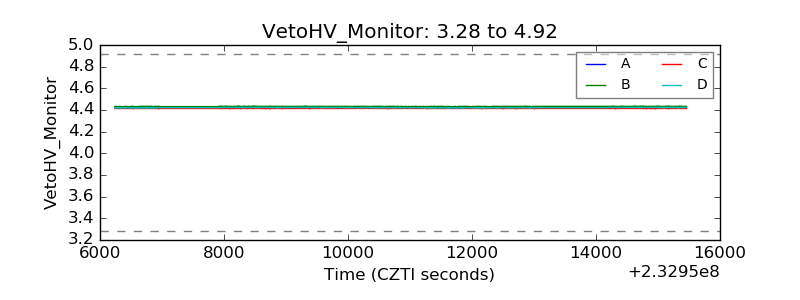 |
| Veto LLD | 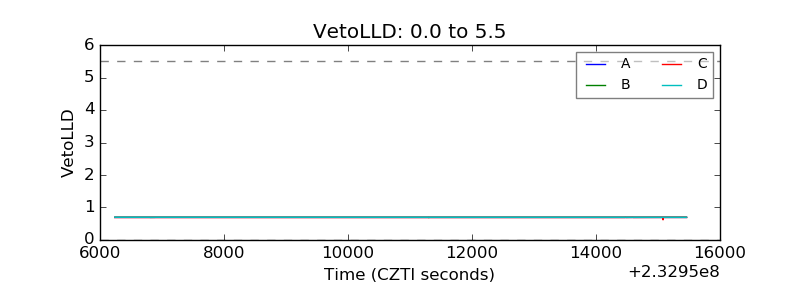 |
| Alpha Counter | 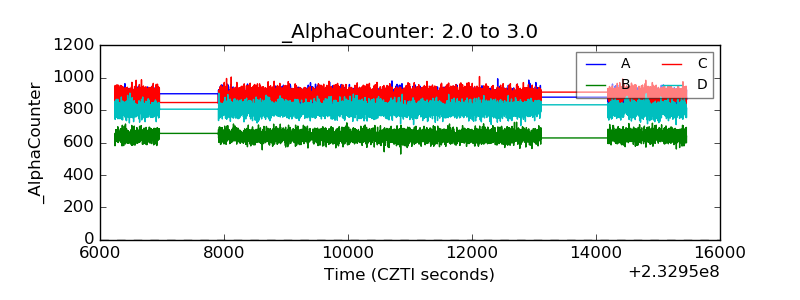 |
| _CPM_Rate | 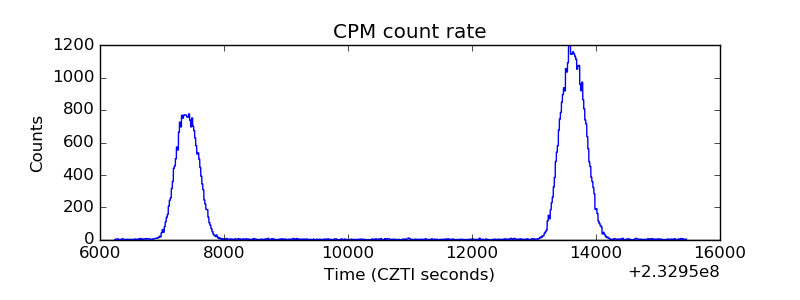 |
| CZT Counter | 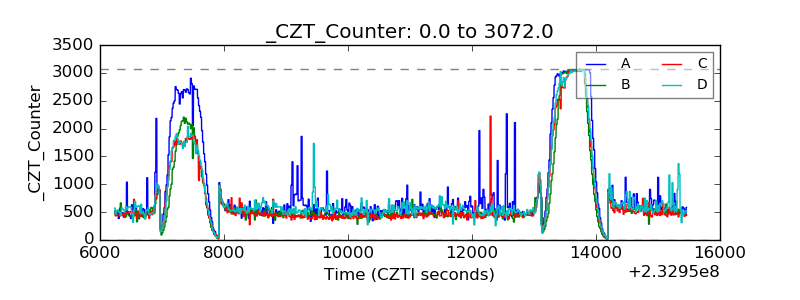 |
| +2.5 Volts monitor | 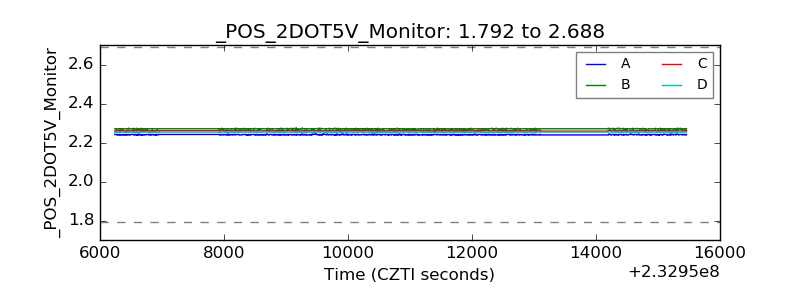 |
| +5 Volts monitor |  |
| _ROLL_ROT | 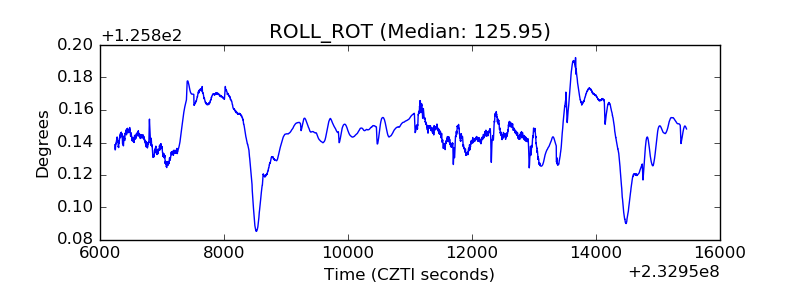 |
| _Roll_DEC | 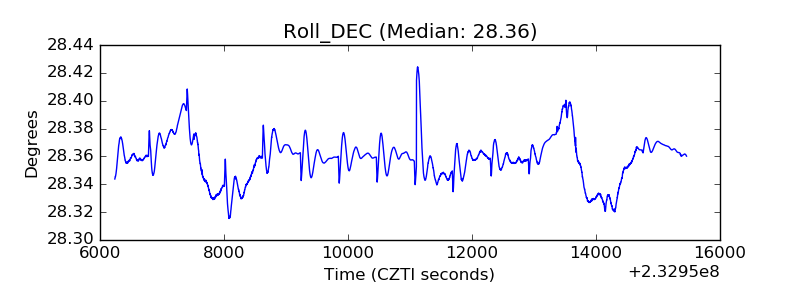 |
| _Roll_RA | 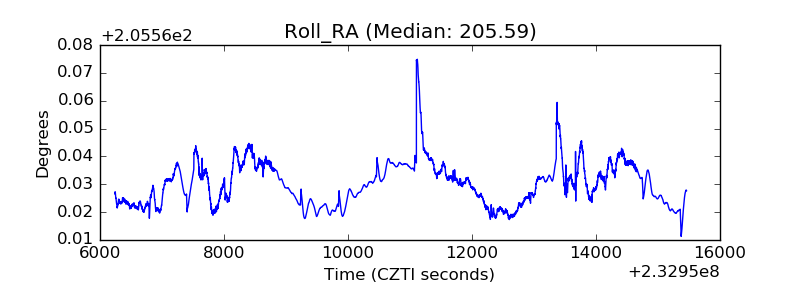 |
| Veto Counter | 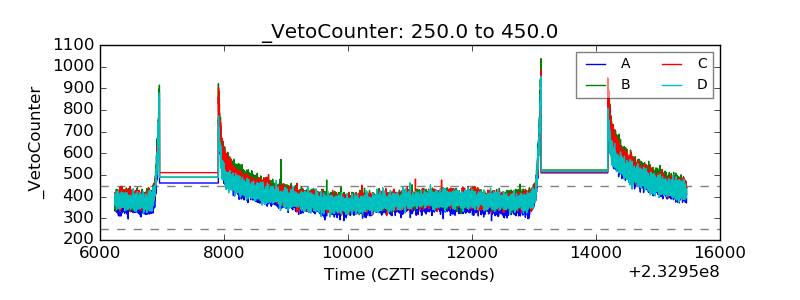 |