| Param | Original file | Final file |
|---|---|---|
| Filename | modeM0/AS1A03_065T01_9000001238_08886cztM0_level2.evt | modeM0/AS1A03_065T01_9000001238_08886cztM0_level2_quad_clean.evt |
| Size (bytes) | 218,632,320 | 37,560,960 |
| Size | 208.5 MB | 35.8 MB |
| Events in quadrant A | 1,646,455 | 235,408 |
| Events in quadrant B | 1,523,660 | 237,882 |
| Events in quadrant C | 1,458,751 | 229,529 |
| Events in quadrant D | 1,787,206 | 220,814 |
| Mode SS | |||
|---|---|---|---|
| Quadrant | BADHDUFLAG | Total packets | Discarded packets |
| A | 0 | 62 | 0 |
| B | 0 | 62 | 0 |
| C | 0 | 62 | 0 |
| D | 0 | 62 | 0 |
| Mode M9 | |||
|---|---|---|---|
| Quadrant | BADHDUFLAG | Total packets | Discarded packets |
| A | 0 | 6 | 0 |
| B | 0 | 6 | 0 |
| C | 0 | 6 | 0 |
| D | 0 | 7 | 0 |
| Mode M0 | |||
|---|---|---|---|
| Quadrant | BADHDUFLAG | Total packets | Discarded packets |
| A | 0 | 6882 | 174 |
| B | 0 | 6495 | 146 |
| C | 0 | 6265 | 116 |
| D | 0 | 7238 | 106 |
| Quadrant | Total seconds | Saturated seconds | Saturation percentage |
|---|---|---|---|
| A | 2974 | 24 | 0.806994% |
| B | 2979 | 7 | 0.234978% |
| C | 2987 | 4 | 0.133914% |
| D | 2995 | 13 | 0.434057% |
Noise dominated data is calculated using 1-second bins in cleaned event files. If a bin has >2000 counts, and if more than 50% of those come from <1% of pixels, then it is considered to be noise-dominated and hence unusable.
| Quadrant | # 1 sec bins | Bins with >0 counts | Bins with >2000 counts | High rate bins dominated by noise | Noise dominated (total time) | Noise dominated (detector-on time) | Marked lightcurve |
|---|---|---|---|---|---|---|---|
| A | 3040 | 3036 | 12 | 12 | 0.39% | 0.40% | 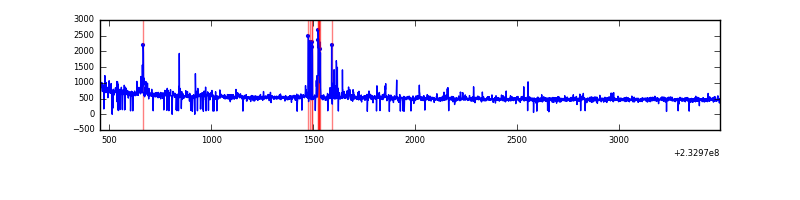 |
| B | 3040 | 3036 | 2 | 2 | 0.07% | 0.07% | 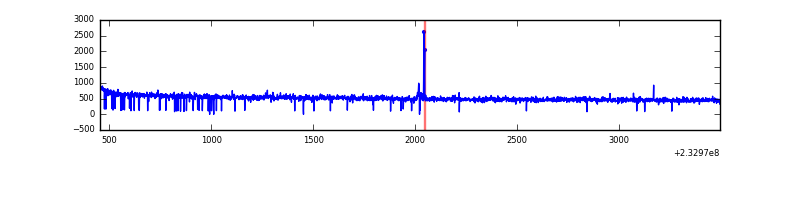 |
| C | 3040 | 3036 | 0 | 0 | 0.00% | 0.00% | 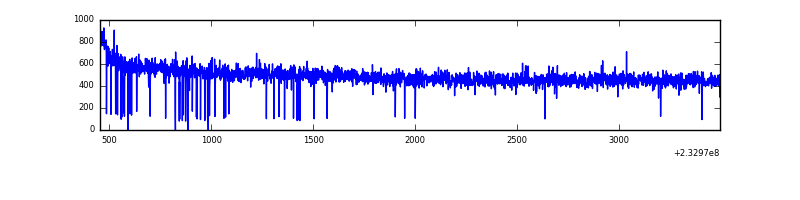 |
| D | 3040 | 3038 | 2 | 2 | 0.07% | 0.07% | 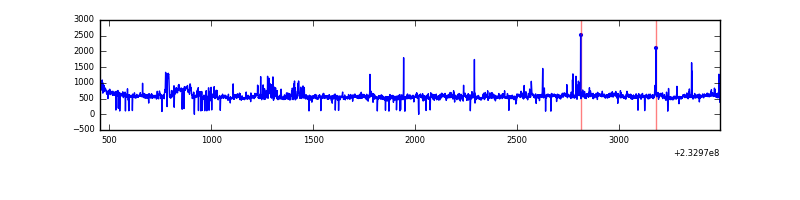 |
Top three noisy pixels from each quadrant. If the there are fewer than three noisy pixels in the level2.evt file, extra rows are filled as -1
| Pixel properties | Quadrant properties | ||||||
|---|---|---|---|---|---|---|---|
| Quadrant | DetID | PixID | Counts | Sigma | Mean | Median | Sigma |
| A | 8 | 5 | 78762 | 984.21 | 394 | 386 | 79.6 |
| A | 15 | 174 | 46333 | 576.98 | 394 | 386 | 79.6 |
| A | 5 | 16 | 7021 | 83.32 | 394 | 386 | 79.6 |
| B | 10 | 252 | 12743 | 165.74 | 389 | 382 | 74.6 |
| B | 12 | 111 | 7882 | 100.57 | 389 | 382 | 74.6 |
| B | 11 | 111 | 6463 | 81.54 | 389 | 382 | 74.6 |
| C | 13 | 61 | 2927 | 29.15 | 374 | 376 | 87.5 |
| C | 12 | 4 | 1009 | 7.23 | 374 | 376 | 87.5 |
| C | 3 | 202 | 940 | 6.44 | 374 | 376 | 87.5 |
| D | 8 | 195 | 224027 | 2392.0 | 379 | 370 | 93.5 |
| D | 2 | 14 | 37933 | 401.73 | 379 | 370 | 93.5 |
| D | 2 | 136 | 29364 | 310.09 | 379 | 370 | 93.5 |
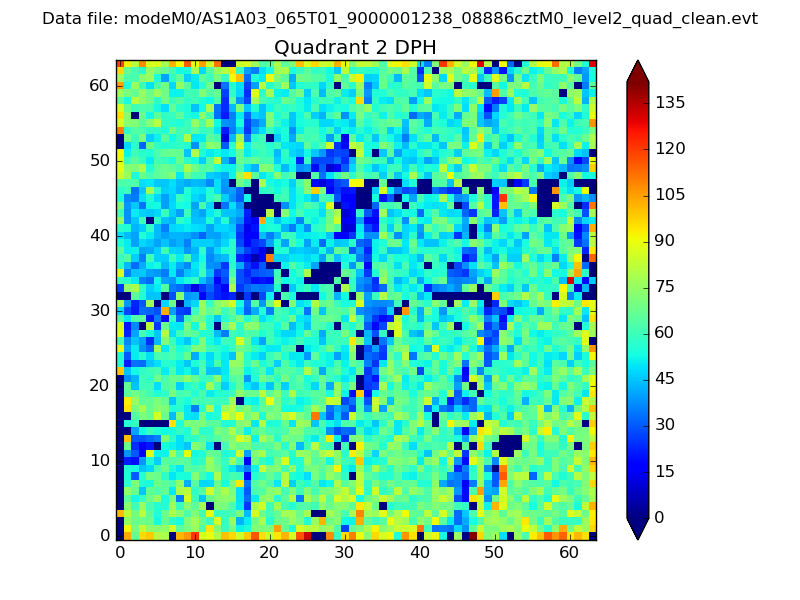
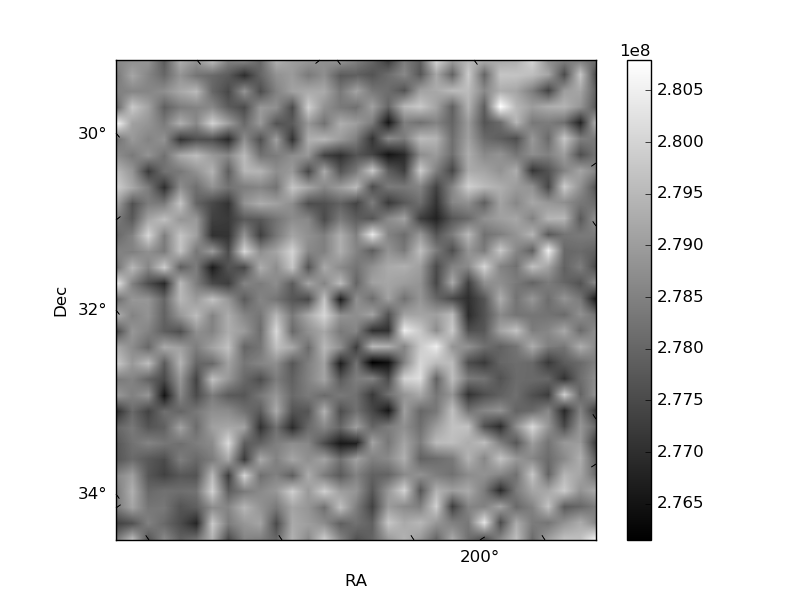
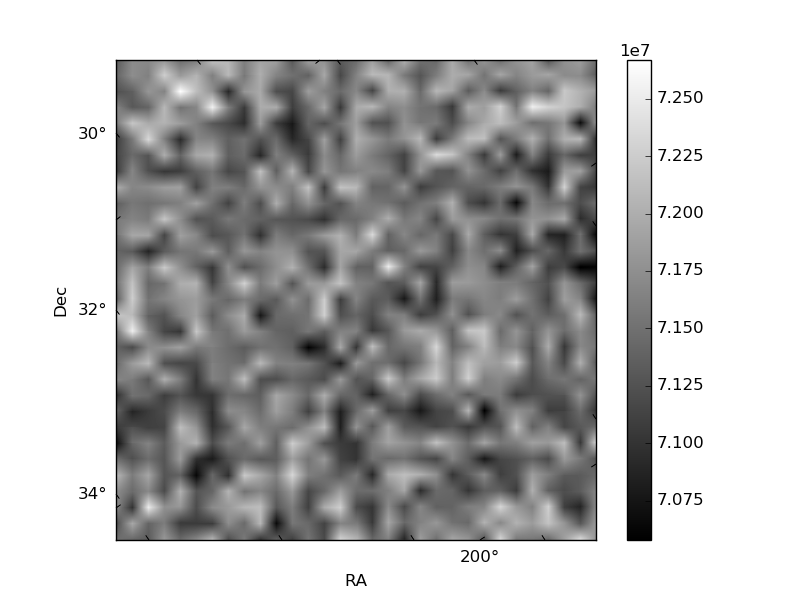
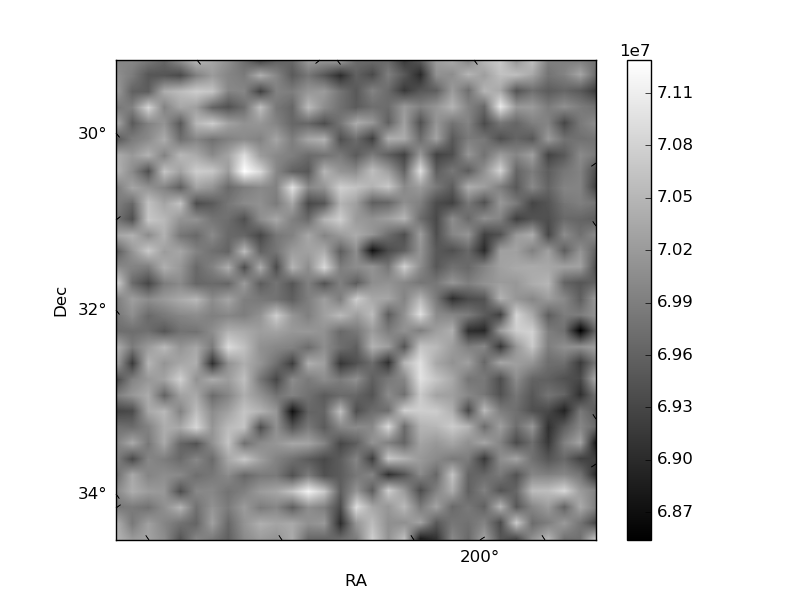
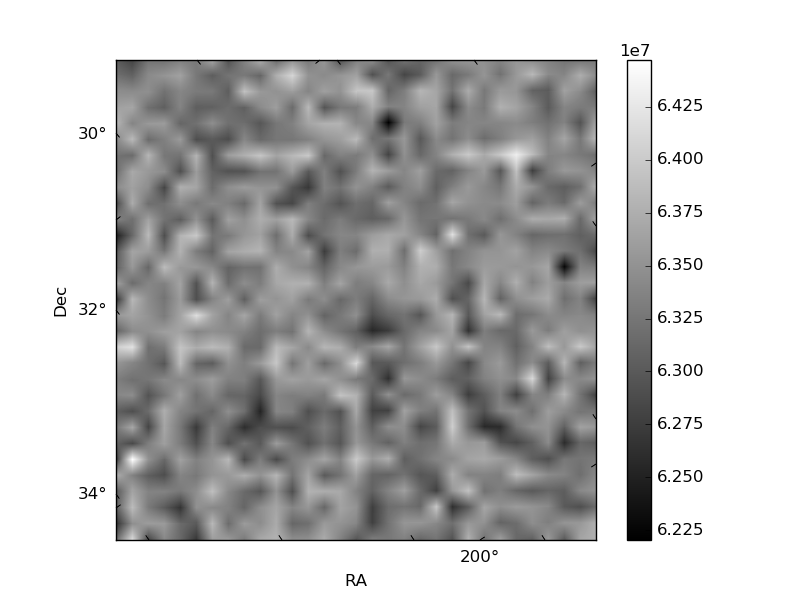
Histogram calculated using DETX and DETY for each event in the final _common_clean file
| Quadrant A | 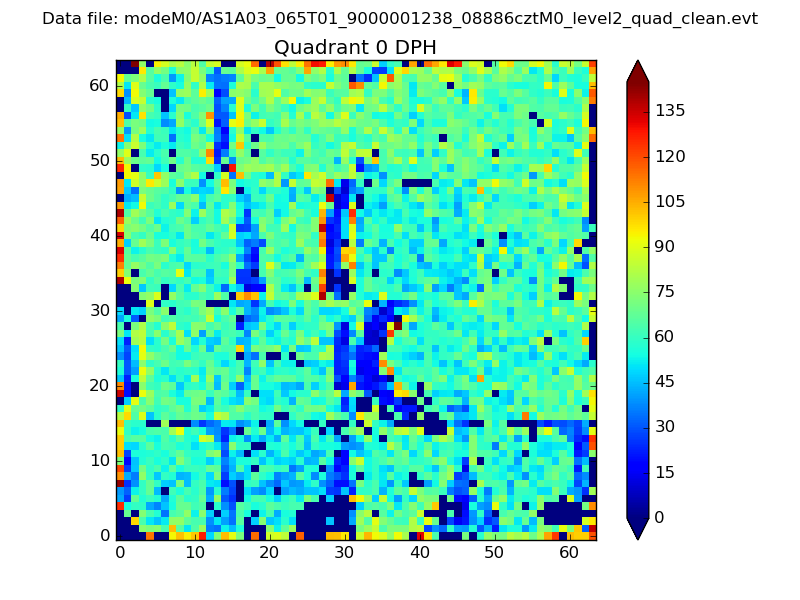 |
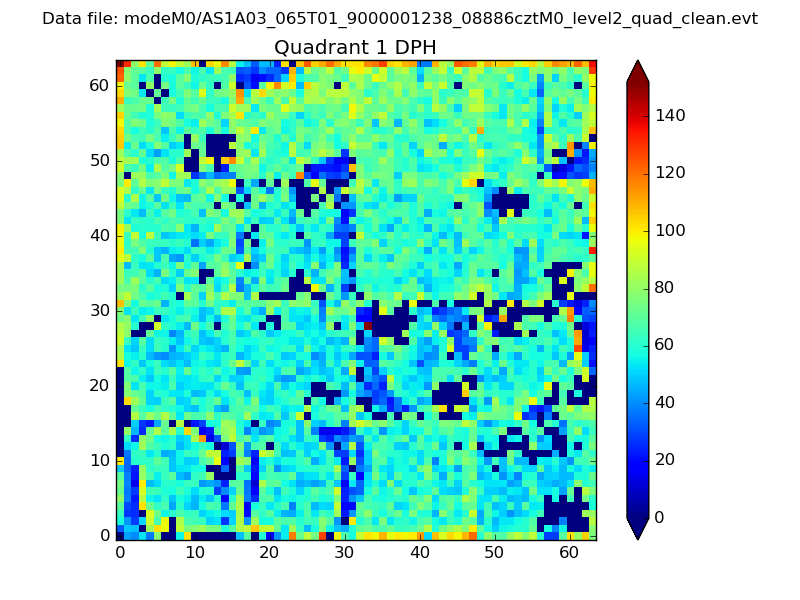 |
Quadrant B |
|---|---|---|---|
| Quadrant D | 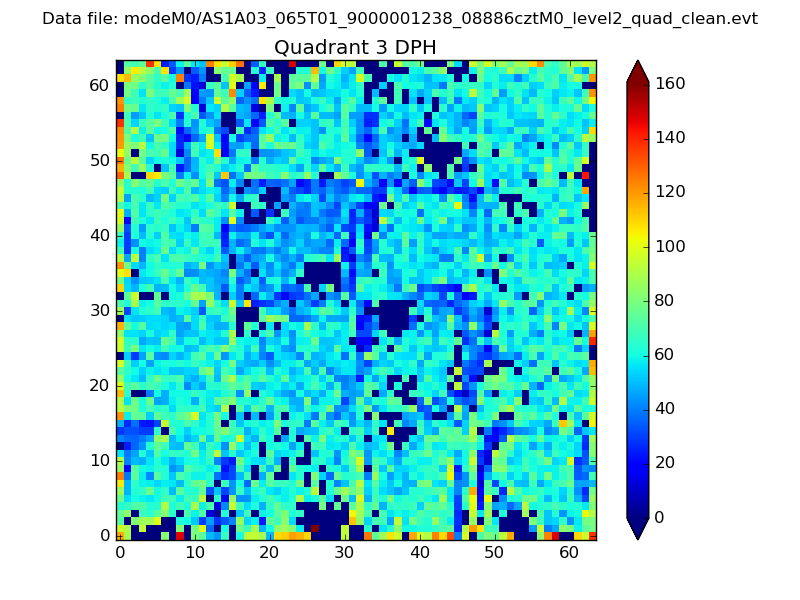 |
 |
Quadrant C |
| Plot type | Count rate plots | Images |
|---|---|---|
| Comparison with Poisson distribution Blue bars denote a histogram of data divided into 1 sec bins. Red curve is a Poisson curve with rate = median count rate of data. |
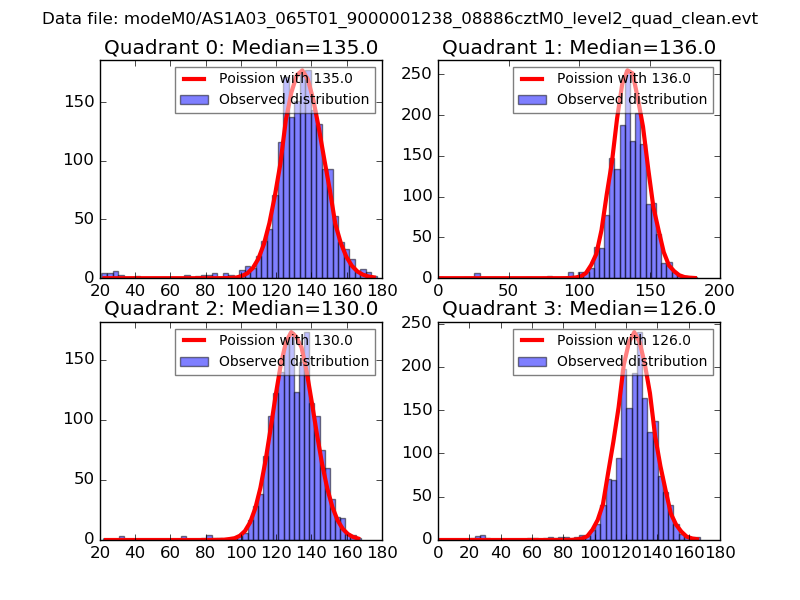 |
 |
| Quadrant-wise count rates Data is divided into 100 sec bins |
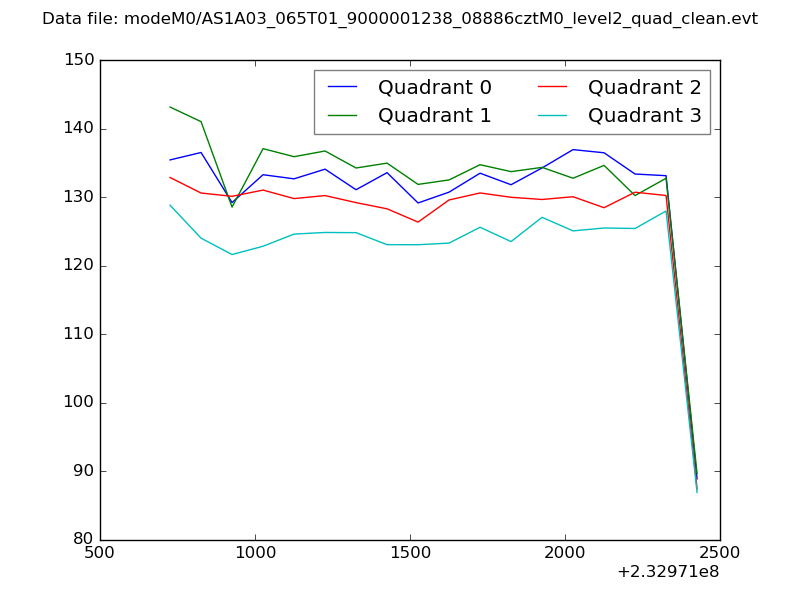 |
|
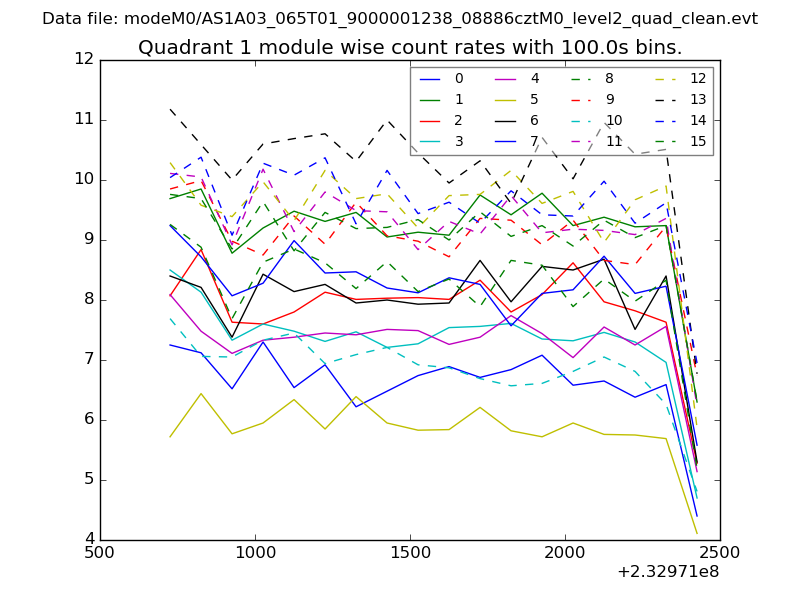
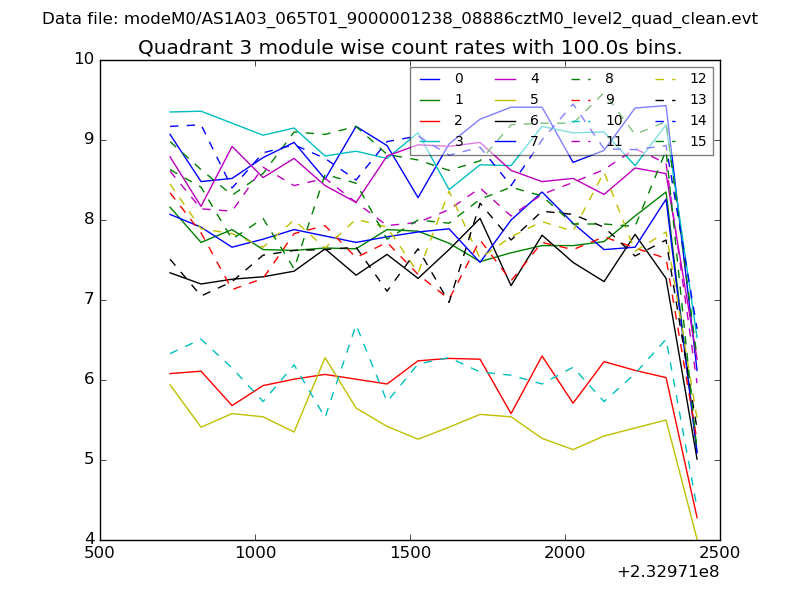
| Module-wise count rates for Quadrant A Data is divided into 100 sec bins |
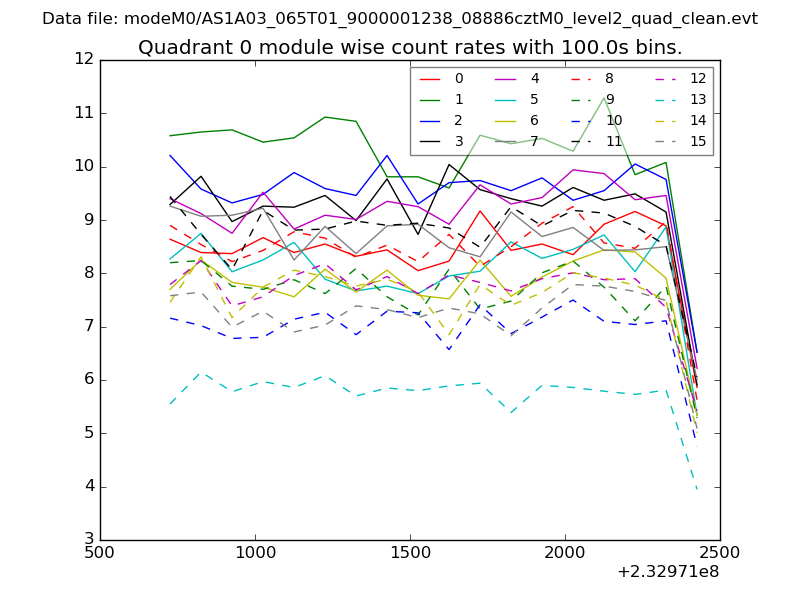 |
 |
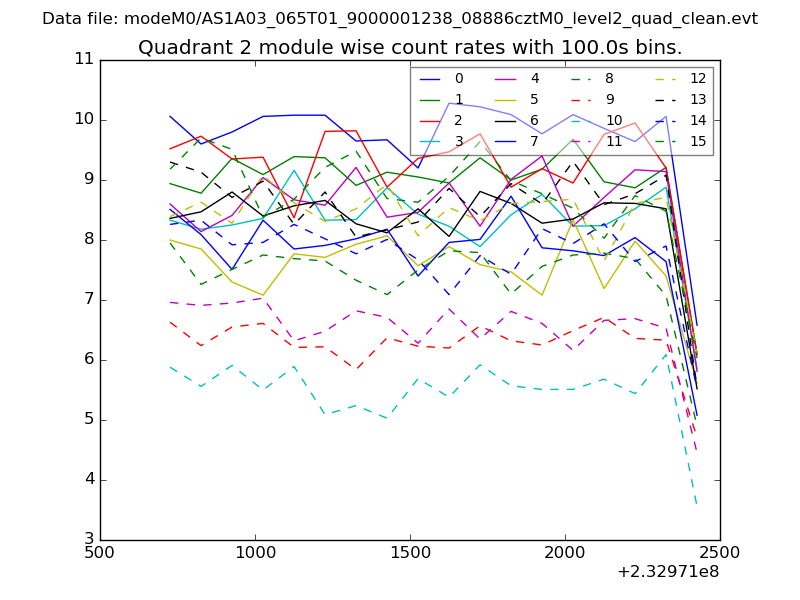
| Module-wise count rates for Quadrant B Data is divided into 100 sec bins |
 |
 |
| Module-wise count rates for Quadrant C Data is divided into 100 sec bins |
 |
 |
| Module-wise count rates for Quadrant D Data is divided into 100 sec bins |
 |
 |
| Parameter | Plot |
|---|---|
| CZT HV Monitor |  |
| D_VDD |  |
| Temperature 1 |  |
| Veto HV Monitor | 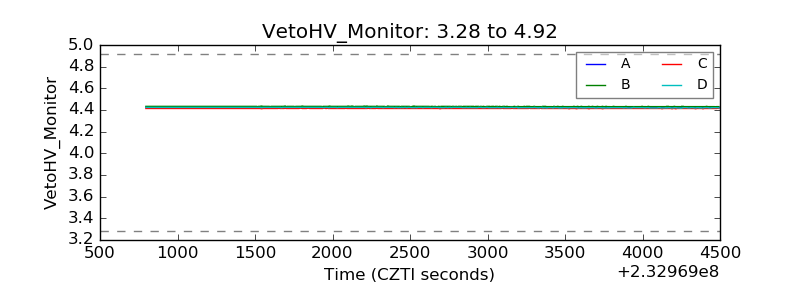 |
| Veto LLD | 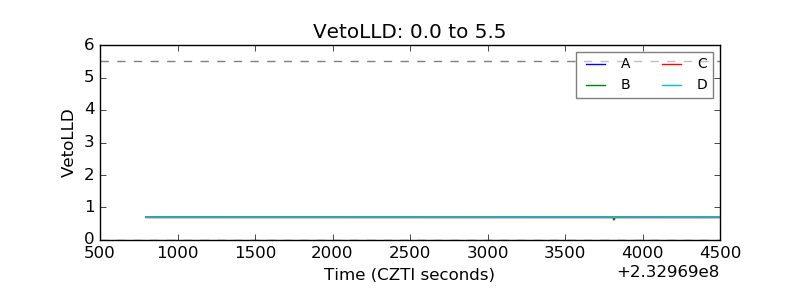 |
| Alpha Counter | 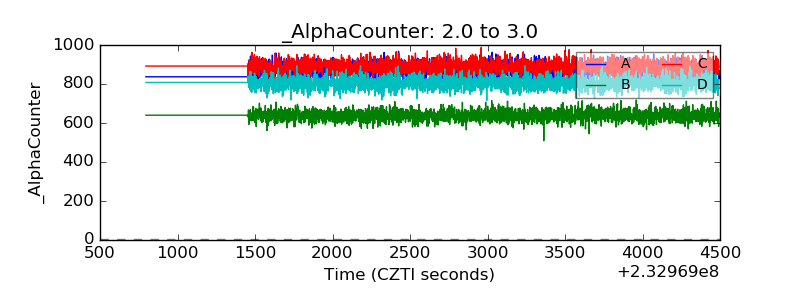 |
| _CPM_Rate | 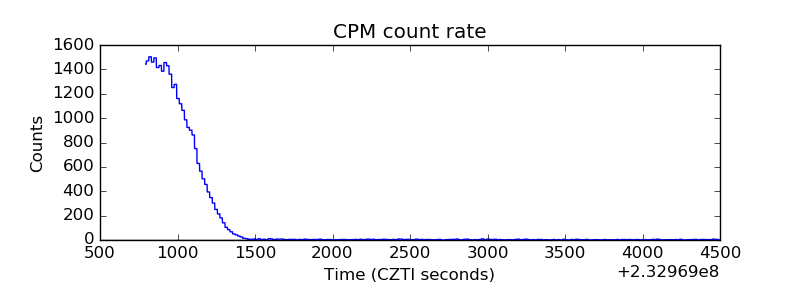 |
| CZT Counter | 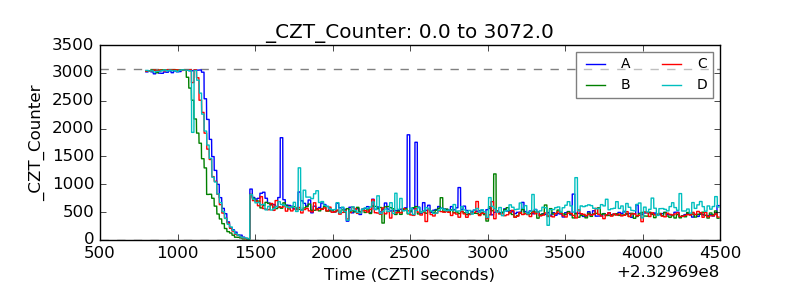 |
| +2.5 Volts monitor |  |
| +5 Volts monitor |  |
| _ROLL_ROT | 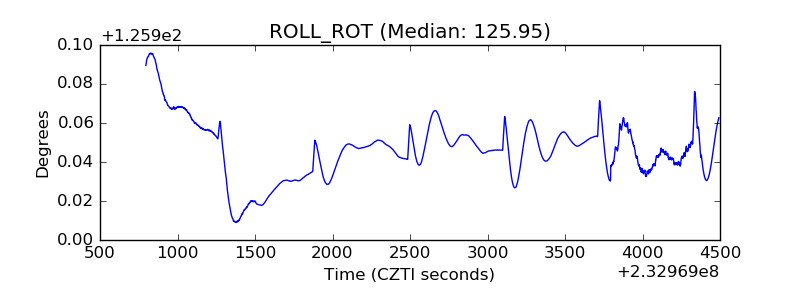 |
| _Roll_DEC | 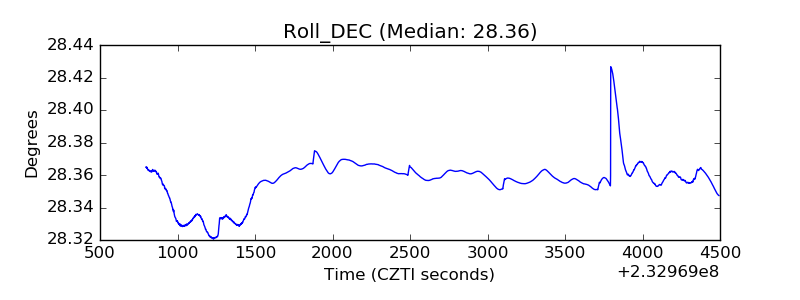 |
| _Roll_RA | 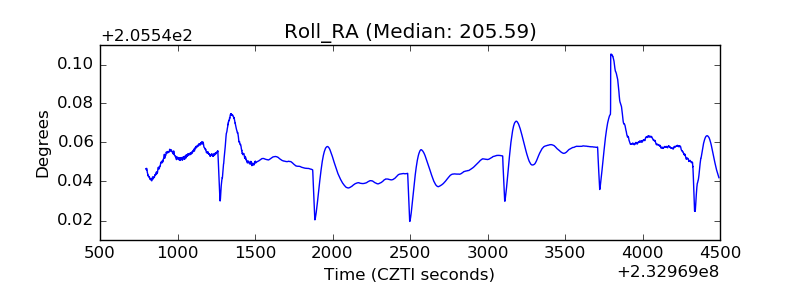 |
| Veto Counter | 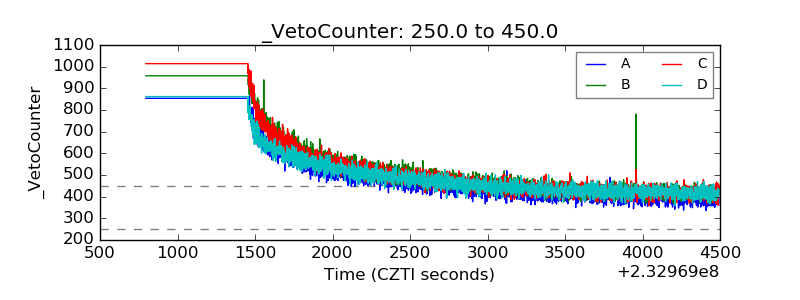 |