| Param | Original file | Final file |
|---|---|---|
| Filename | modeM0/AS1G07_046T01_9000001236cztM0_level2.fits | modeM0/AS1G07_046T01_9000001236cztM0_level2_quad_clean.evt |
| Size (bytes) | 375,488,640 | 372,720,960 |
| Size | 358.1 MB | 355.5 MB |
| Events in quadrant A | 2,324,698 | 2,321,730 |
| Events in quadrant B | 2,124,720 | 2,110,942 |
| Events in quadrant C | 2,297,484 | 2,196,866 |
| Events in quadrant D | 2,012,328 | 2,047,511 |
| Mode M9 | |||
|---|---|---|---|
| Quadrant | BADHDUFLAG | Total packets | Discarded packets |
| A | 0 | 75 | 0 |
| B | 0 | 75 | 0 |
| C | 0 | 75 | 0 |
| D | 0 | 75 | 0 |
| Mode M0 | |||
|---|---|---|---|
| Quadrant | BADHDUFLAG | Total packets | Discarded packets |
| A | 0 | 89261 | 0 |
| B | 0 | 111777 | 0 |
| C | 0 | 86749 | 0 |
| D | 0 | 86312 | 0 |
| Mode SS | |||
|---|---|---|---|
| Quadrant | BADHDUFLAG | Total packets | Discarded packets |
| A | 0 | 782 | 0 |
| B | 0 | 782 | 0 |
| C | 0 | 782 | 0 |
| D | 0 | 782 | 0 |
| Quadrant | Total seconds | Saturated seconds | Saturation percentage |
|---|---|---|---|
| A | 38004 | 830 | 2.183981% |
| B | 38007 | 3901 | 10.263899% |
| C | 38005 | 606 | 1.594527% |
| D | 38006 | 729 | 1.918118% |
Noise dominated data is calculated using 1-second bins in cleaned event files. If a bin has >2000 counts, and if more than 50% of those come from <1% of pixels, then it is considered to be noise-dominated and hence unusable.
| Quadrant | # 1 sec bins | Bins with >0 counts | Bins with >2000 counts | High rate bins dominated by noise | Noise dominated (total time) | Noise dominated (detector-on time) | Marked lightcurve |
|---|---|---|---|---|---|---|---|
| A | 45666 | 38004 | 0 | 0 | 0.00% | 0.00% |  |
| B | 45666 | 37998 | 0 | 0 | 0.00% | 0.00% |  |
| C | 45666 | 38006 | 0 | 0 | 0.00% | 0.00% | 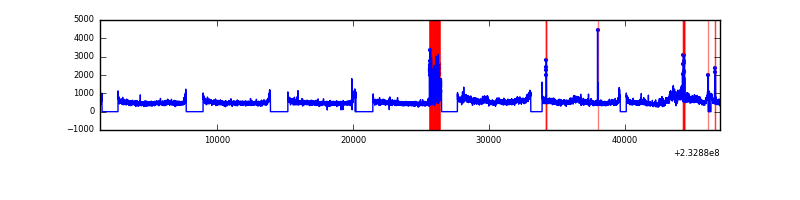 |
| D | 45666 | 38001 | 0 | 0 | 0.00% | 0.00% |  |
Top three noisy pixels from each quadrant. If the there are fewer than three noisy pixels in the level2.evt file, extra rows are filled as -1
| Pixel properties | Quadrant properties | ||||||
|---|---|---|---|---|---|---|---|
| Quadrant | DetID | PixID | Counts | Sigma | Mean | Median | Sigma |
| A | 0 | 29 | 2377 | 12.01 | 603 | 565 | 150.9 |
| A | 7 | 110 | 1951 | 9.19 | 603 | 565 | 150.9 |
| A | 0 | 30 | 1819 | 8.31 | 603 | 565 | 150.9 |
| B | 2 | 9 | 1863 | 11.83 | 560 | 534 | 112.4 |
| B | 3 | 17 | 1420 | 7.88 | 560 | 534 | 112.4 |
| B | 14 | 254 | 1411 | 7.8 | 560 | 534 | 112.4 |
| C | 1 | 81 | 1707 | 7.14 | 607 | 564 | 160.0 |
| C | 1 | 80 | 1687 | 7.02 | 607 | 564 | 160.0 |
| C | 3 | 158 | 1536 | 6.08 | 607 | 564 | 160.0 |
| D | 3 | 14 | 1495 | 6.28 | 573 | 519 | 155.4 |
| D | 10 | 189 | 1490 | 6.25 | 573 | 519 | 155.4 |
| D | 6 | 231 | 1453 | 6.01 | 573 | 519 | 155.4 |
Histogram calculated using DETX and DETY for each event in the final _common_clean file
| Quadrant A |  |
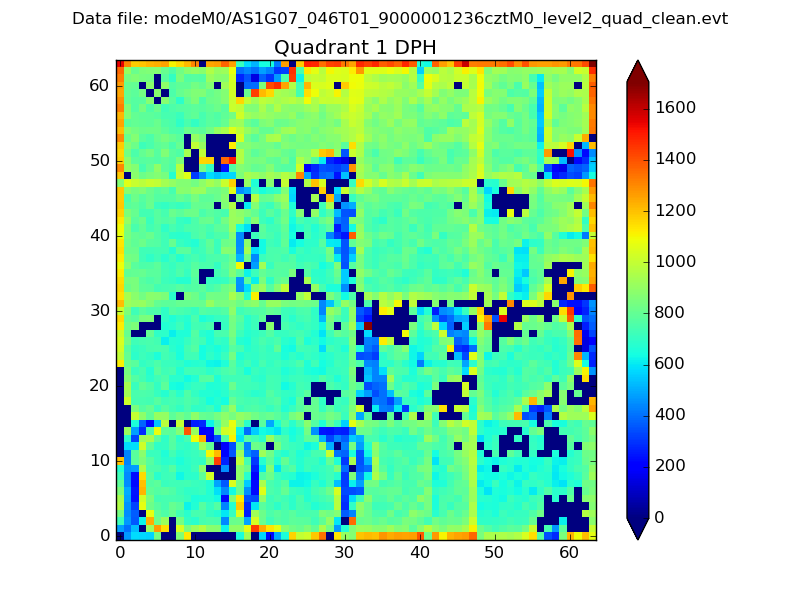 |
Quadrant B |
|---|---|---|---|
| Quadrant D |  |
 |
Quadrant C |
| Plot type | Count rate plots | Images |
|---|---|---|
| Comparison with Poisson distribution Blue bars denote a histogram of data divided into 1 sec bins. Red curve is a Poisson curve with rate = median count rate of data. |
 |
 |
| Quadrant-wise count rates Data is divided into 100 sec bins |
 |
|
| Module-wise count rates for Quadrant A Data is divided into 100 sec bins |
 |
 |
| Module-wise count rates for Quadrant B Data is divided into 100 sec bins |
 |
 |
| Module-wise count rates for Quadrant C Data is divided into 100 sec bins |
 |
 |
| Module-wise count rates for Quadrant D Data is divided into 100 sec bins |
 |
 |
| Parameter | Plot |
|---|---|
| CZT HV Monitor | 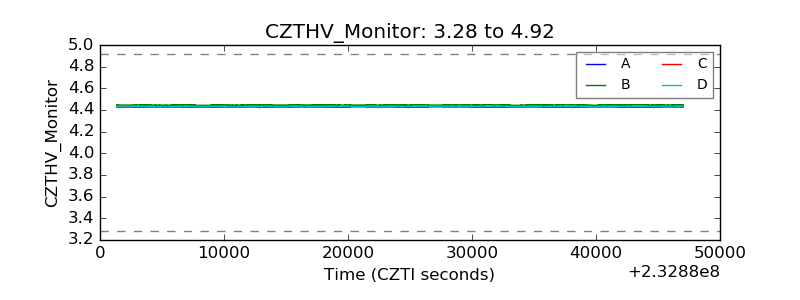 |
| D_VDD |  |
| Temperature 1 |  |
| Veto HV Monitor |  |
| Veto LLD |  |
| Alpha Counter |  |
| _CPM_Rate | 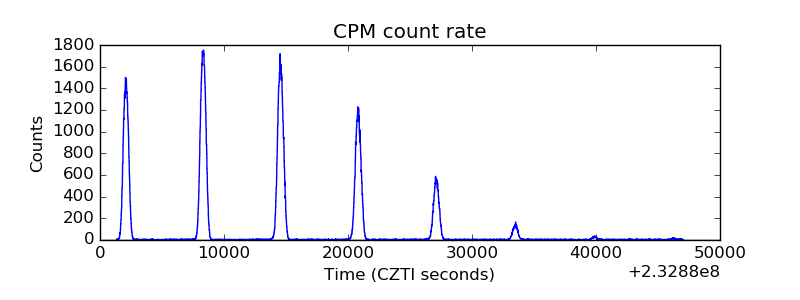 |
| CZT Counter |  |
| +2.5 Volts monitor |  |
| +5 Volts monitor |  |
| _ROLL_ROT | 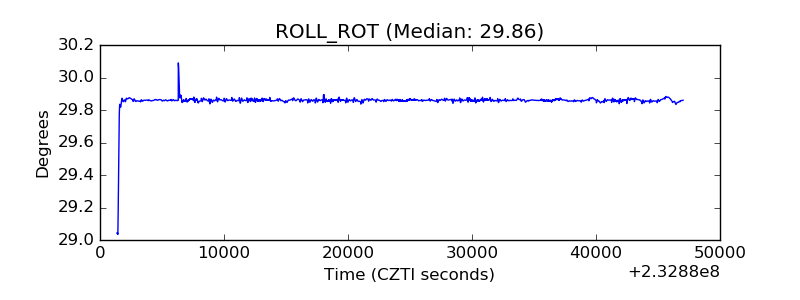 |
| _Roll_DEC | 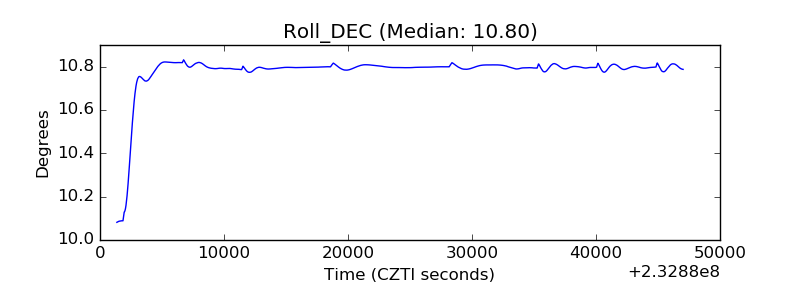 |
| _Roll_RA | 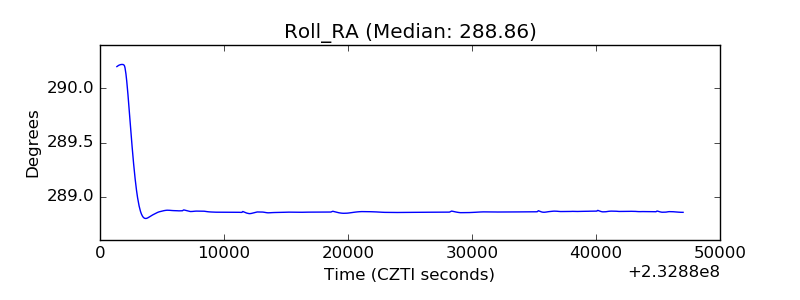 |
| Veto Counter |  |