| Param | Original file | Final file |
|---|---|---|
| Filename | modeM0/AS1G07_046T01_9000001236_08870cztM0_level2.evt | modeM0/AS1G07_046T01_9000001236_08870cztM0_level2_quad_clean.evt |
| Size (bytes) | 147,882,240 | 15,209,280 |
| Size | 141.0 MB | 14.5 MB |
| Events in quadrant A | 987,658 | 85,498 |
| Events in quadrant B | 1,579,205 | 86,630 |
| Events in quadrant C | 858,486 | 85,626 |
| Events in quadrant D | 940,093 | 81,808 |
| Mode M9 | |||
|---|---|---|---|
| Quadrant | BADHDUFLAG | Total packets | Discarded packets |
| A | 0 | 11 | 0 |
| B | 0 | 11 | 0 |
| C | 0 | 11 | 0 |
| D | 0 | 11 | 0 |
| Mode M0 | |||
|---|---|---|---|
| Quadrant | BADHDUFLAG | Total packets | Discarded packets |
| A | 0 | 4049 | 2 |
| B | 0 | 5836 | 1 |
| C | 0 | 3505 | 1 |
| D | 0 | 3728 | 1 |
| Mode SS | |||
|---|---|---|---|
| Quadrant | BADHDUFLAG | Total packets | Discarded packets |
| A | 0 | 36 | 0 |
| B | 0 | 36 | 0 |
| C | 0 | 36 | 0 |
| D | 0 | 36 | 0 |
| Quadrant | Total seconds | Saturated seconds | Saturation percentage |
|---|---|---|---|
| A | 1629 | 42 | 2.578269% |
| B | 1629 | 53 | 3.253530% |
| C | 1629 | 13 | 0.798036% |
| D | 1629 | 28 | 1.718846% |
Noise dominated data is calculated using 1-second bins in cleaned event files. If a bin has >2000 counts, and if more than 50% of those come from <1% of pixels, then it is considered to be noise-dominated and hence unusable.
| Quadrant | # 1 sec bins | Bins with >0 counts | Bins with >2000 counts | High rate bins dominated by noise | Noise dominated (total time) | Noise dominated (detector-on time) | Marked lightcurve |
|---|---|---|---|---|---|---|---|
| A | 2809 | 1629 | 0 | 0 | 0.00% | 0.00% | 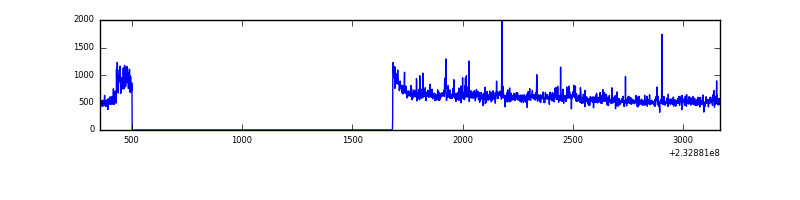 |
| B | 2809 | 1629 | 0 | 0 | 0.00% | 0.00% | 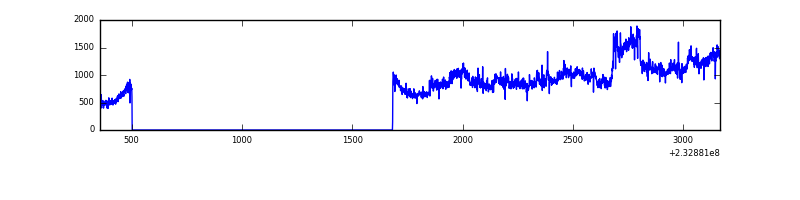 |
| C | 2809 | 1630 | 0 | 0 | 0.00% | 0.00% | 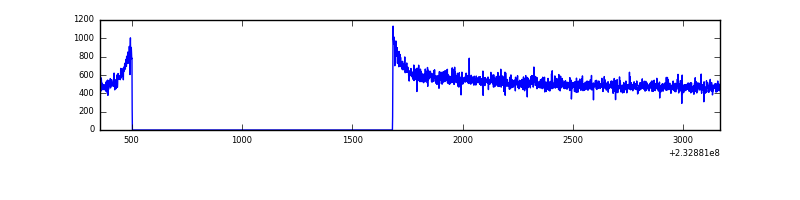 |
| D | 2809 | 1629 | 3 | 3 | 0.11% | 0.18% | 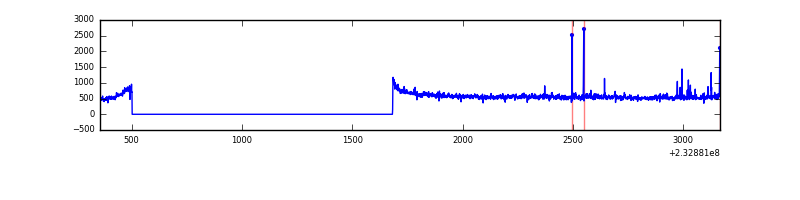 |
Top three noisy pixels from each quadrant. If the there are fewer than three noisy pixels in the level2.evt file, extra rows are filled as -1
| Pixel properties | Quadrant properties | ||||||
|---|---|---|---|---|---|---|---|
| Quadrant | DetID | PixID | Counts | Sigma | Mean | Median | Sigma |
| A | 8 | 5 | 84240 | 1727.12 | 232 | 228 | 48.6 |
| A | 15 | 174 | 3950 | 76.52 | 232 | 228 | 48.6 |
| A | 5 | 16 | 3948 | 76.48 | 232 | 228 | 48.6 |
| B | 7 | 202 | 686346 | 15120.51 | 228 | 223 | 45.4 |
| B | 12 | 111 | 4578 | 95.97 | 228 | 223 | 45.4 |
| B | 11 | 111 | 3743 | 77.57 | 228 | 223 | 45.4 |
| C | 9 | 54 | 2409 | 42.22 | 219 | 221 | 51.8 |
| C | 13 | 61 | 1677 | 28.1 | 219 | 221 | 51.8 |
| C | 3 | 202 | 534 | 6.04 | 219 | 221 | 51.8 |
| D | 8 | 195 | 68690 | 1188.65 | 222 | 217 | 57.6 |
| D | 7 | 71 | 10866 | 184.86 | 222 | 217 | 57.6 |
| D | 13 | 105 | 5774 | 96.47 | 222 | 217 | 57.6 |
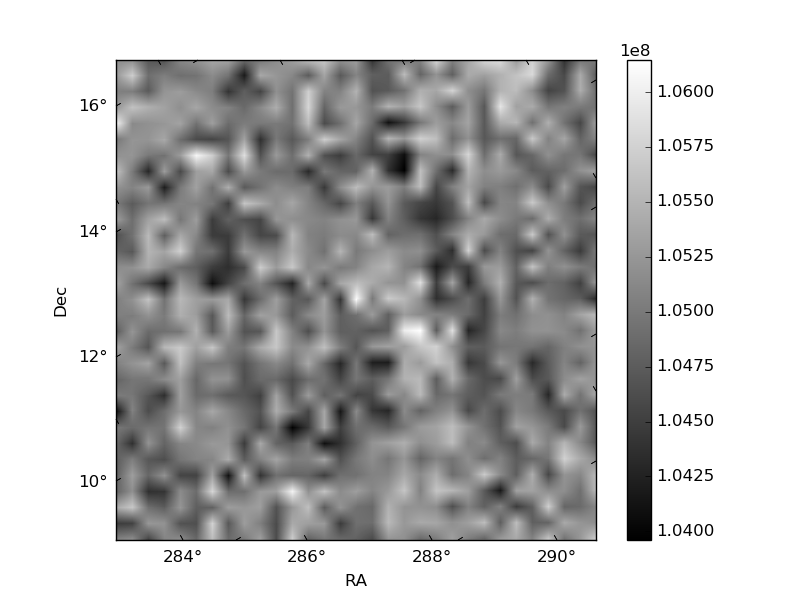
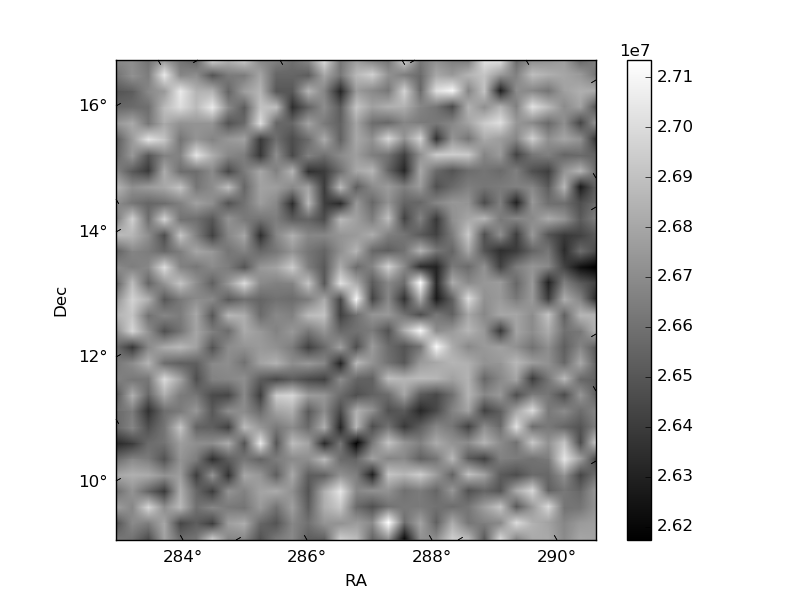
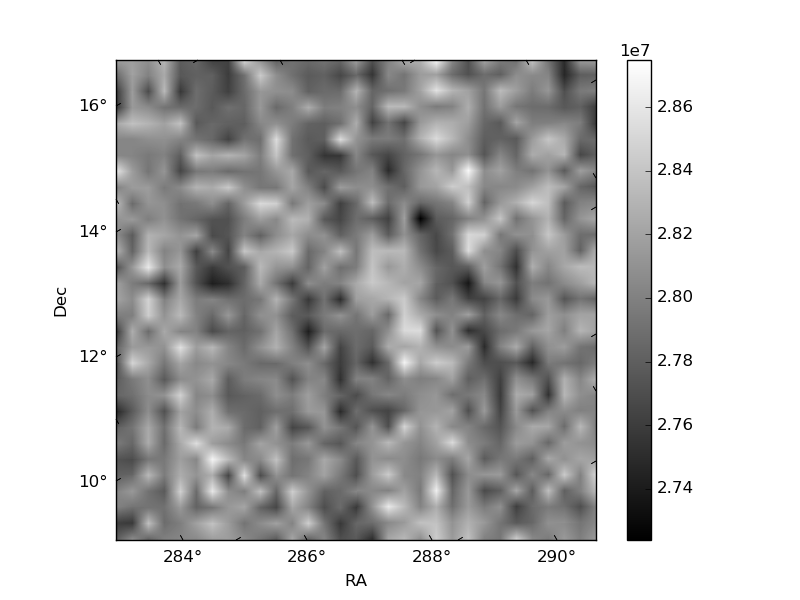
Histogram calculated using DETX and DETY for each event in the final _common_clean file
| Quadrant A | 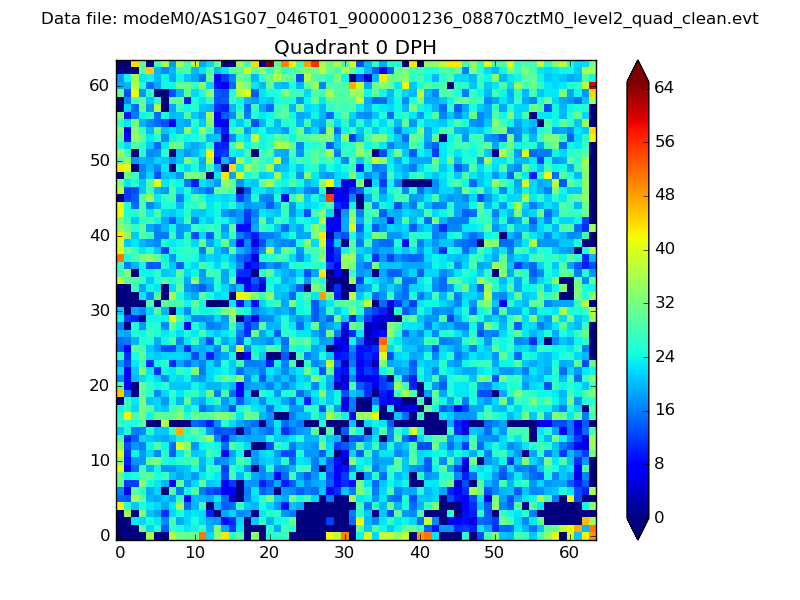 |
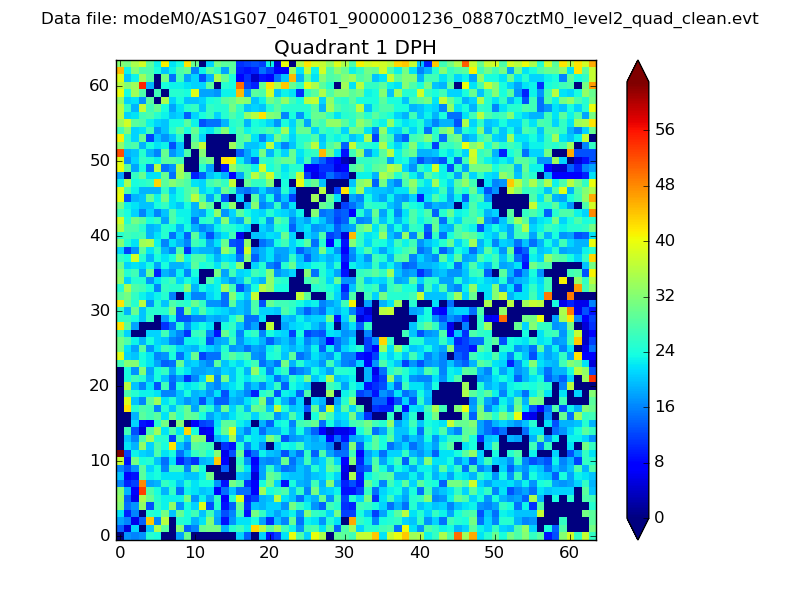 |
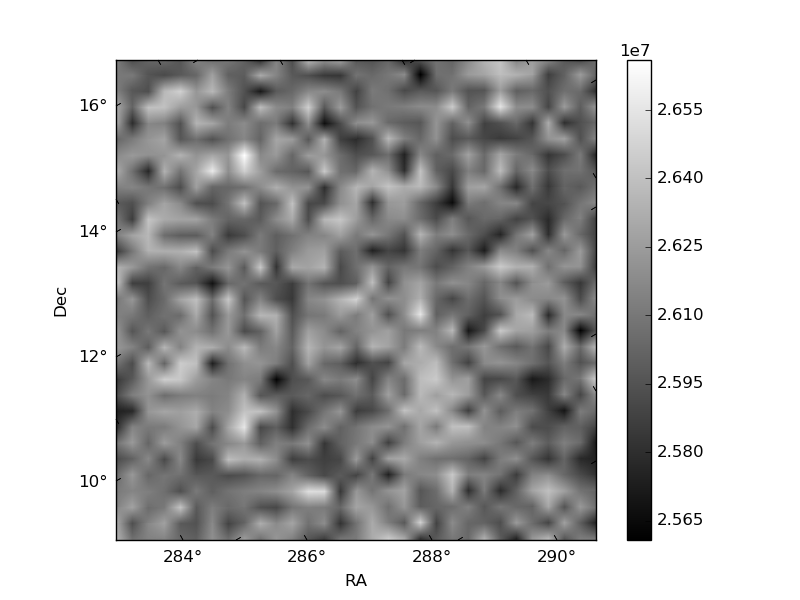
Quadrant B |
|---|---|---|---|
| Quadrant D | 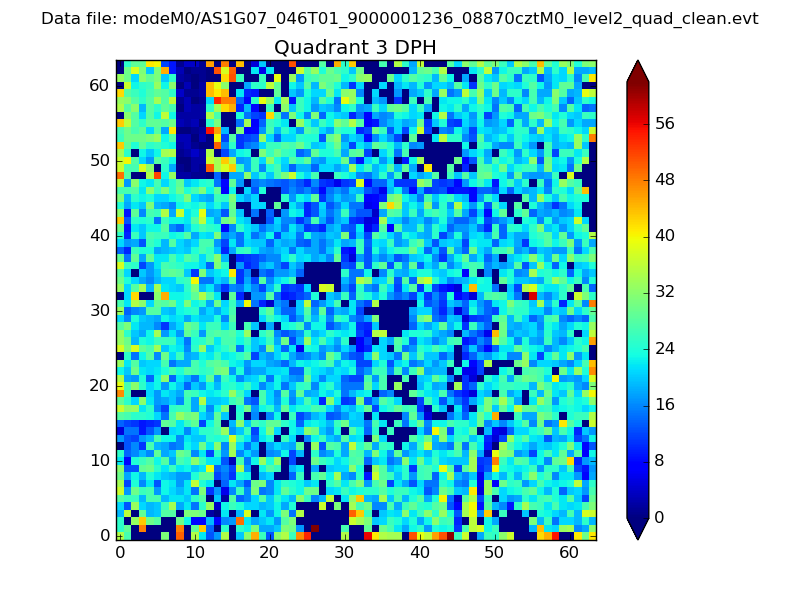 |
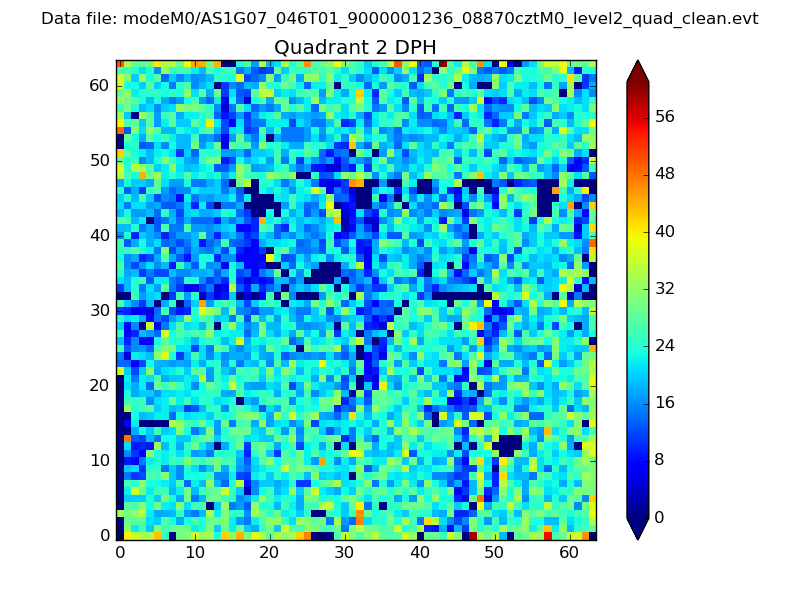 |
Quadrant C |
| Plot type | Count rate plots | Images |
|---|---|---|
| Comparison with Poisson distribution Blue bars denote a histogram of data divided into 1 sec bins. Red curve is a Poisson curve with rate = median count rate of data. |
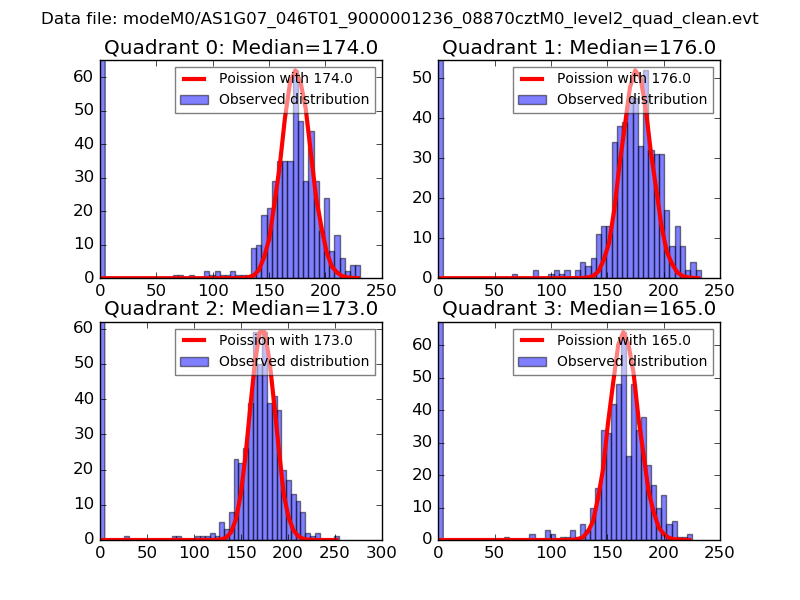 |
 |
| Quadrant-wise count rates Data is divided into 100 sec bins |
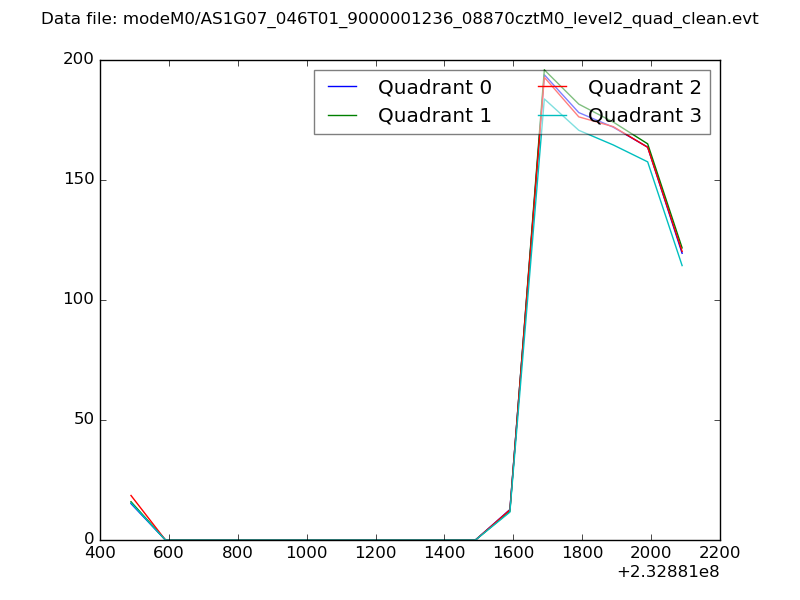 |
|
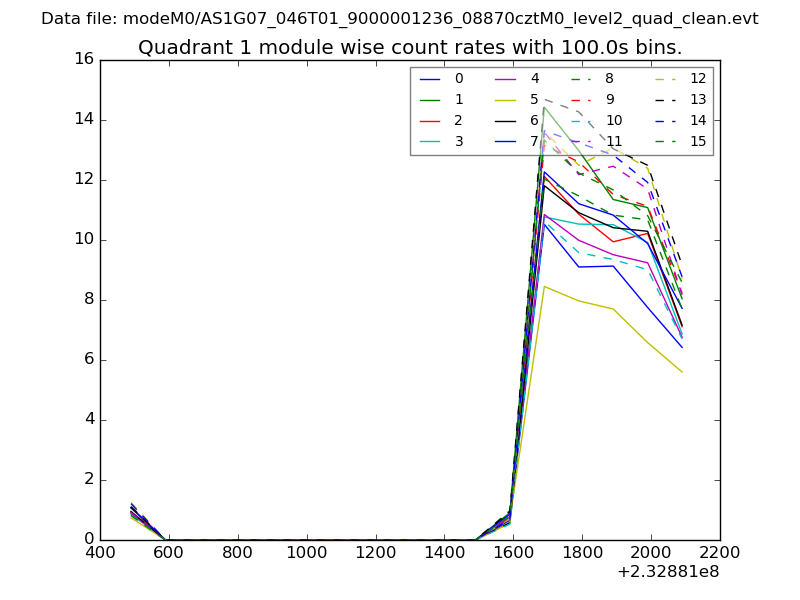
| Module-wise count rates for Quadrant A Data is divided into 100 sec bins |
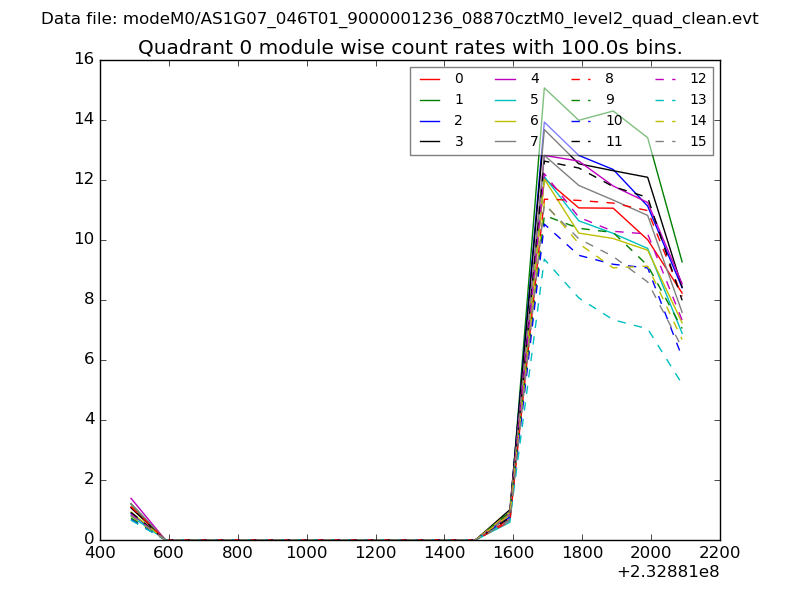 |
 |
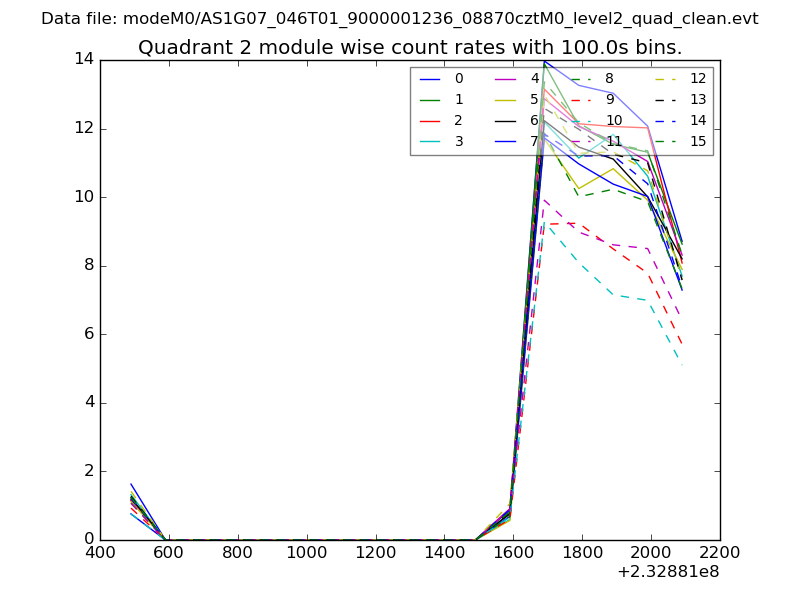
| Module-wise count rates for Quadrant B Data is divided into 100 sec bins |
 |
 |
| Module-wise count rates for Quadrant C Data is divided into 100 sec bins |
 |
 |
| Module-wise count rates for Quadrant D Data is divided into 100 sec bins |
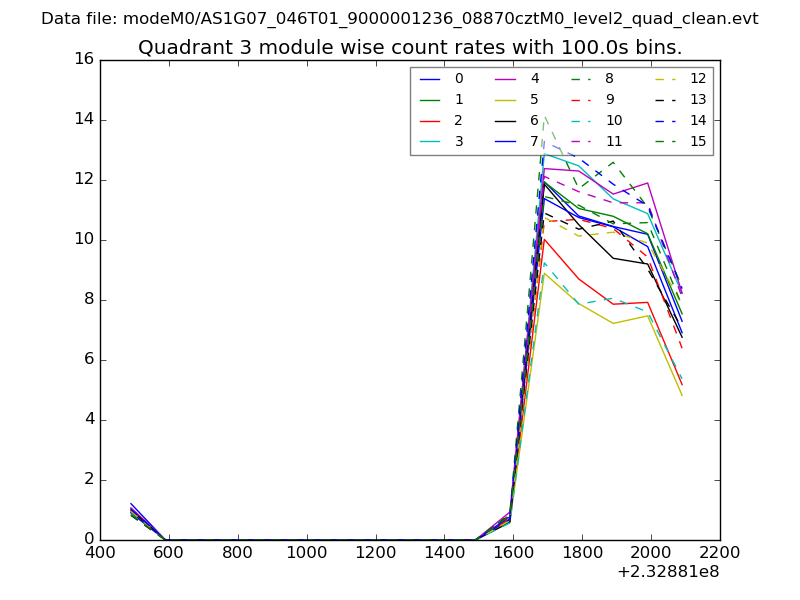 |
 |
| Parameter | Plot |
|---|---|
| CZT HV Monitor | 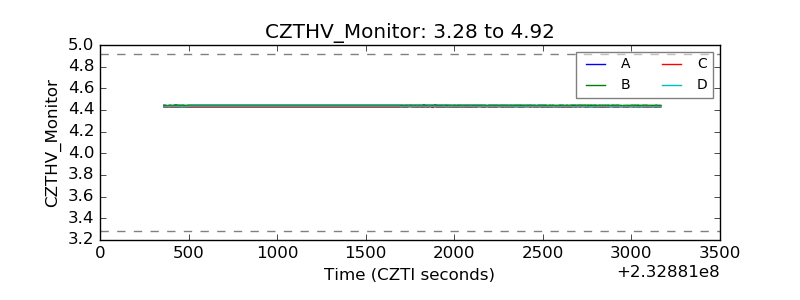 |
| D_VDD | 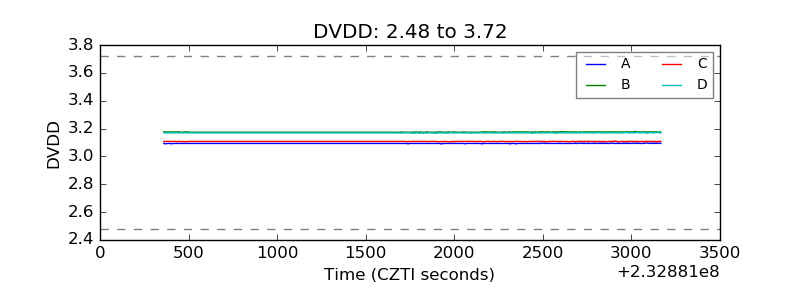 |
| Temperature 1 | 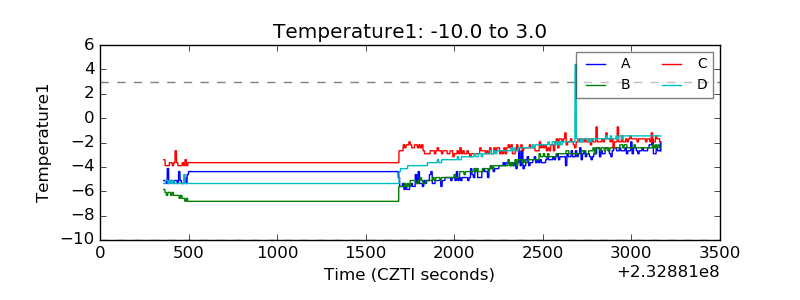 |
| Veto HV Monitor | 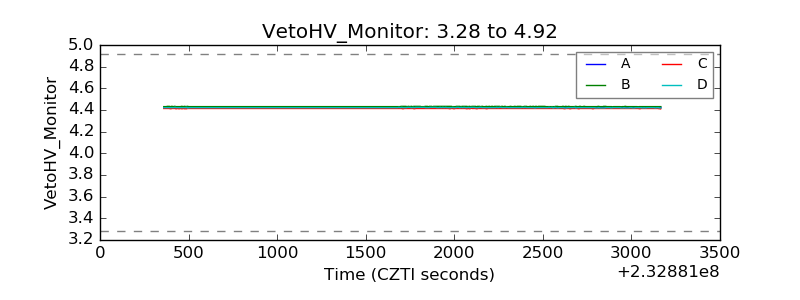 |
| Veto LLD | 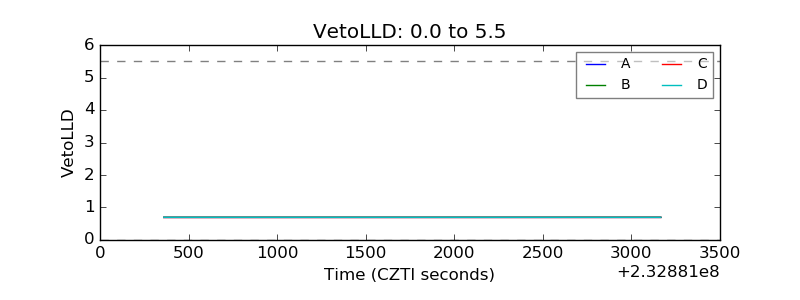 |
| Alpha Counter | 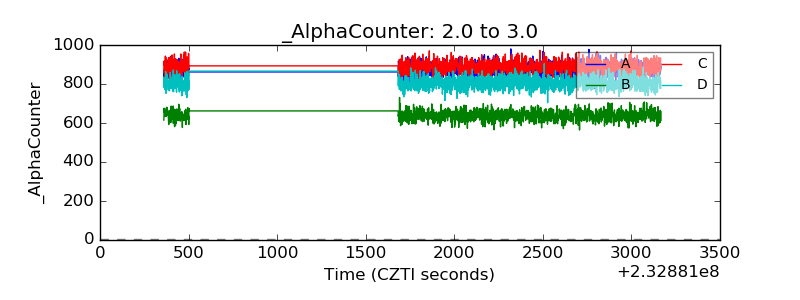 |
| _CPM_Rate | 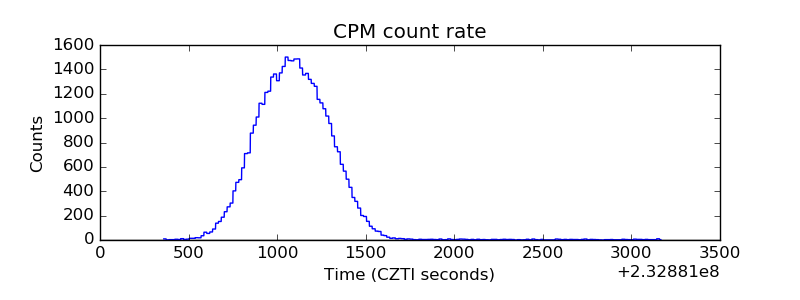 |
| CZT Counter | 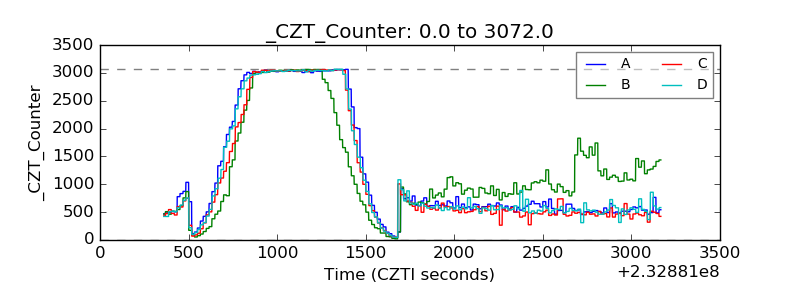 |
| +2.5 Volts monitor | 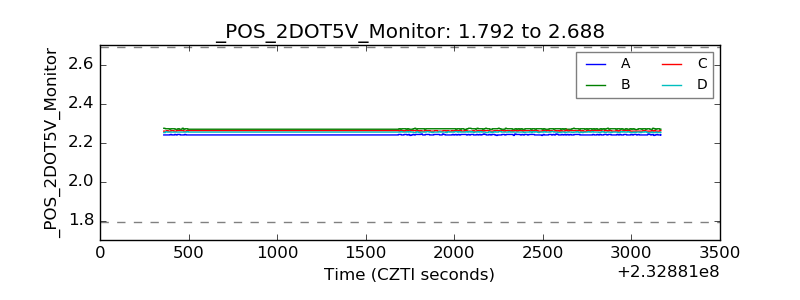 |
| +5 Volts monitor |  |
| _ROLL_ROT | 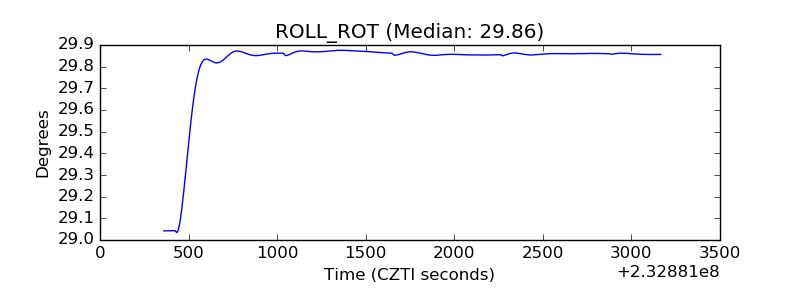 |
| _Roll_DEC | 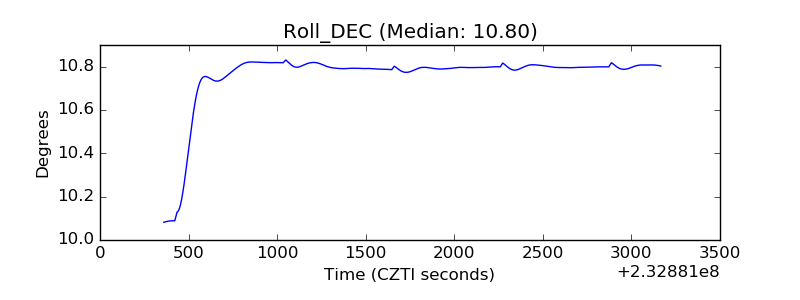 |
| _Roll_RA | 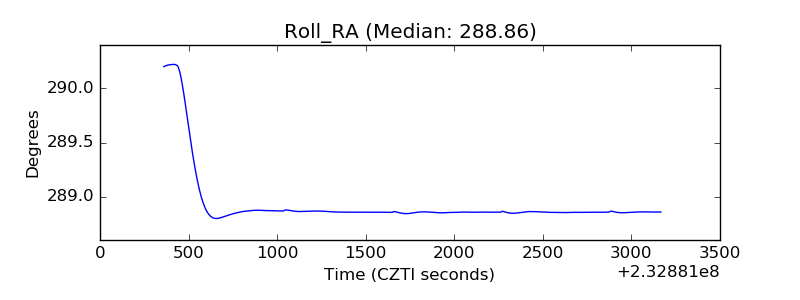 |
| Veto Counter |  |