| Param | Original file | Final file |
|---|---|---|
| Filename | modeM0/AS1G07_046T01_9000001236_08871cztM0_level2.evt | modeM0/AS1G07_046T01_9000001236_08871cztM0_level2_quad_clean.evt |
| Size (bytes) | 597,689,280 | 60,059,520 |
| Size | 570.0 MB | 57.3 MB |
| Events in quadrant A | 3,470,819 | 356,801 |
| Events in quadrant B | 7,647,504 | 339,776 |
| Events in quadrant C | 3,027,356 | 352,295 |
| Events in quadrant D | 3,541,045 | 341,320 |
| Mode M9 | |||
|---|---|---|---|
| Quadrant | BADHDUFLAG | Total packets | Discarded packets |
| A | 0 | 12 | 0 |
| B | 0 | 12 | 0 |
| C | 0 | 12 | 0 |
| D | 0 | 12 | 0 |
| Mode M0 | |||
|---|---|---|---|
| Quadrant | BADHDUFLAG | Total packets | Discarded packets |
| A | 0 | 14084 | 2 |
| B | 0 | 27001 | 1 |
| C | 0 | 12656 | 1 |
| D | 0 | 14142 | 1 |
| Mode SS | |||
|---|---|---|---|
| Quadrant | BADHDUFLAG | Total packets | Discarded packets |
| A | 0 | 126 | 0 |
| B | 0 | 126 | 0 |
| C | 0 | 126 | 0 |
| D | 0 | 126 | 0 |
| Quadrant | Total seconds | Saturated seconds | Saturation percentage |
|---|---|---|---|
| A | 6126 | 88 | 1.436500% |
| B | 6126 | 800 | 13.059092% |
| C | 6126 | 56 | 0.914136% |
| D | 6126 | 103 | 1.681358% |
Noise dominated data is calculated using 1-second bins in cleaned event files. If a bin has >2000 counts, and if more than 50% of those come from <1% of pixels, then it is considered to be noise-dominated and hence unusable.
| Quadrant | # 1 sec bins | Bins with >0 counts | Bins with >2000 counts | High rate bins dominated by noise | Noise dominated (total time) | Noise dominated (detector-on time) | Marked lightcurve |
|---|---|---|---|---|---|---|---|
| A | 7376 | 6126 | 0 | 0 | 0.00% | 0.00% | 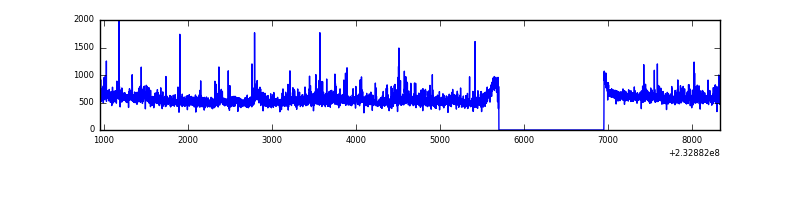 |
| B | 7375 | 6125 | 485 | 485 | 6.58% | 7.92% | 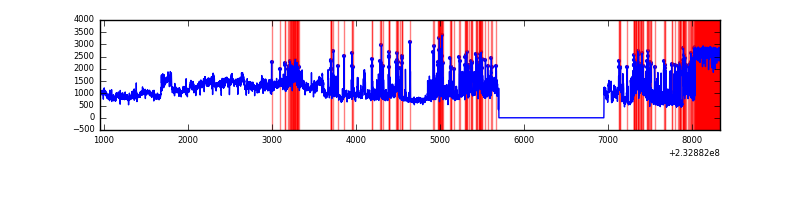 |
| C | 7376 | 6126 | 0 | 0 | 0.00% | 0.00% | 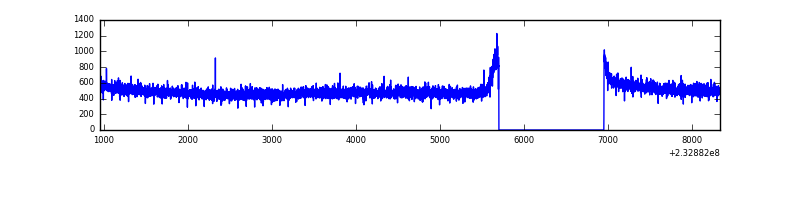 |
| D | 7376 | 6126 | 40 | 40 | 0.54% | 0.65% | 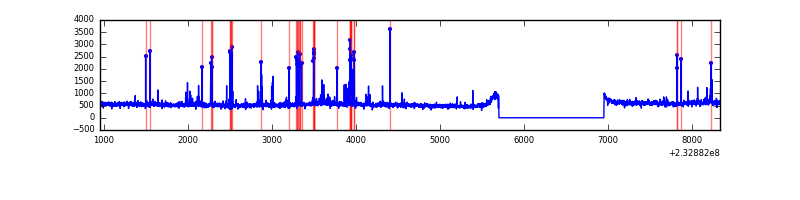 |
Top three noisy pixels from each quadrant. If the there are fewer than three noisy pixels in the level2.evt file, extra rows are filled as -1
| Pixel properties | Quadrant properties | ||||||
|---|---|---|---|---|---|---|---|
| Quadrant | DetID | PixID | Counts | Sigma | Mean | Median | Sigma |
| A | 8 | 5 | 334526 | 2043.12 | 808 | 793 | 163.3 |
| A | 13 | 248 | 11962 | 68.38 | 808 | 793 | 163.3 |
| A | 0 | 226 | 7812 | 42.97 | 808 | 793 | 163.3 |
| B | 7 | 202 | 3603056 | 25169.55 | 759 | 745 | 143.1 |
| B | 4 | 48 | 1073806 | 7497.54 | 759 | 745 | 143.1 |
| B | 0 | 214 | 15906 | 105.93 | 759 | 745 | 143.1 |
| C | 13 | 61 | 5887 | 28.51 | 775 | 780 | 179.1 |
| C | 9 | 54 | 4598 | 21.31 | 775 | 780 | 179.1 |
| C | 3 | 202 | 1872 | 6.09 | 775 | 780 | 179.1 |
| D | 8 | 195 | 363444 | 1910.41 | 778 | 759 | 189.8 |
| D | 1 | 52 | 80567 | 420.38 | 778 | 759 | 189.8 |
| D | 7 | 71 | 67575 | 351.94 | 778 | 759 | 189.8 |
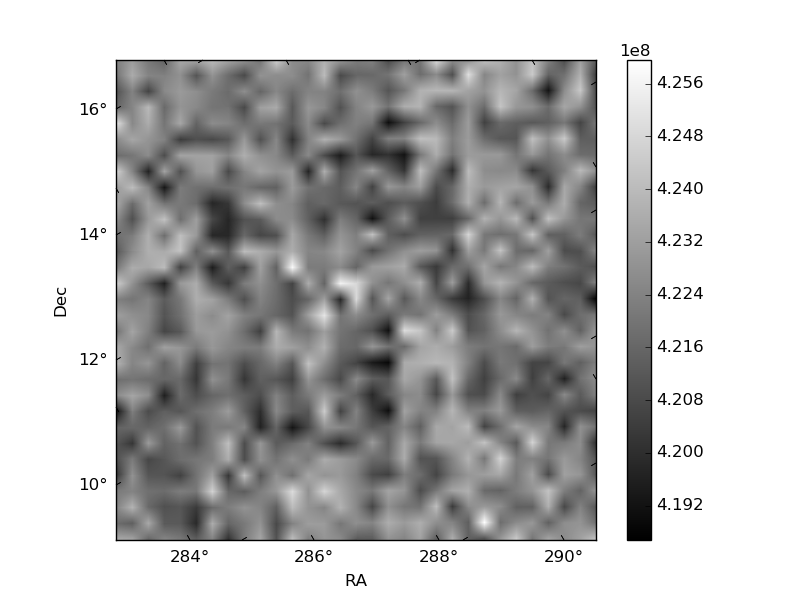
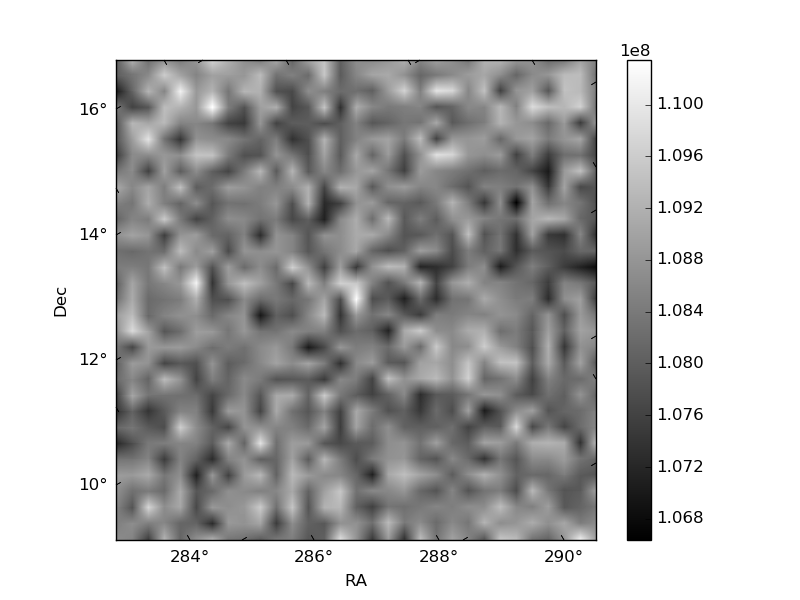
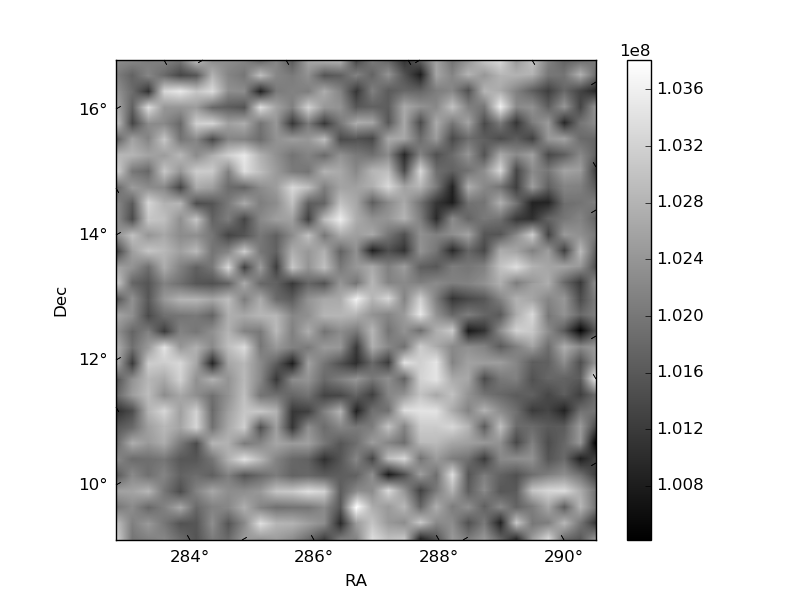
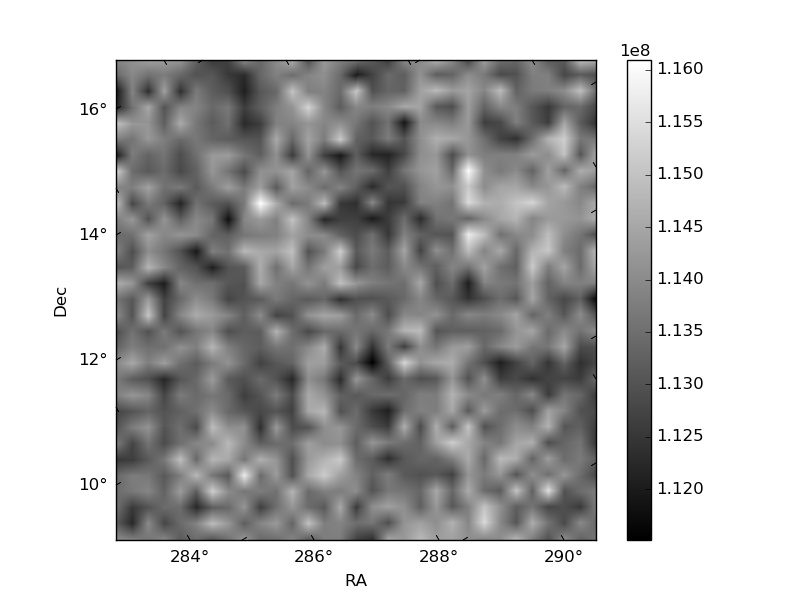
Histogram calculated using DETX and DETY for each event in the final _common_clean file
| Quadrant A | 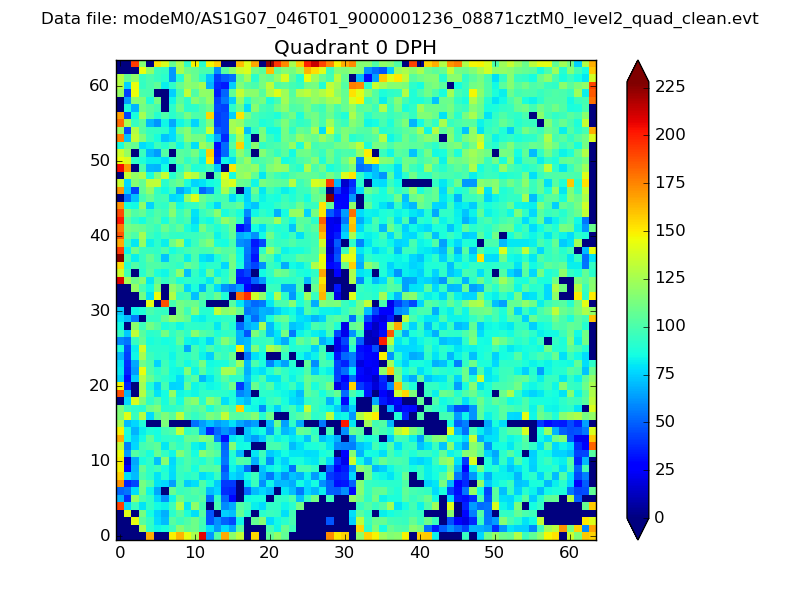 |
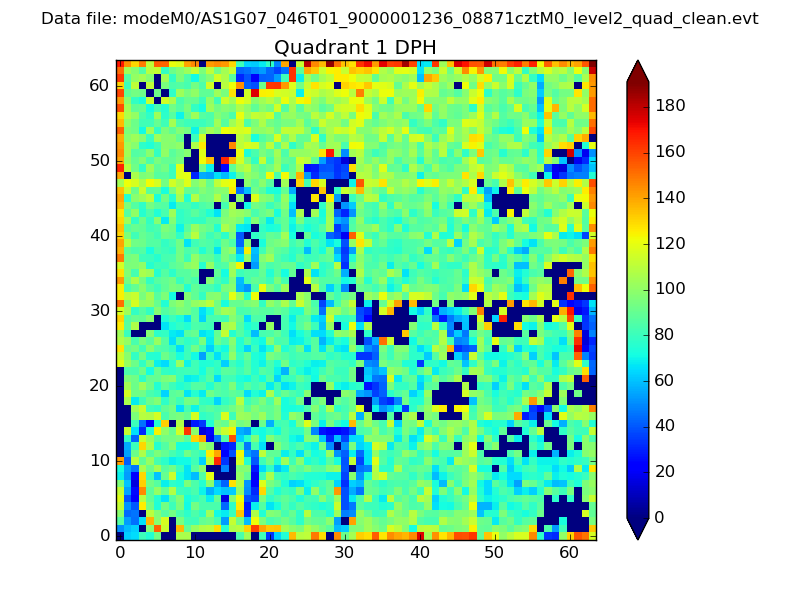 |
Quadrant B |
|---|---|---|---|
| Quadrant D | 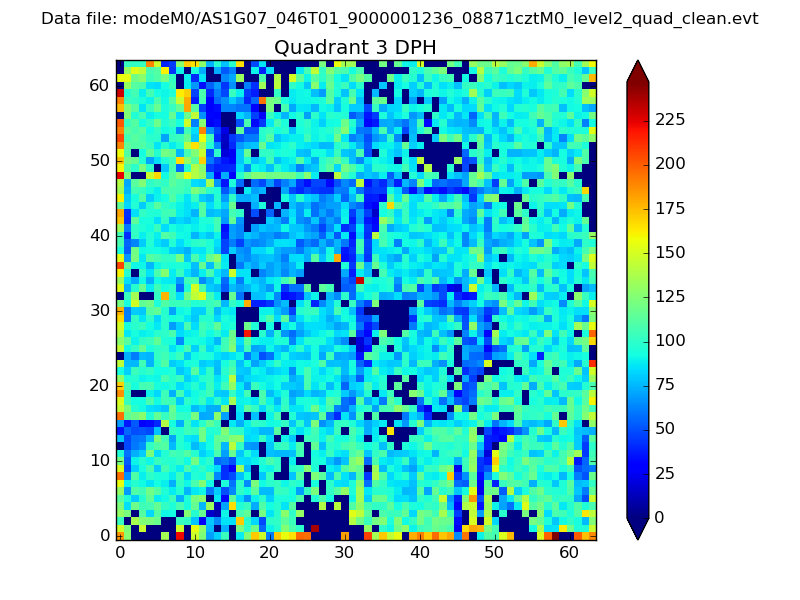 |
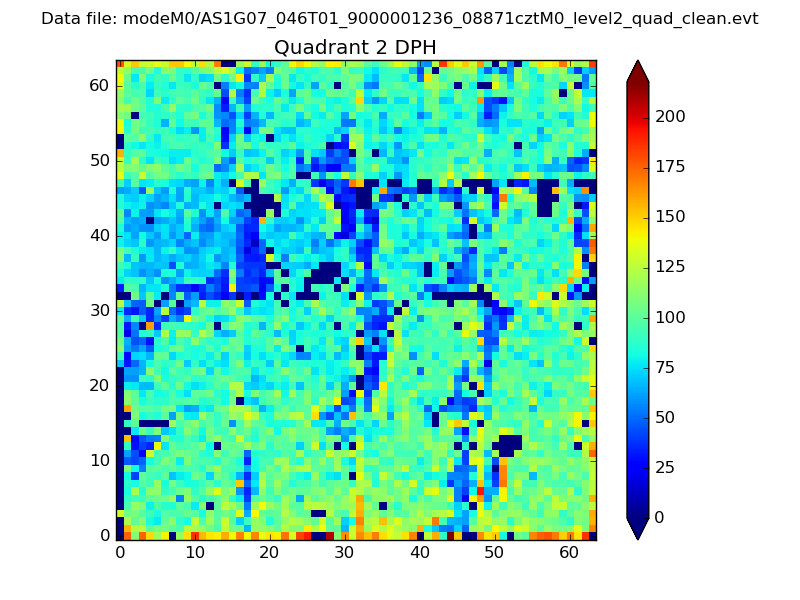 |
Quadrant C |
| Plot type | Count rate plots | Images |
|---|---|---|
| Comparison with Poisson distribution Blue bars denote a histogram of data divided into 1 sec bins. Red curve is a Poisson curve with rate = median count rate of data. |
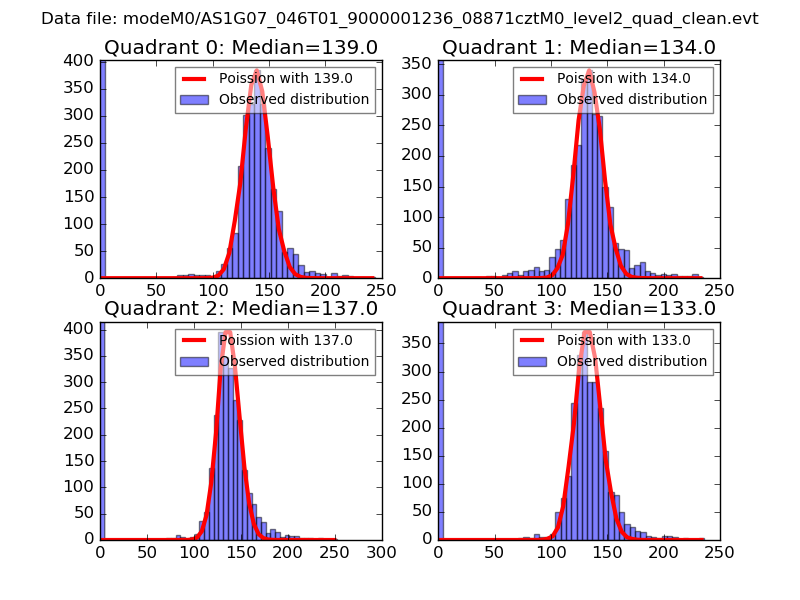 |
 |
| Quadrant-wise count rates Data is divided into 100 sec bins |
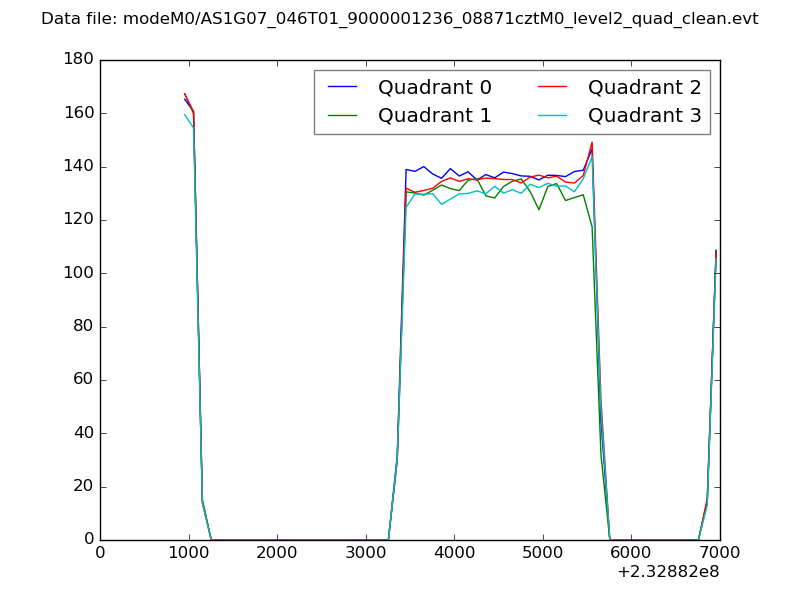 |
|
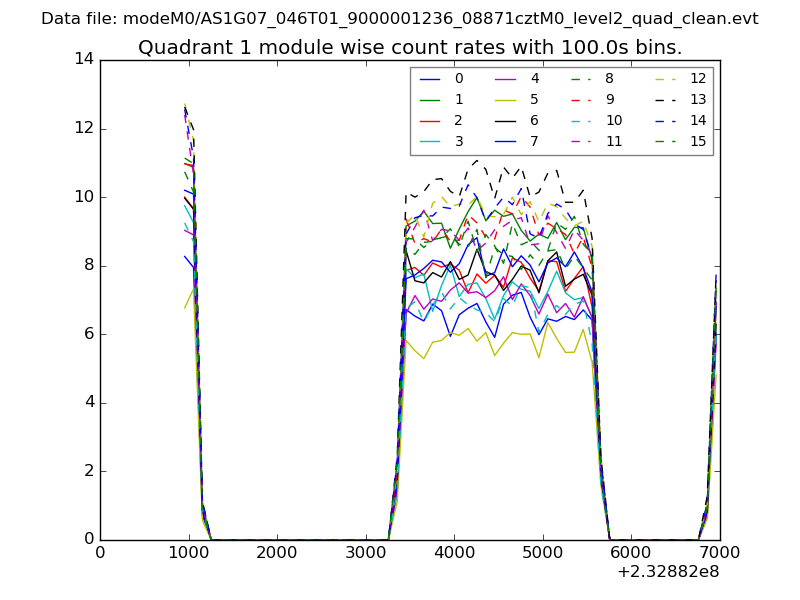
| Module-wise count rates for Quadrant A Data is divided into 100 sec bins |
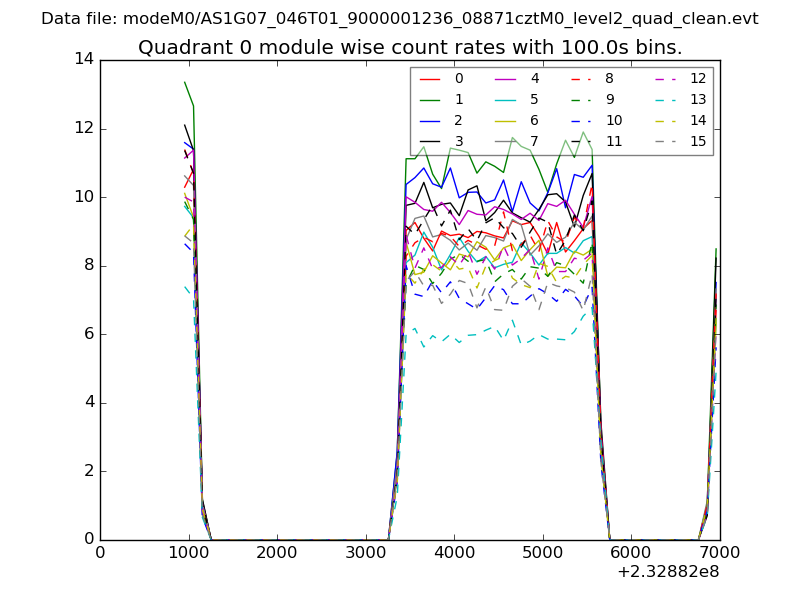 |
 |
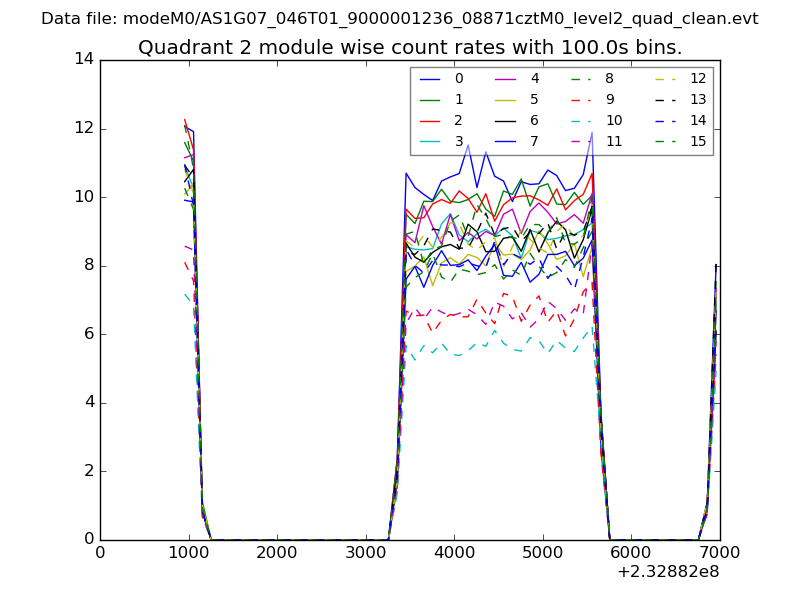
| Module-wise count rates for Quadrant B Data is divided into 100 sec bins |
 |
 |
| Module-wise count rates for Quadrant C Data is divided into 100 sec bins |
 |
 |
| Module-wise count rates for Quadrant D Data is divided into 100 sec bins |
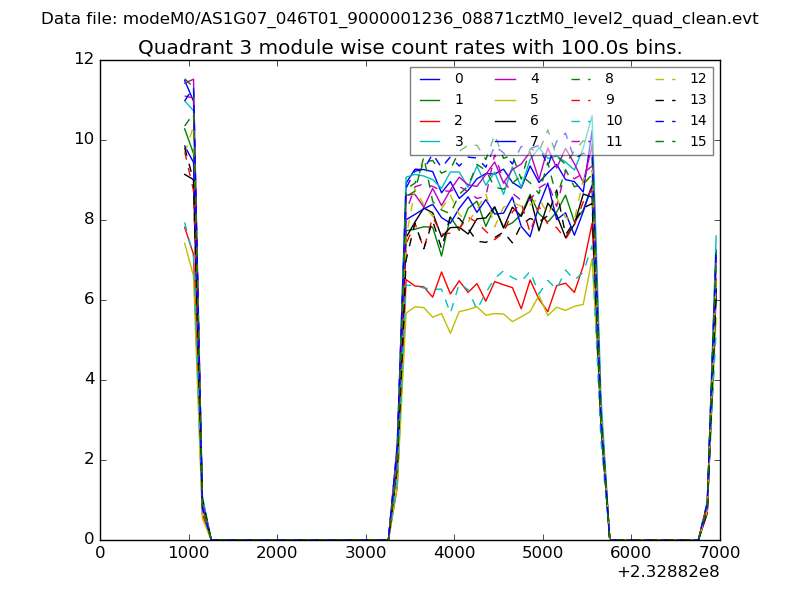 |
 |
| Parameter | Plot |
|---|---|
| CZT HV Monitor | 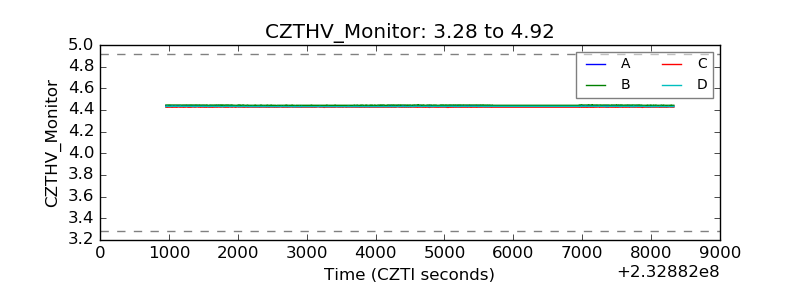 |
| D_VDD | 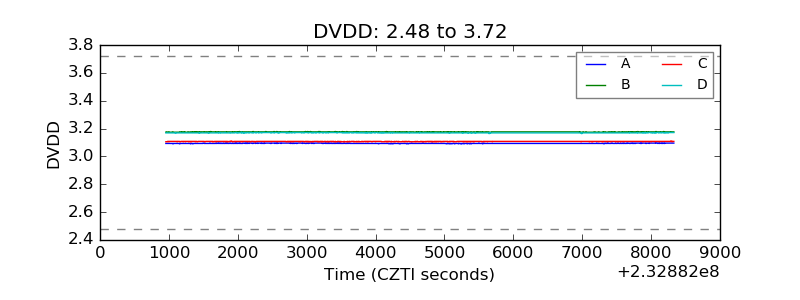 |
| Temperature 1 | 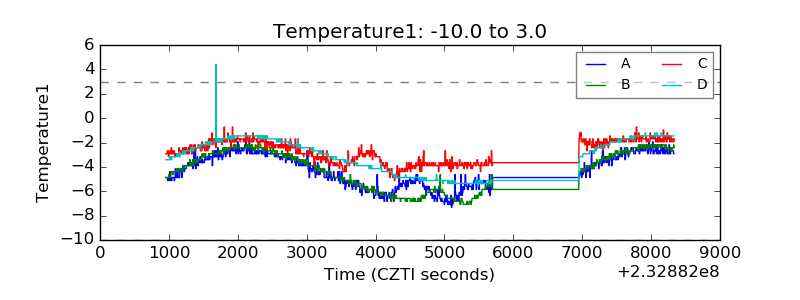 |
| Veto HV Monitor | 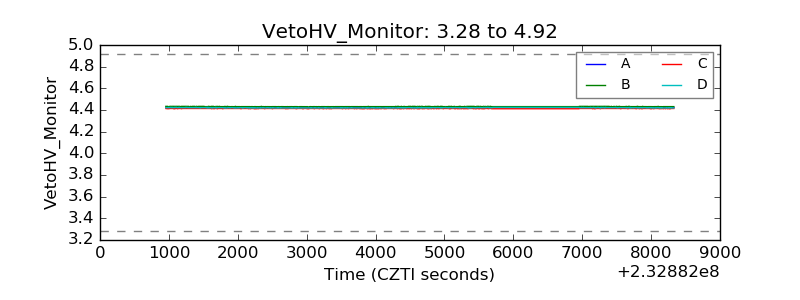 |
| Veto LLD | 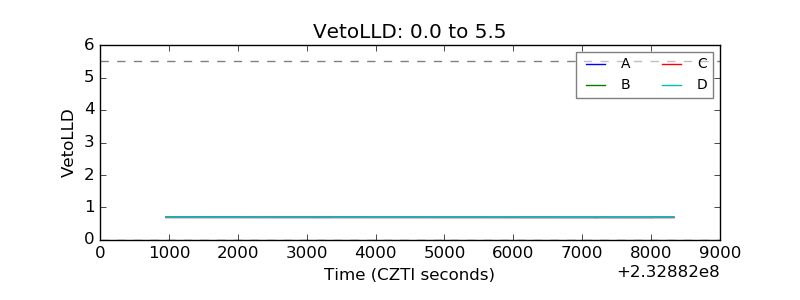 |
| Alpha Counter | 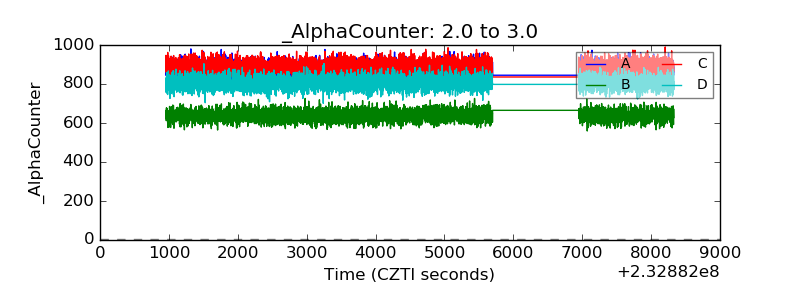 |
| _CPM_Rate | 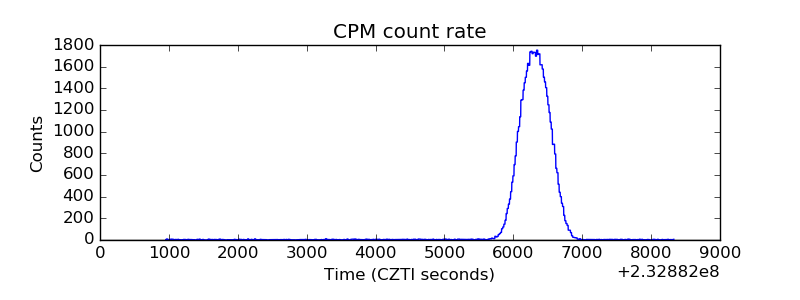 |
| CZT Counter | 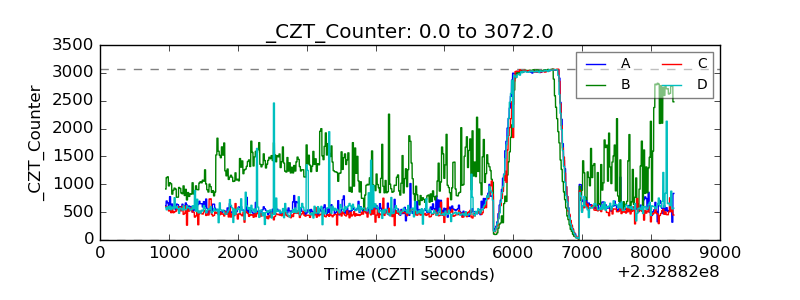 |
| +2.5 Volts monitor | 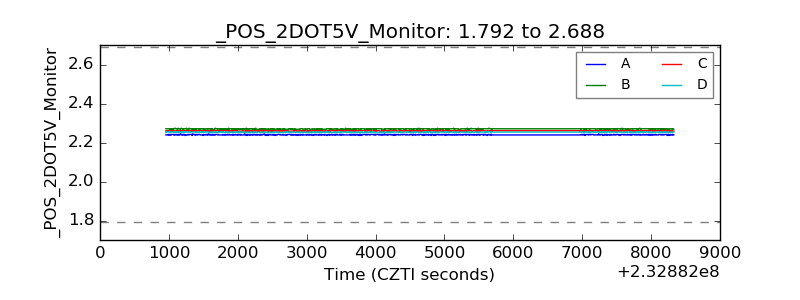 |
| +5 Volts monitor |  |
| _ROLL_ROT | 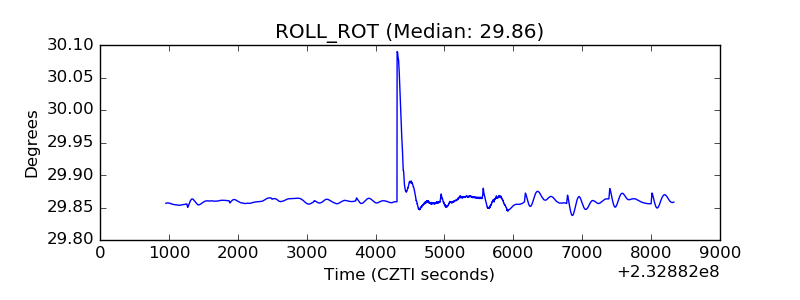 |
| _Roll_DEC | 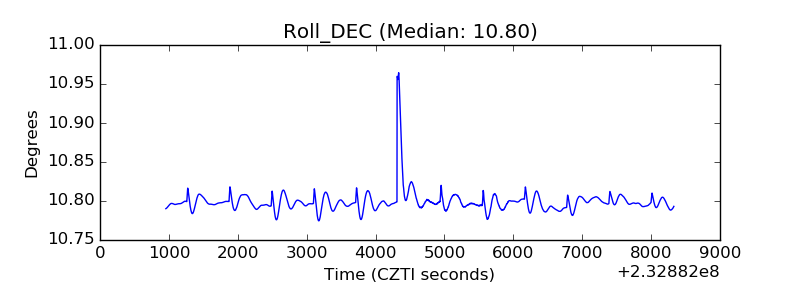 |
| _Roll_RA | 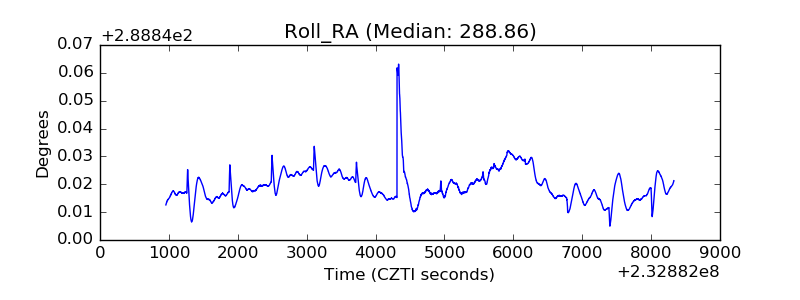 |
| Veto Counter | 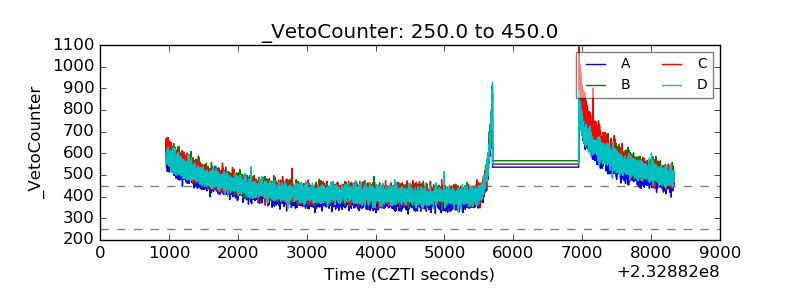 |