| Param | Original file | Final file |
|---|---|---|
| Filename | modeM0/AS1G07_046T01_9000001236_08872cztM0_level2.evt | modeM0/AS1G07_046T01_9000001236_08872cztM0_level2_quad_clean.evt |
| Size (bytes) | 700,787,520 | 60,180,480 |
| Size | 668.3 MB | 57.4 MB |
| Events in quadrant A | 3,947,412 | 371,032 |
| Events in quadrant B | 9,794,185 | 263,614 |
| Events in quadrant C | 3,279,723 | 375,634 |
| Events in quadrant D | 3,769,251 | 364,687 |
| Mode M9 | |||
|---|---|---|---|
| Quadrant | BADHDUFLAG | Total packets | Discarded packets |
| A | 0 | 12 | 0 |
| B | 0 | 12 | 0 |
| C | 0 | 12 | 0 |
| D | 0 | 13 | 0 |
| Mode M0 | |||
|---|---|---|---|
| Quadrant | BADHDUFLAG | Total packets | Discarded packets |
| A | 0 | 15952 | 3 |
| B | 0 | 33366 | 2 |
| C | 0 | 13498 | 2 |
| D | 0 | 15360 | 2 |
| Mode SS | |||
|---|---|---|---|
| Quadrant | BADHDUFLAG | Total packets | Discarded packets |
| A | 0 | 132 | 0 |
| B | 0 | 132 | 0 |
| C | 0 | 132 | 0 |
| D | 0 | 132 | 0 |
| Quadrant | Total seconds | Saturated seconds | Saturation percentage |
|---|---|---|---|
| A | 6386 | 213 | 3.335421% |
| B | 6386 | 2920 | 45.725023% |
| C | 6386 | 75 | 1.174444% |
| D | 6386 | 106 | 1.659881% |
Noise dominated data is calculated using 1-second bins in cleaned event files. If a bin has >2000 counts, and if more than 50% of those come from <1% of pixels, then it is considered to be noise-dominated and hence unusable.
| Quadrant | # 1 sec bins | Bins with >0 counts | Bins with >2000 counts | High rate bins dominated by noise | Noise dominated (total time) | Noise dominated (detector-on time) | Marked lightcurve |
|---|---|---|---|---|---|---|---|
| A | 7671 | 6386 | 99 | 99 | 1.29% | 1.55% | 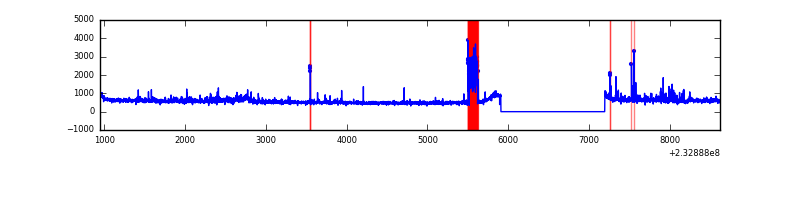 |
| B | 7671 | 6386 | 2657 | 2657 | 34.64% | 41.61% | 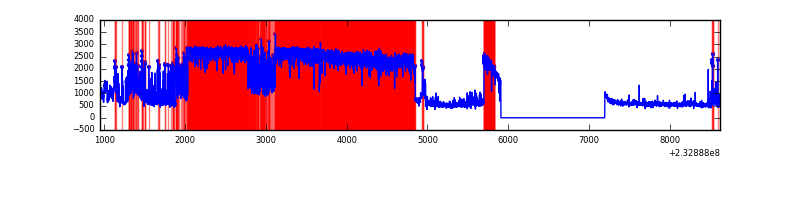 |
| C | 7671 | 6386 | 0 | 0 | 0.00% | 0.00% | 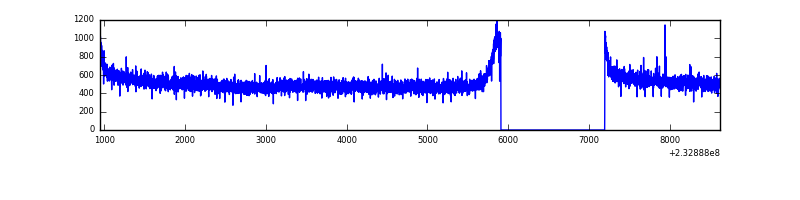 |
| D | 7671 | 6386 | 26 | 26 | 0.34% | 0.41% | 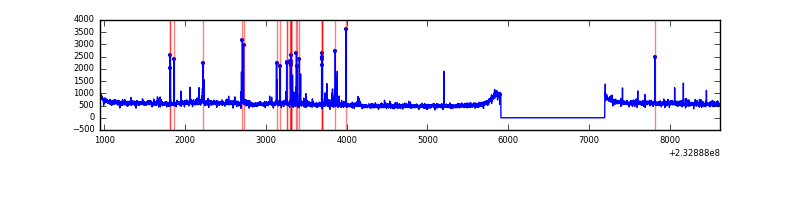 |
Top three noisy pixels from each quadrant. If the there are fewer than three noisy pixels in the level2.evt file, extra rows are filled as -1
| Pixel properties | Quadrant properties | ||||||
|---|---|---|---|---|---|---|---|
| Quadrant | DetID | PixID | Counts | Sigma | Mean | Median | Sigma |
| A | 8 | 5 | 351101 | 2009.72 | 864 | 846 | 174.3 |
| A | 15 | 174 | 261118 | 1493.41 | 864 | 846 | 174.3 |
| A | 5 | 16 | 9218 | 48.04 | 864 | 846 | 174.3 |
| B | 7 | 202 | 6750045 | 51681.65 | 695 | 681 | 130.6 |
| B | 4 | 48 | 286711 | 2190.21 | 695 | 681 | 130.6 |
| B | 0 | 213 | 44544 | 335.87 | 695 | 681 | 130.6 |
| C | 13 | 61 | 6494 | 29.36 | 839 | 846 | 192.4 |
| C | 10 | 22 | 3998 | 16.38 | 839 | 846 | 192.4 |
| C | 3 | 254 | 2569 | 8.96 | 839 | 846 | 192.4 |
| D | 8 | 195 | 369936 | 1790.59 | 841 | 821 | 206.1 |
| D | 7 | 71 | 97074 | 466.93 | 841 | 821 | 206.1 |
| D | 2 | 14 | 40825 | 194.06 | 841 | 821 | 206.1 |
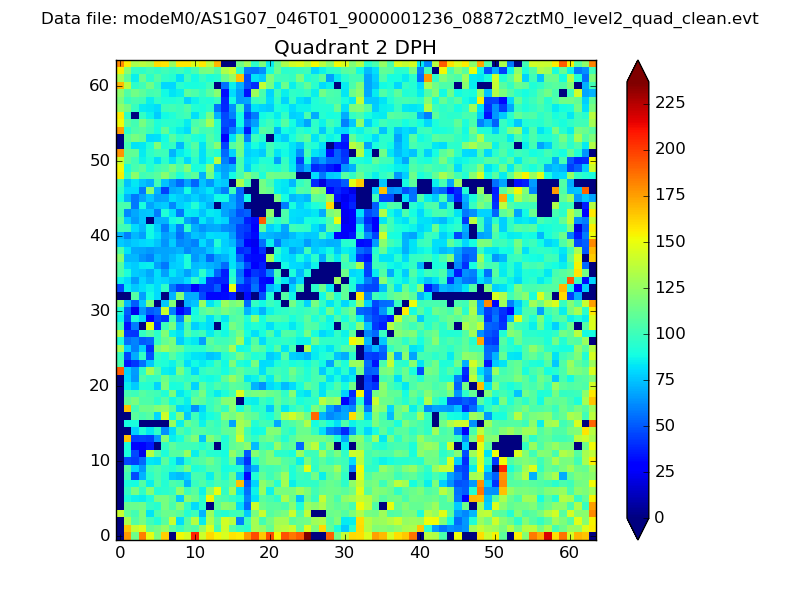
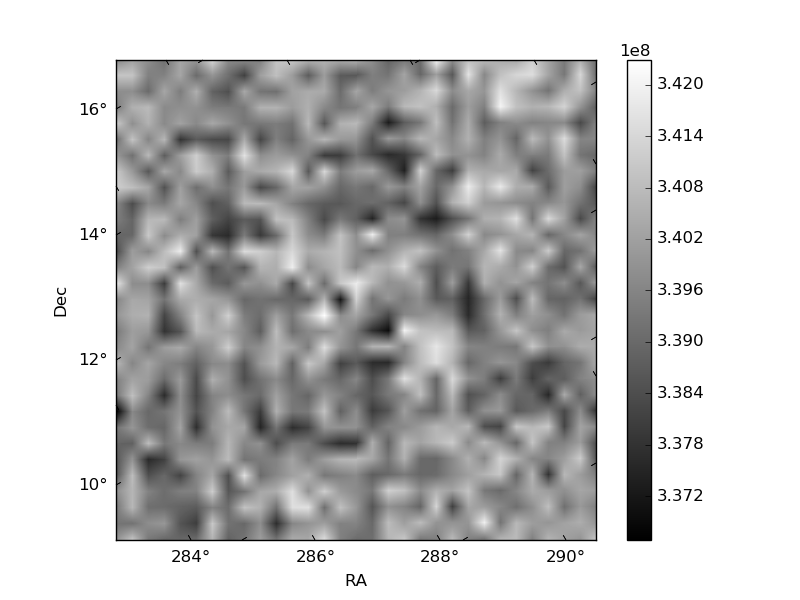
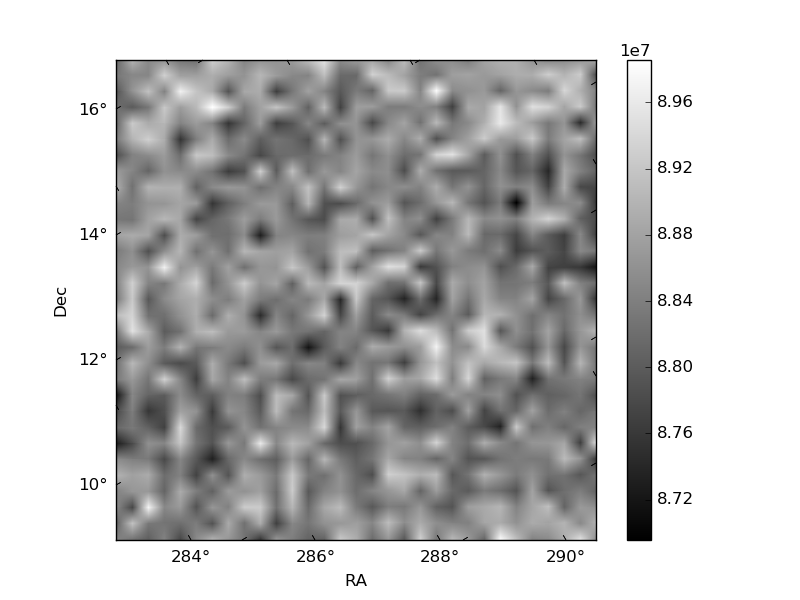
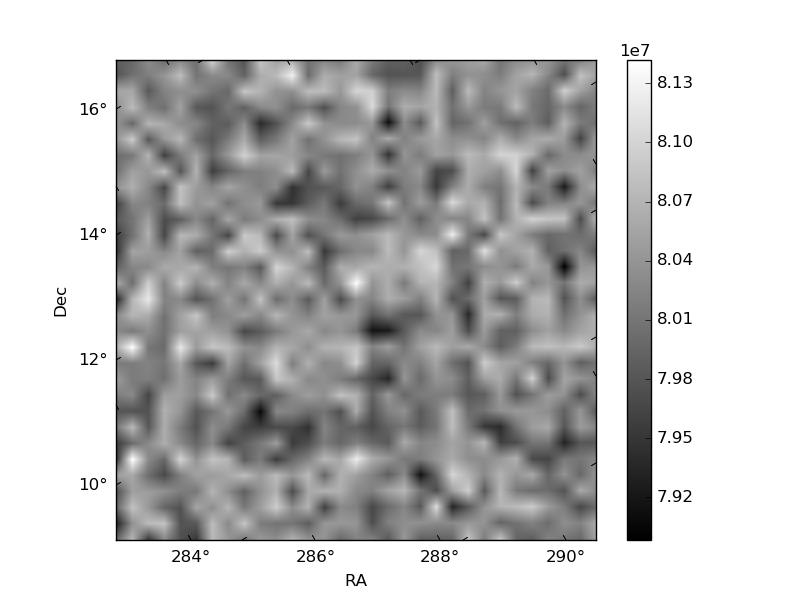
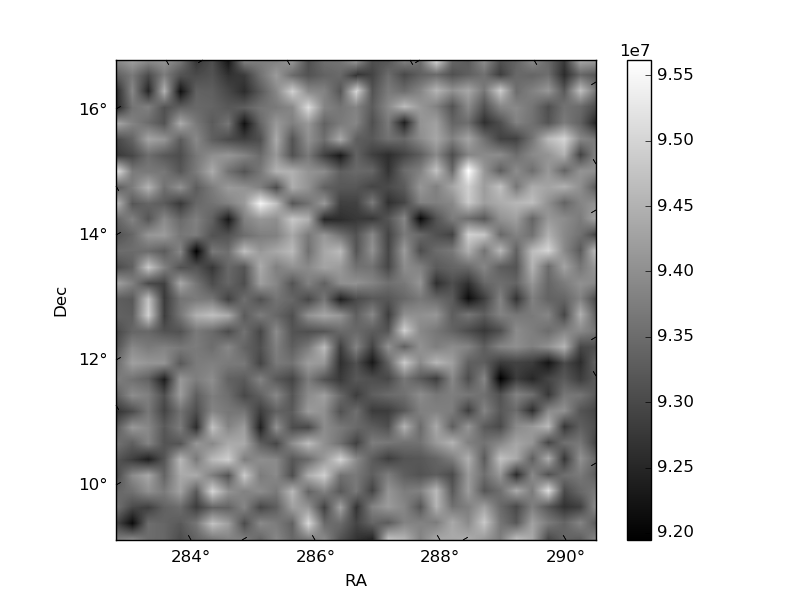
Histogram calculated using DETX and DETY for each event in the final _common_clean file
| Quadrant A | 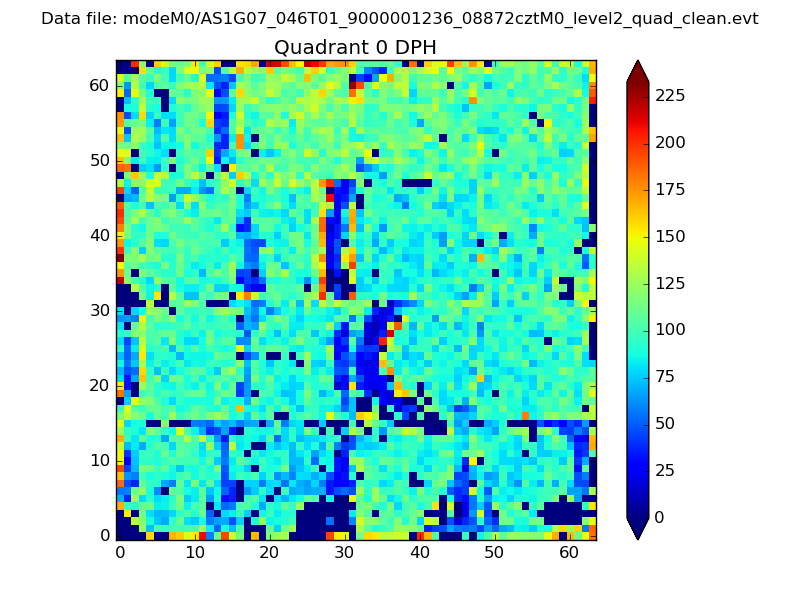 |
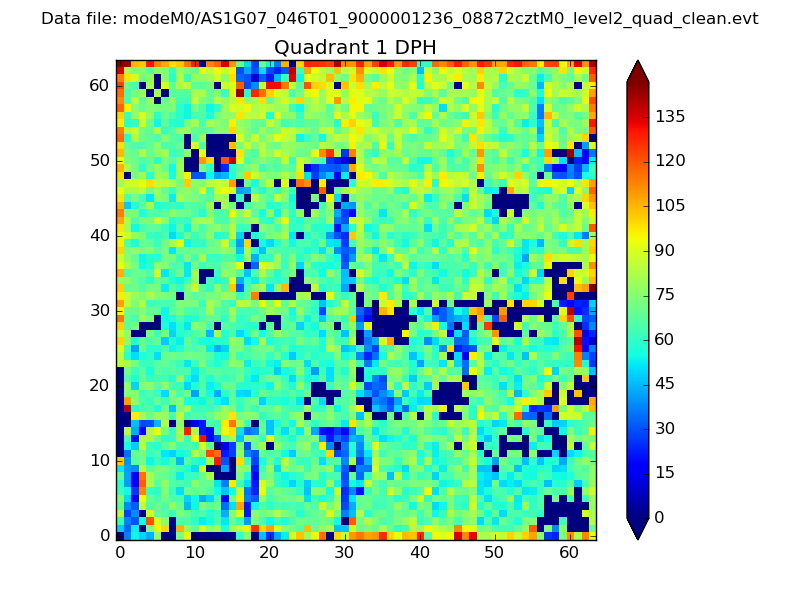 |
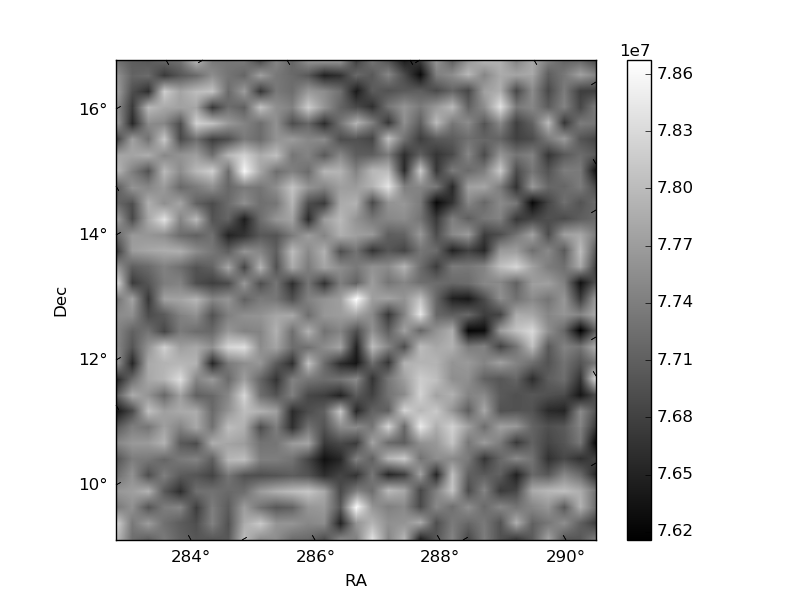
Quadrant B |
|---|---|---|---|
| Quadrant D | 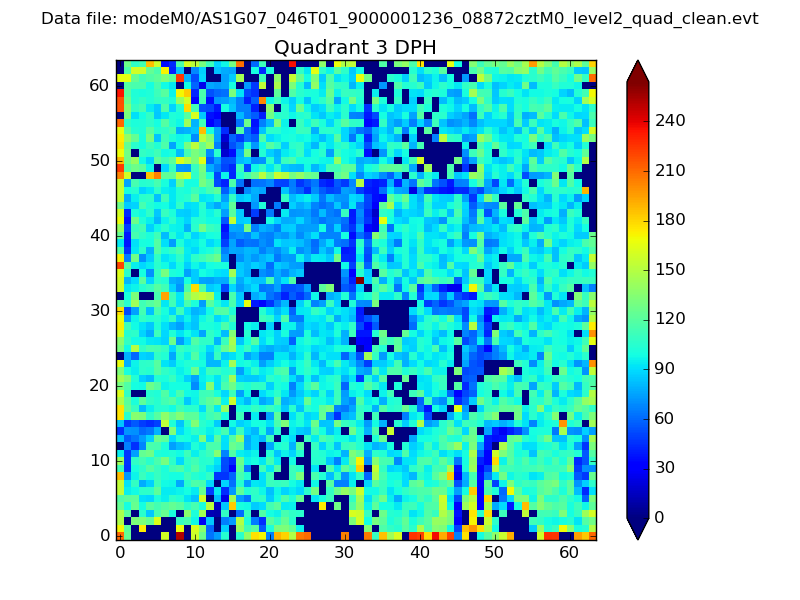 |
 |
Quadrant C |
| Plot type | Count rate plots | Images |
|---|---|---|
| Comparison with Poisson distribution Blue bars denote a histogram of data divided into 1 sec bins. Red curve is a Poisson curve with rate = median count rate of data. |
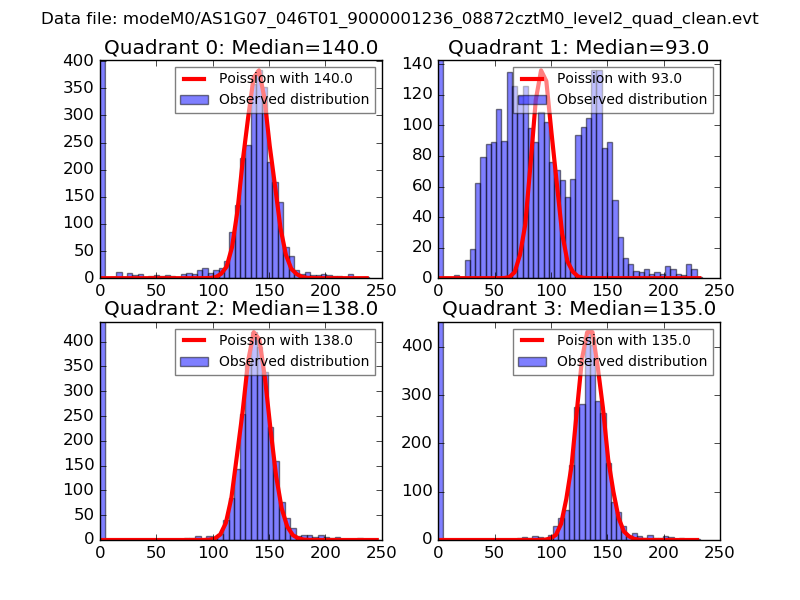 |
 |
| Quadrant-wise count rates Data is divided into 100 sec bins |
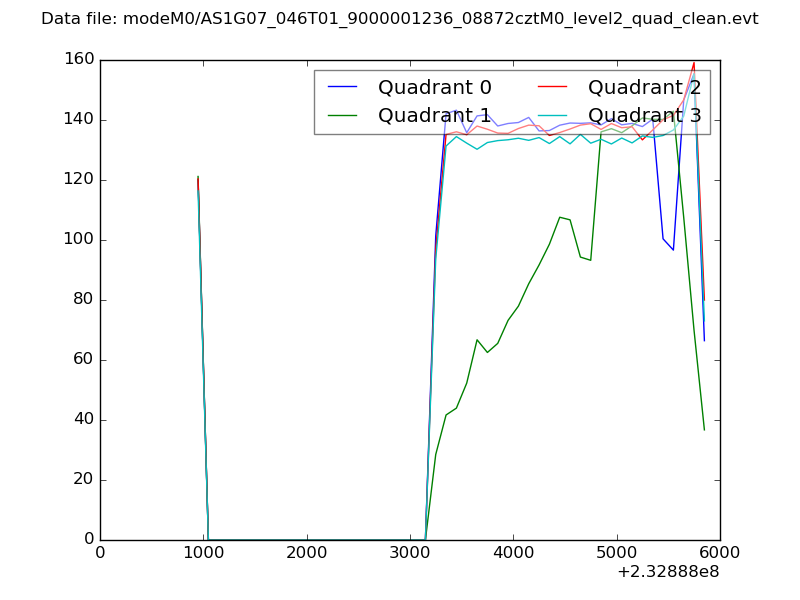 |
|
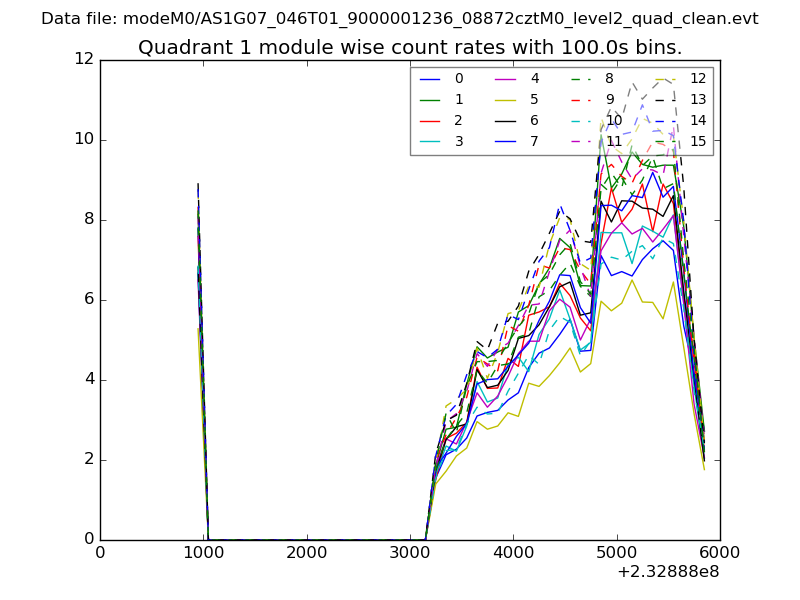
| Module-wise count rates for Quadrant A Data is divided into 100 sec bins |
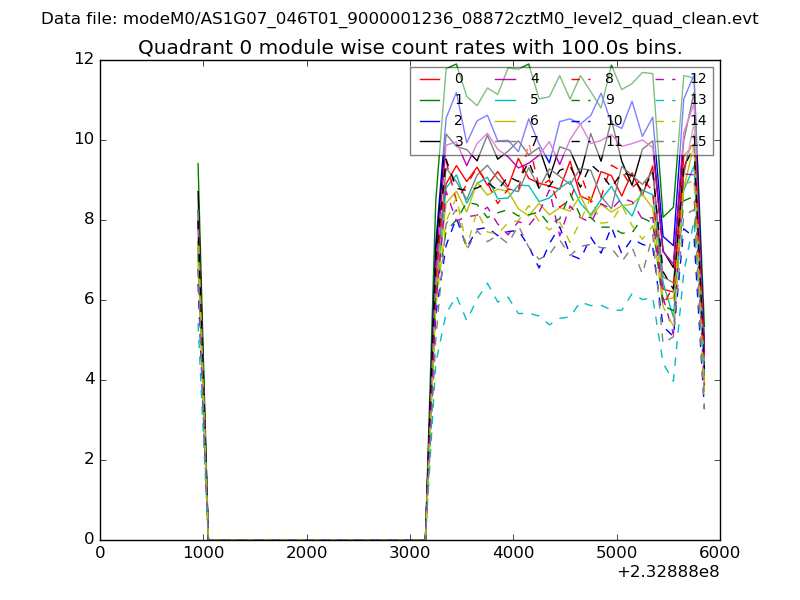 |
 |
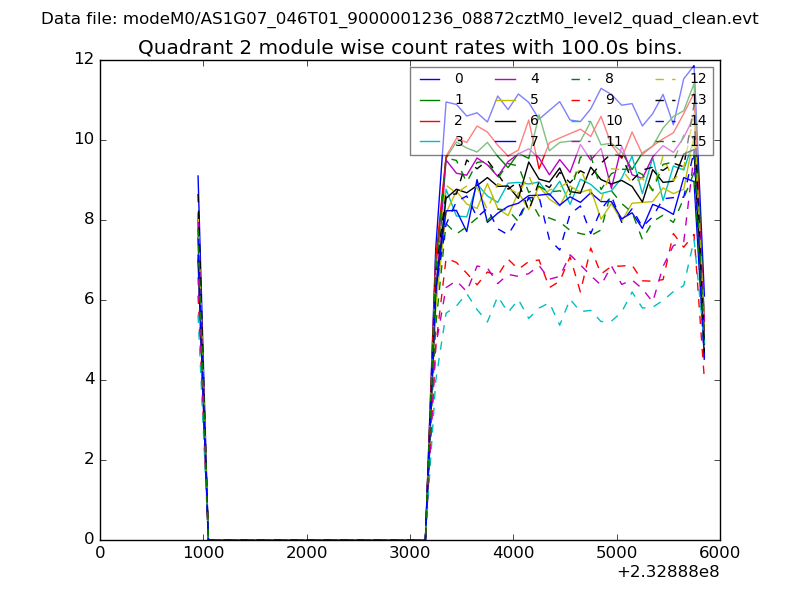
| Module-wise count rates for Quadrant B Data is divided into 100 sec bins |
 |
 |
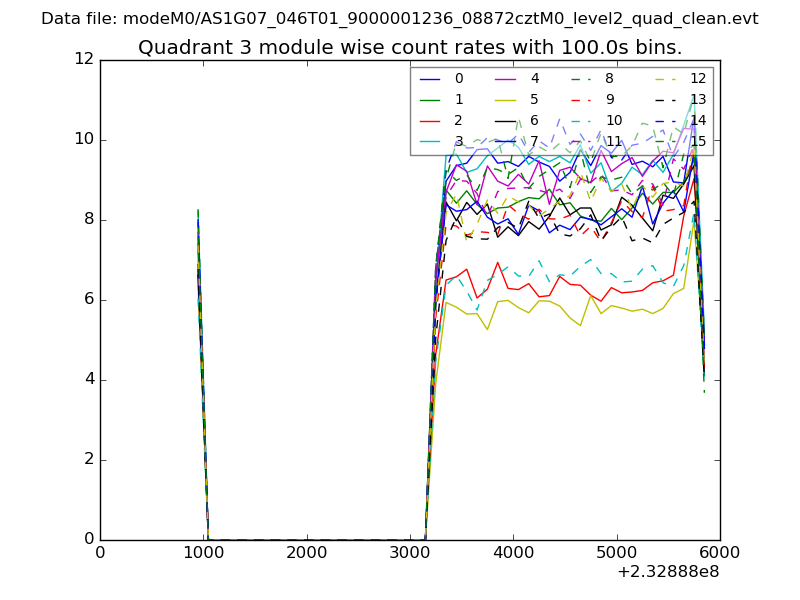
| Module-wise count rates for Quadrant C Data is divided into 100 sec bins |
 |
 |
| Module-wise count rates for Quadrant D Data is divided into 100 sec bins |
 |
 |
| Parameter | Plot |
|---|---|
| CZT HV Monitor | 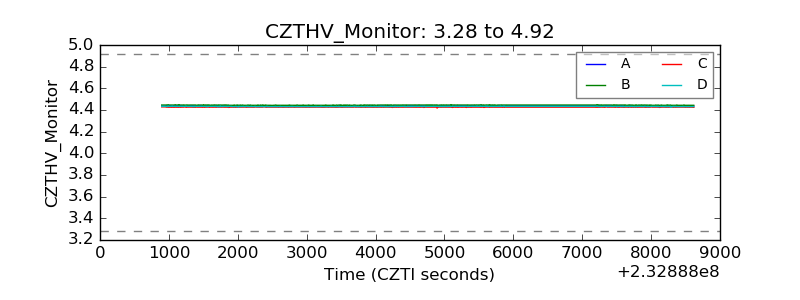 |
| D_VDD | 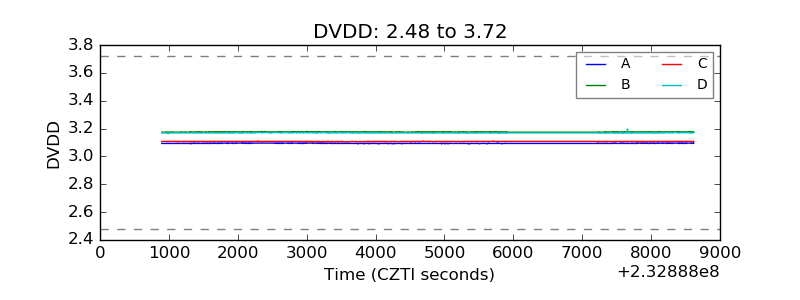 |
| Temperature 1 | 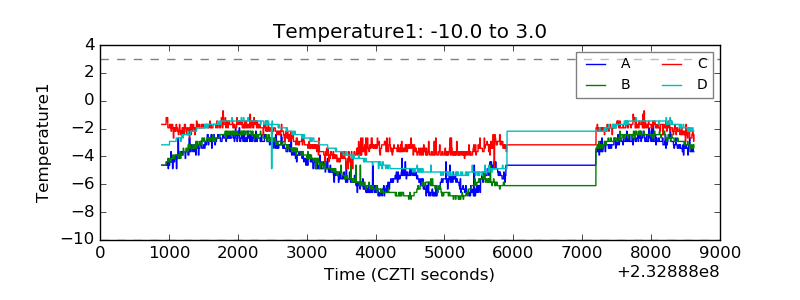 |
| Veto HV Monitor | 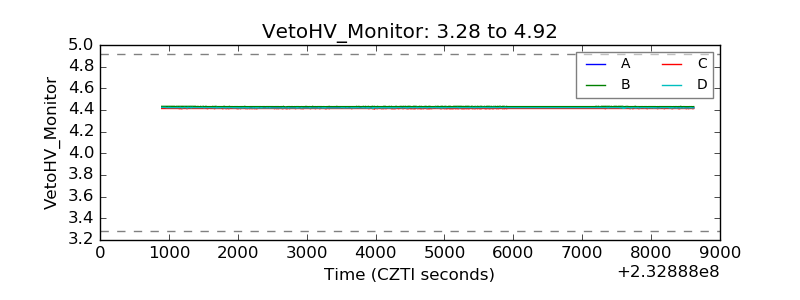 |
| Veto LLD | 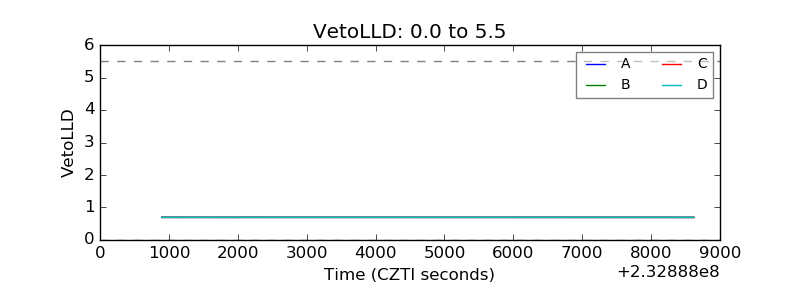 |
| Alpha Counter | 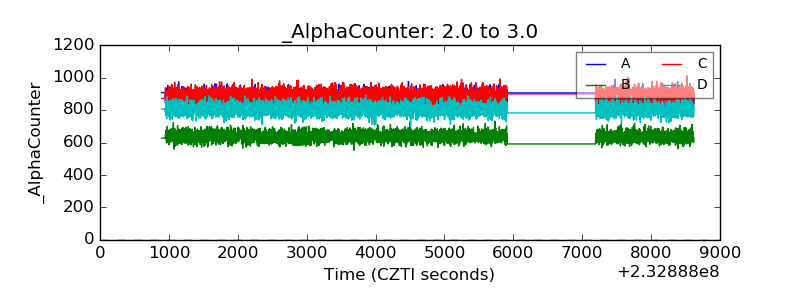 |
| _CPM_Rate | 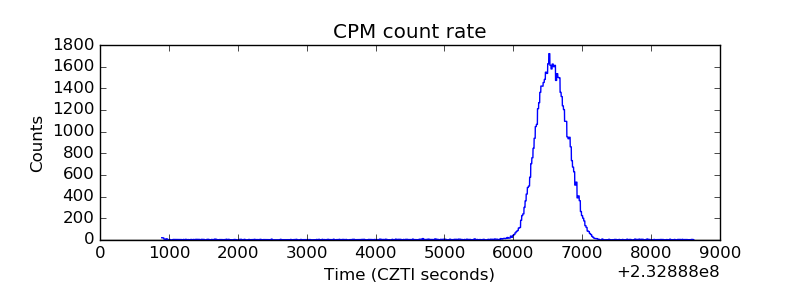 |
| CZT Counter | 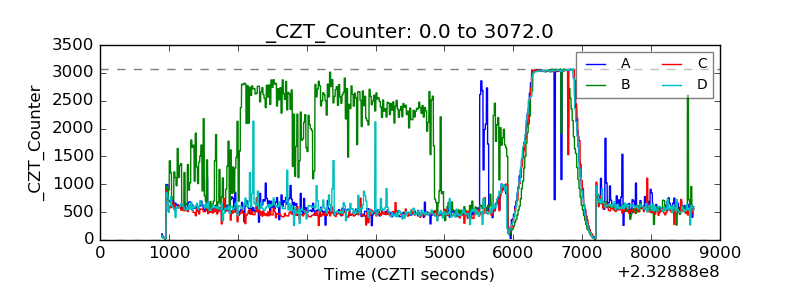 |
| +2.5 Volts monitor |  |
| +5 Volts monitor | 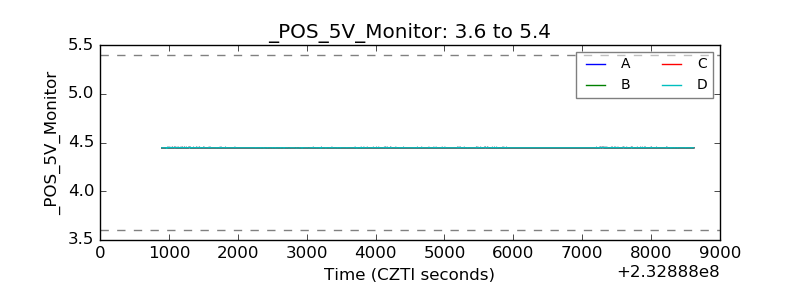 |
| _ROLL_ROT | 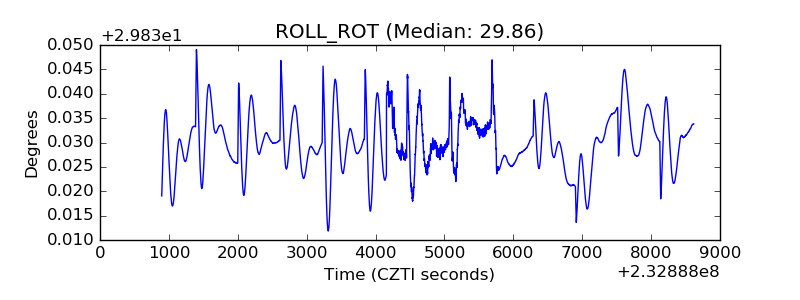 |
| _Roll_DEC | 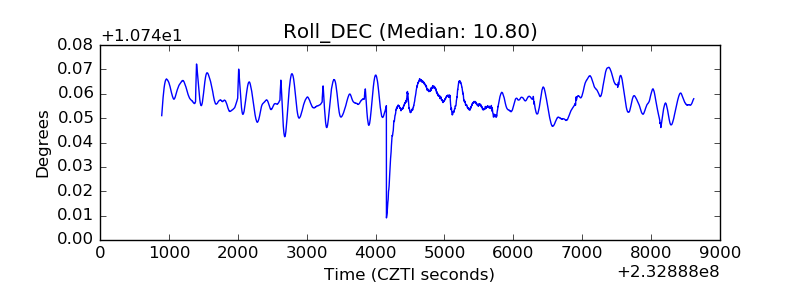 |
| _Roll_RA | 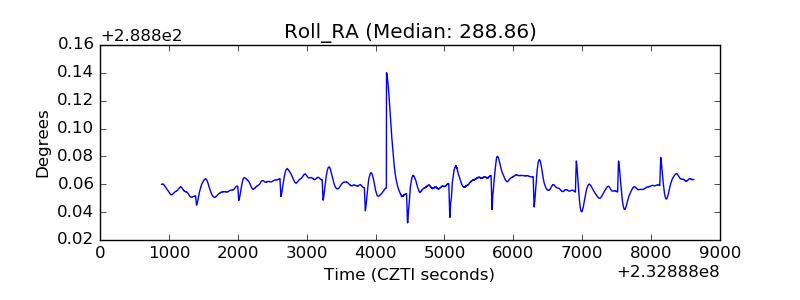 |
| Veto Counter | 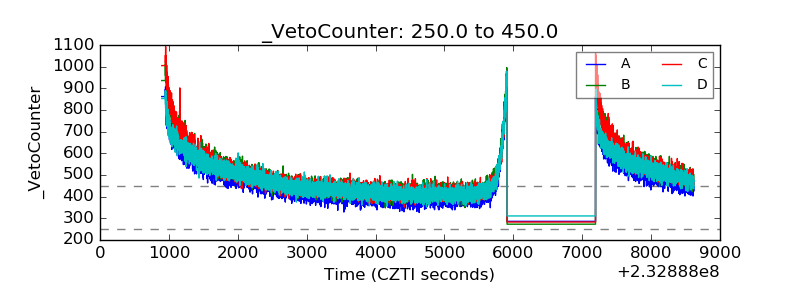 |