| Param | Original file | Final file |
|---|---|---|
| Filename | modeM0/AS1G07_046T01_9000001236_08873cztM0_level2.evt | modeM0/AS1G07_046T01_9000001236_08873cztM0_level2_quad_clean.evt |
| Size (bytes) | 480,159,360 | 69,992,640 |
| Size | 457.9 MB | 66.8 MB |
| Events in quadrant A | 3,726,692 | 423,972 |
| Events in quadrant B | 3,361,735 | 426,404 |
| Events in quadrant C | 3,208,244 | 421,796 |
| Events in quadrant D | 3,818,761 | 408,887 |
| Mode M9 | |||
|---|---|---|---|
| Quadrant | BADHDUFLAG | Total packets | Discarded packets |
| A | 0 | 20 | 0 |
| B | 0 | 20 | 0 |
| C | 0 | 20 | 0 |
| D | 0 | 21 | 0 |
| Mode M0 | |||
|---|---|---|---|
| Quadrant | BADHDUFLAG | Total packets | Discarded packets |
| A | 0 | 15260 | 16 |
| B | 0 | 13777 | 9 |
| C | 0 | 13261 | 13 |
| D | 0 | 15343 | 12 |
| Mode SS | |||
|---|---|---|---|
| Quadrant | BADHDUFLAG | Total packets | Discarded packets |
| A | 0 | 128 | 0 |
| B | 0 | 128 | 0 |
| C | 0 | 128 | 0 |
| D | 0 | 128 | 0 |
| Quadrant | Total seconds | Saturated seconds | Saturation percentage |
|---|---|---|---|
| A | 6273 | 137 | 2.183963% |
| B | 6276 | 137 | 2.182919% |
| C | 6274 | 90 | 1.434492% |
| D | 6275 | 208 | 3.314741% |
Noise dominated data is calculated using 1-second bins in cleaned event files. If a bin has >2000 counts, and if more than 50% of those come from <1% of pixels, then it is considered to be noise-dominated and hence unusable.
| Quadrant | # 1 sec bins | Bins with >0 counts | Bins with >2000 counts | High rate bins dominated by noise | Noise dominated (total time) | Noise dominated (detector-on time) | Marked lightcurve |
|---|---|---|---|---|---|---|---|
| A | 7560 | 6279 | 11 | 11 | 0.15% | 0.18% | 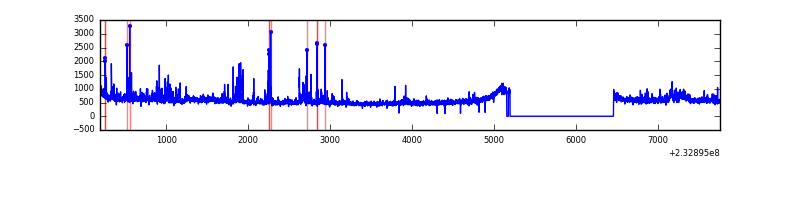 |
| B | 7560 | 6279 | 7 | 7 | 0.09% | 0.11% | 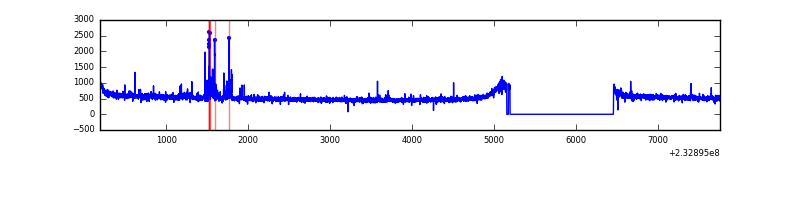 |
| C | 7560 | 6279 | 0 | 0 | 0.00% | 0.00% | 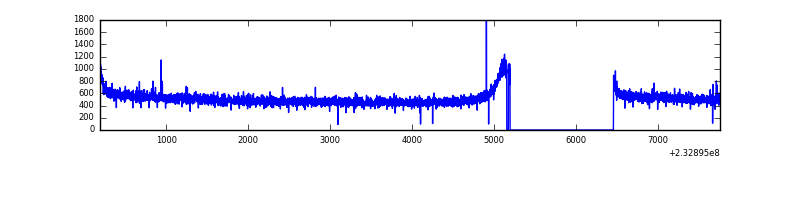 |
| D | 7560 | 6278 | 106 | 106 | 1.40% | 1.69% | 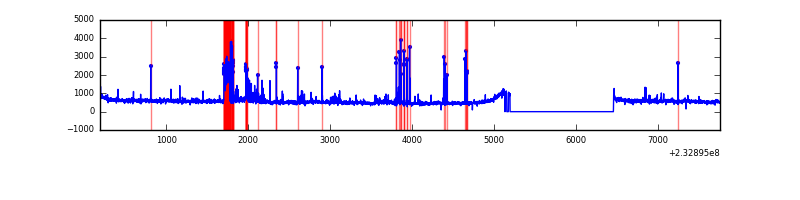 |
Top three noisy pixels from each quadrant. If the there are fewer than three noisy pixels in the level2.evt file, extra rows are filled as -1
| Pixel properties | Quadrant properties | ||||||
|---|---|---|---|---|---|---|---|
| Quadrant | DetID | PixID | Counts | Sigma | Mean | Median | Sigma |
| A | 8 | 5 | 455603 | 2631.02 | 845 | 827 | 172.9 |
| A | 0 | 226 | 8101 | 42.08 | 845 | 827 | 172.9 |
| A | 5 | 16 | 7585 | 39.1 | 845 | 827 | 172.9 |
| B | 0 | 213 | 66902 | 409.08 | 844 | 826 | 161.5 |
| B | 12 | 111 | 16635 | 97.87 | 844 | 826 | 161.5 |
| B | 0 | 214 | 14834 | 86.72 | 844 | 826 | 161.5 |
| C | 10 | 22 | 6325 | 28.99 | 820 | 827 | 189.6 |
| C | 13 | 61 | 6021 | 27.39 | 820 | 827 | 189.6 |
| C | 1 | 3 | 4825 | 21.08 | 820 | 827 | 189.6 |
| D | 8 | 195 | 267549 | 1317.87 | 815 | 796 | 202.4 |
| D | 7 | 71 | 241890 | 1191.11 | 815 | 796 | 202.4 |
| D | 1 | 52 | 135556 | 665.77 | 815 | 796 | 202.4 |
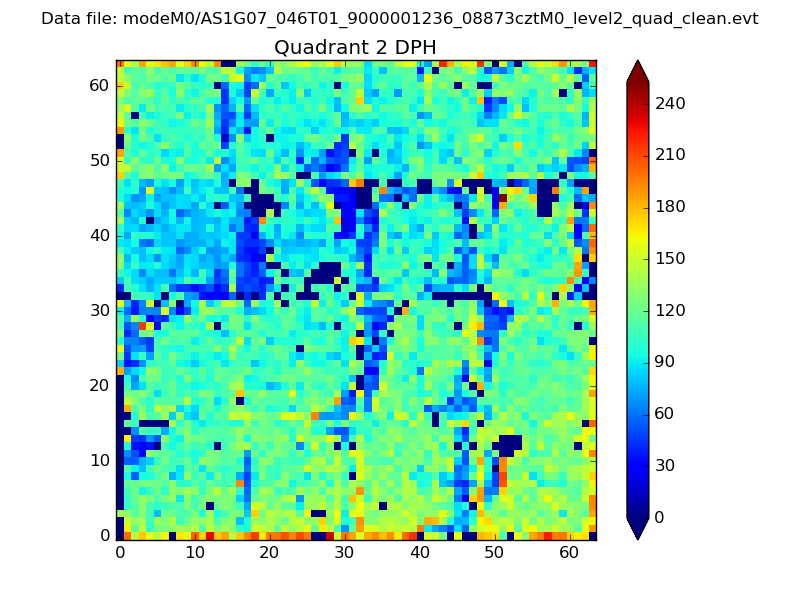
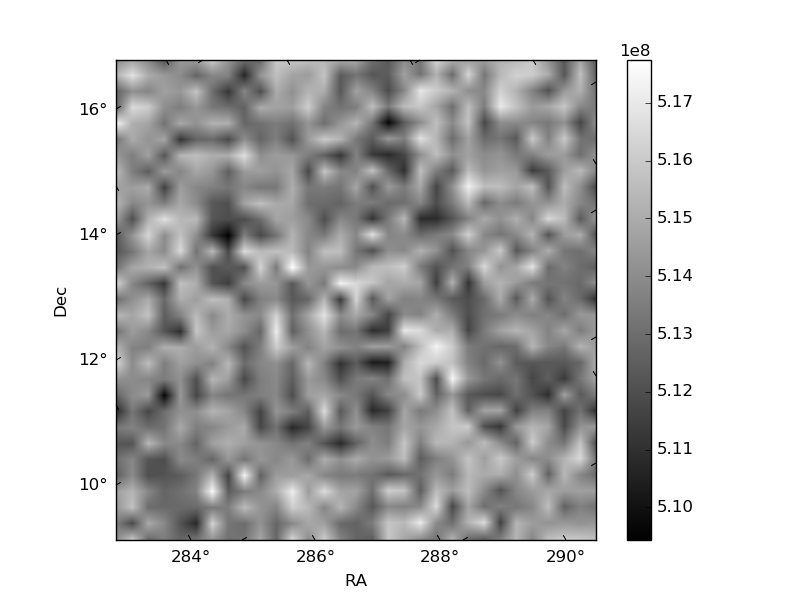
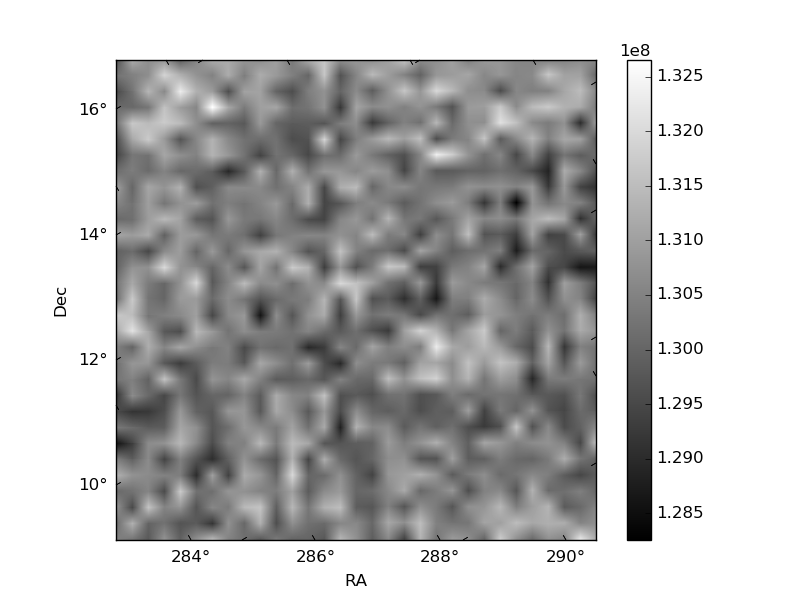
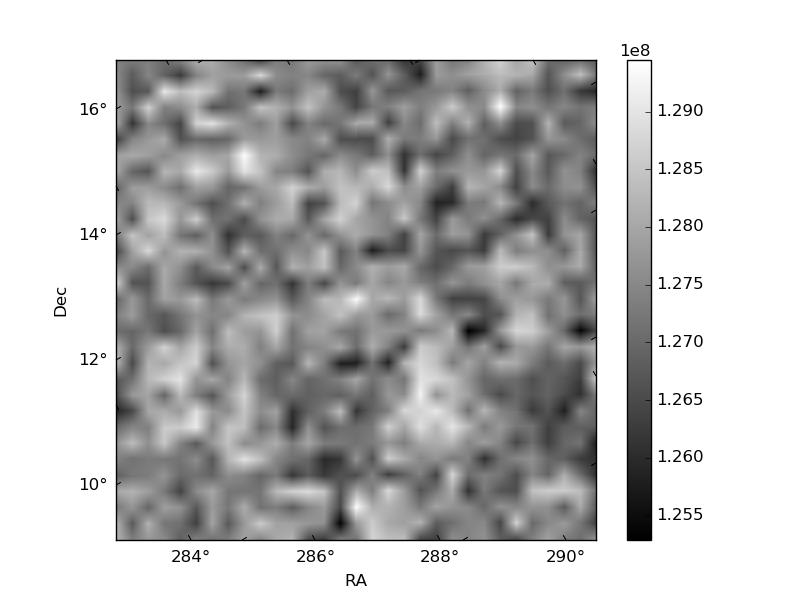
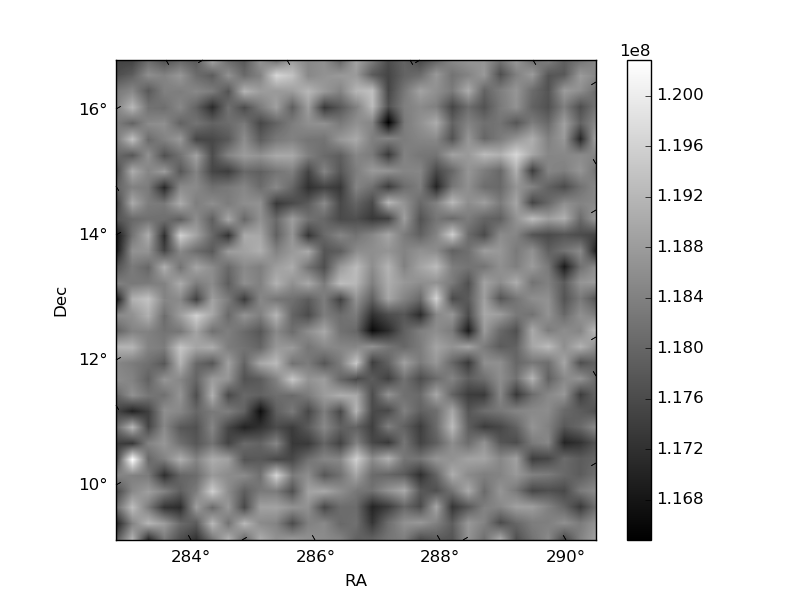
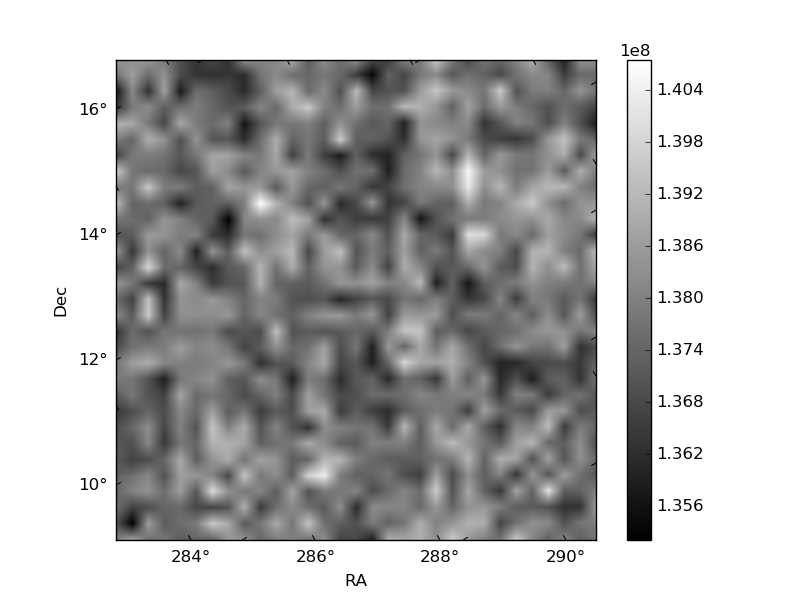
Histogram calculated using DETX and DETY for each event in the final _common_clean file
| Quadrant A | 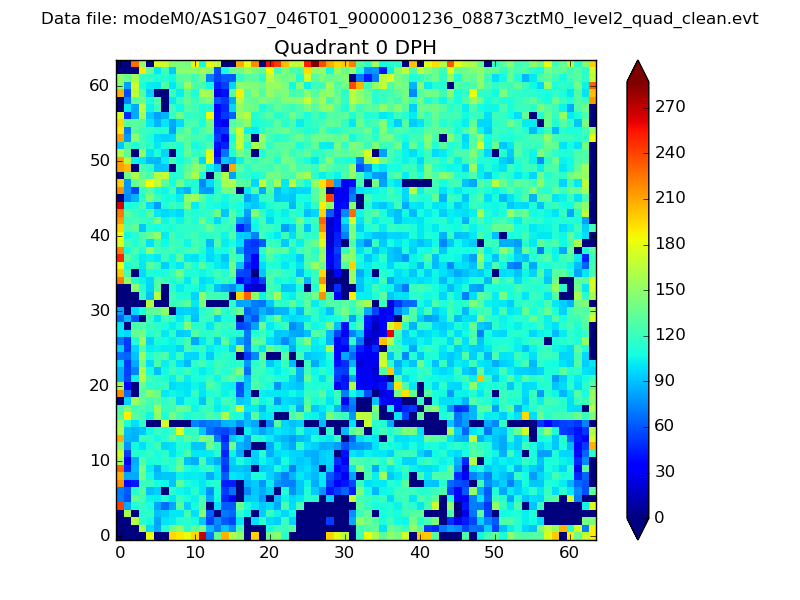 |
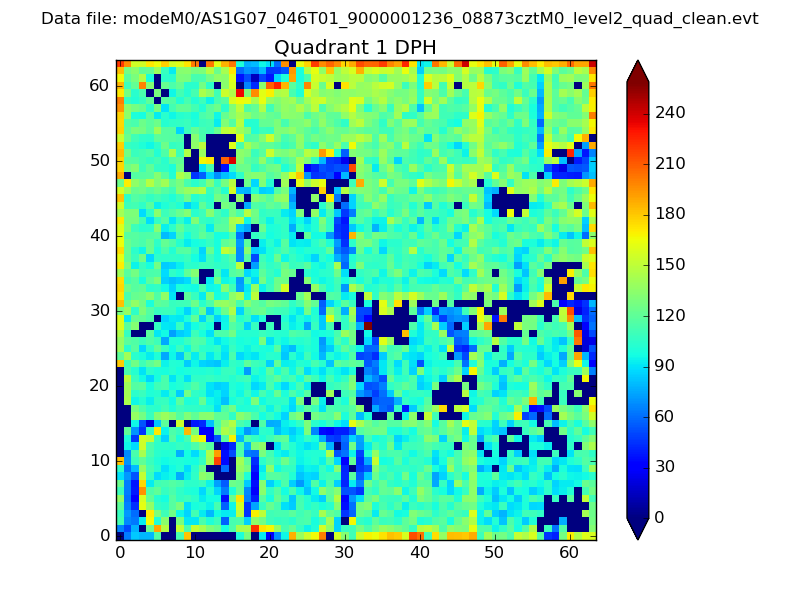 |
Quadrant B |
|---|---|---|---|
| Quadrant D | 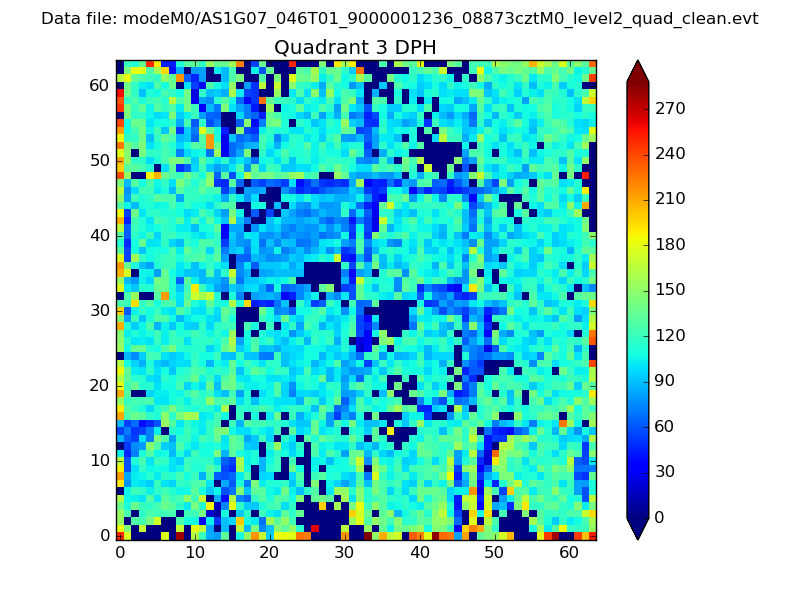 |
 |
Quadrant C |
| Plot type | Count rate plots | Images |
|---|---|---|
| Comparison with Poisson distribution Blue bars denote a histogram of data divided into 1 sec bins. Red curve is a Poisson curve with rate = median count rate of data. |
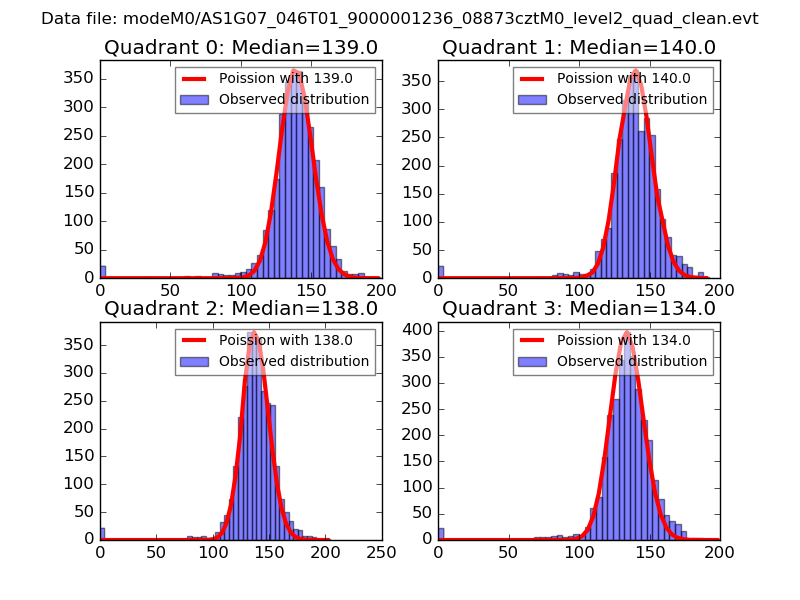 |
 |
| Quadrant-wise count rates Data is divided into 100 sec bins |
 |
|
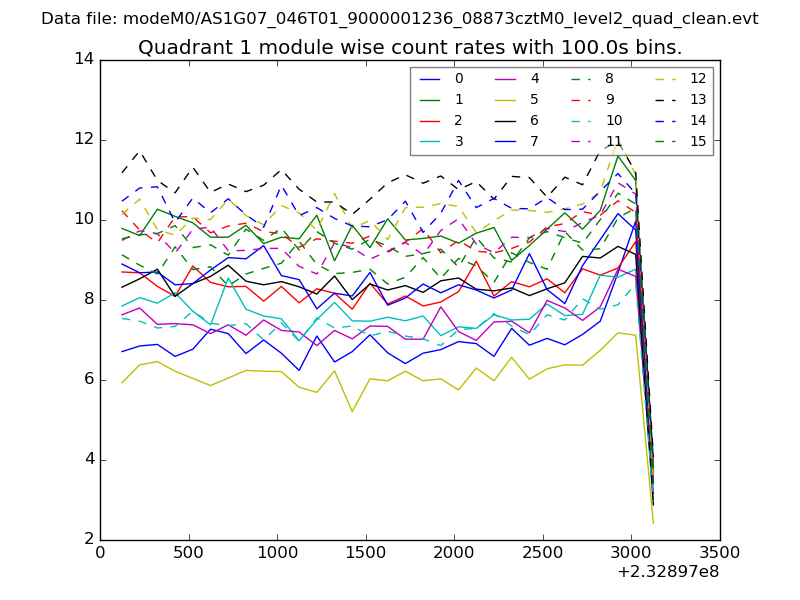
| Module-wise count rates for Quadrant A Data is divided into 100 sec bins |
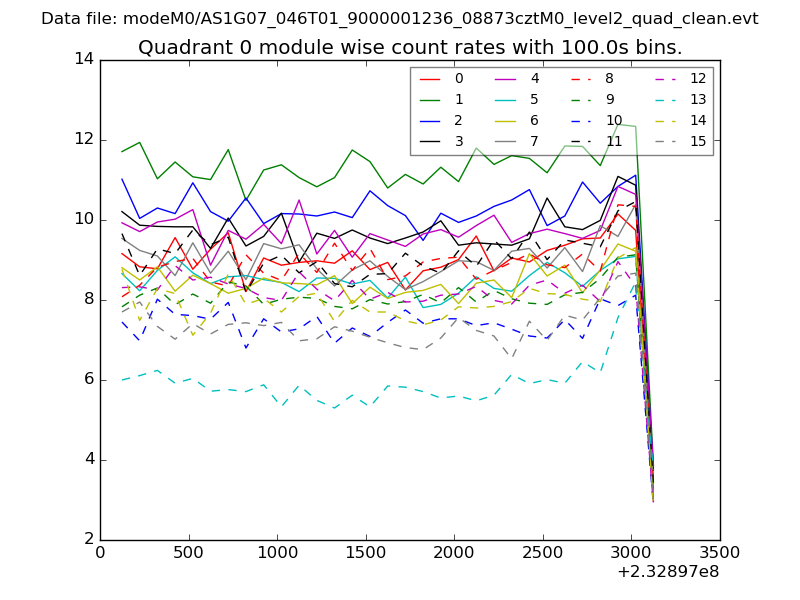 |
 |
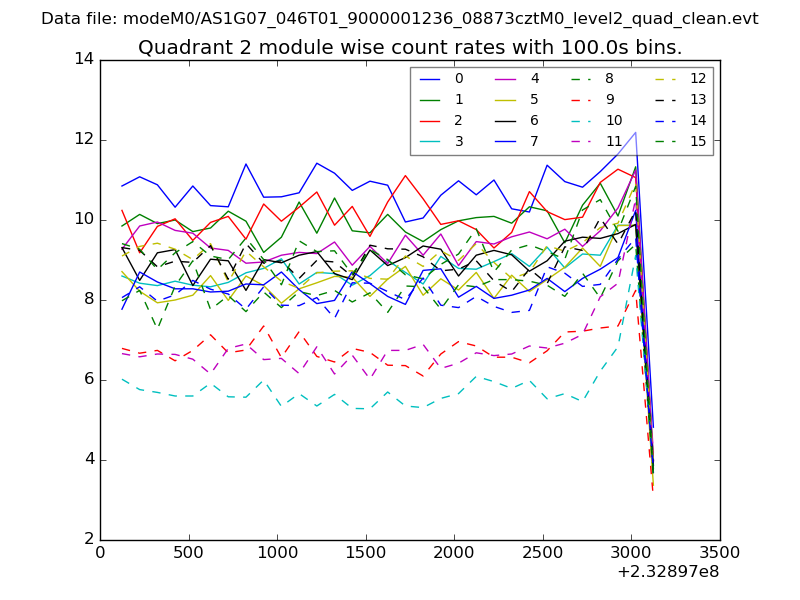
| Module-wise count rates for Quadrant B Data is divided into 100 sec bins |
 |
 |
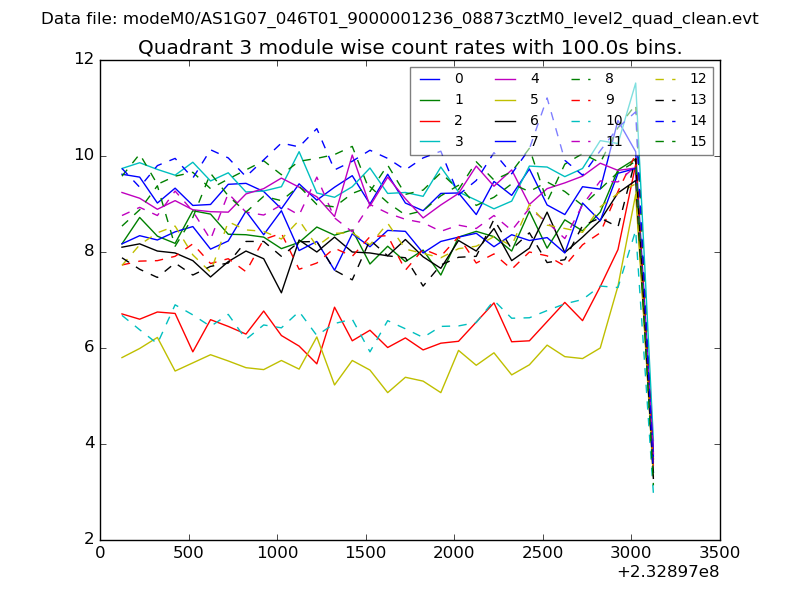
| Module-wise count rates for Quadrant C Data is divided into 100 sec bins |
 |
 |
| Module-wise count rates for Quadrant D Data is divided into 100 sec bins |
 |
 |
| Parameter | Plot |
|---|---|
| CZT HV Monitor | 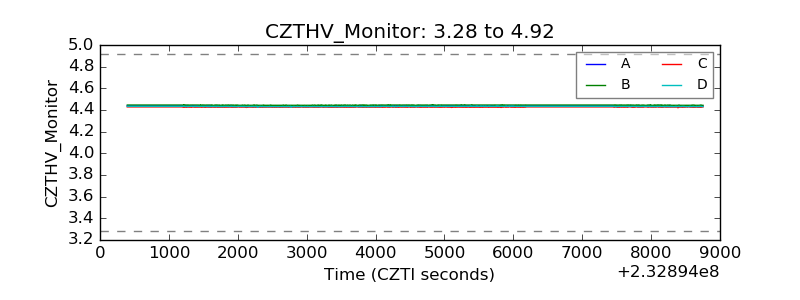 |
| D_VDD | 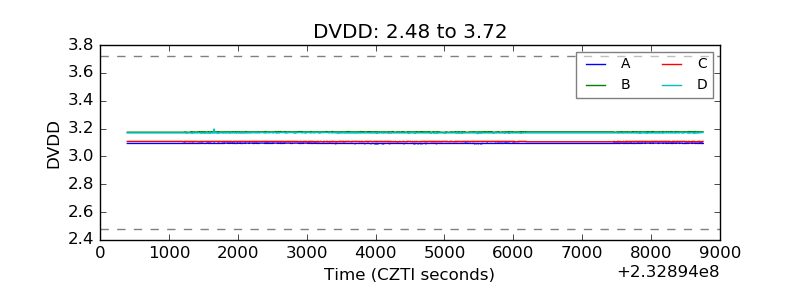 |
| Temperature 1 | 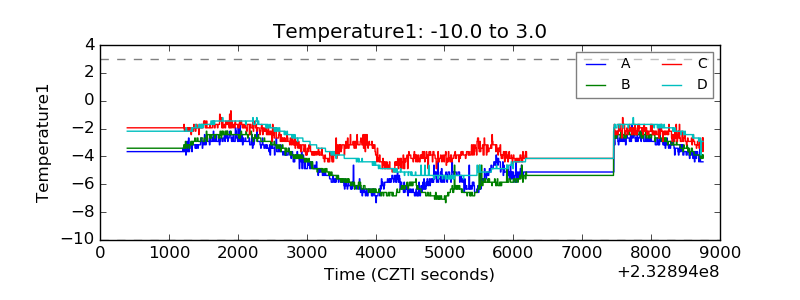 |
| Veto HV Monitor | 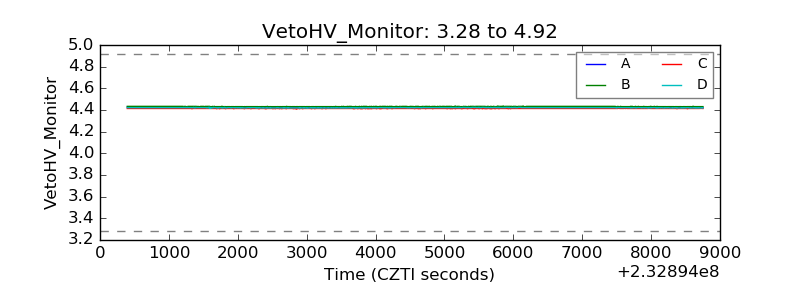 |
| Veto LLD | 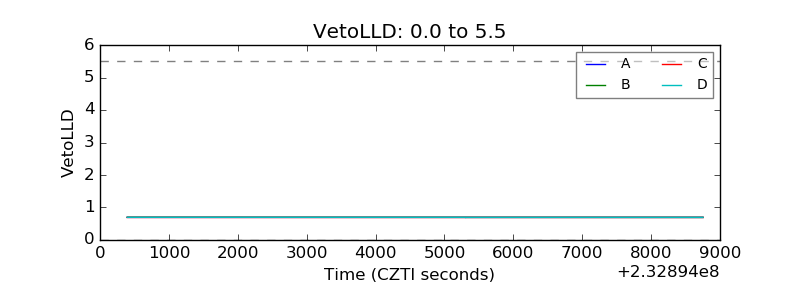 |
| Alpha Counter | 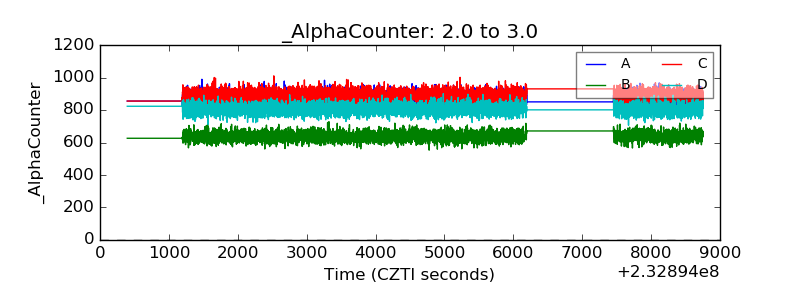 |
| _CPM_Rate | 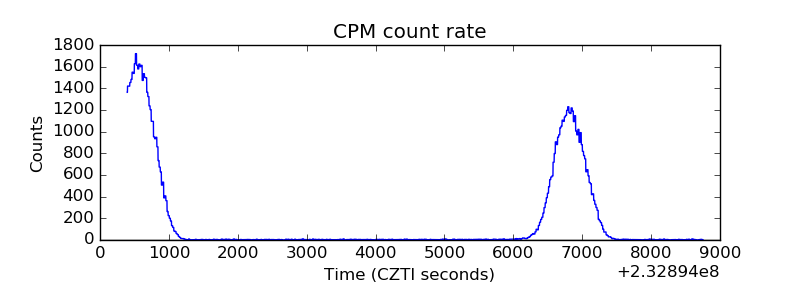 |
| CZT Counter | 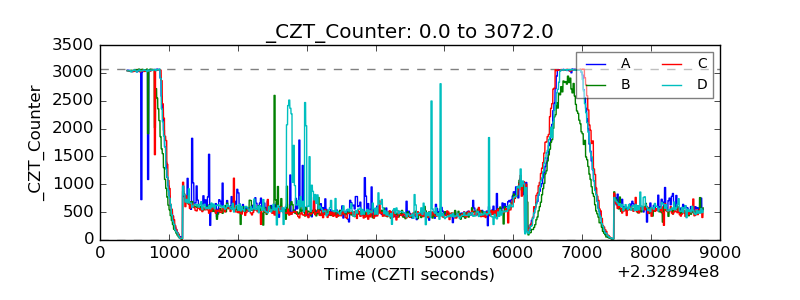 |
| +2.5 Volts monitor |  |
| +5 Volts monitor |  |
| _ROLL_ROT | 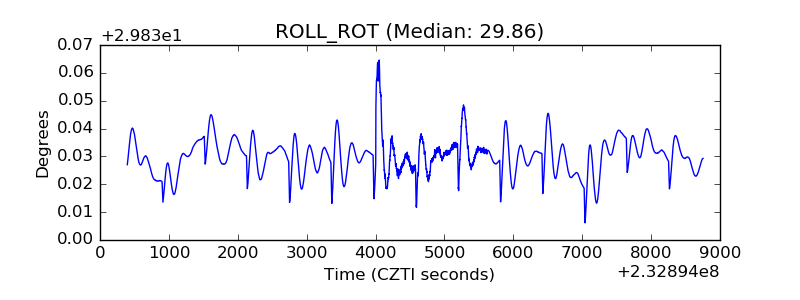 |
| _Roll_DEC | 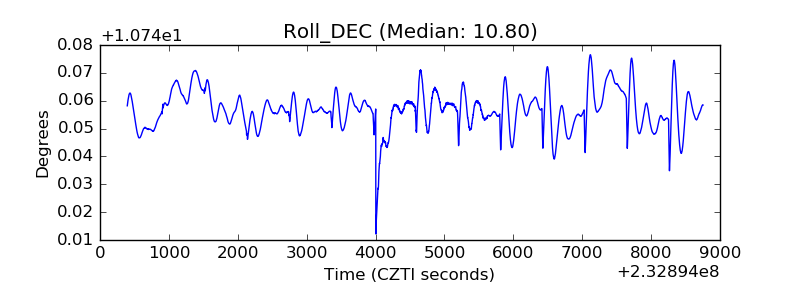 |
| _Roll_RA | 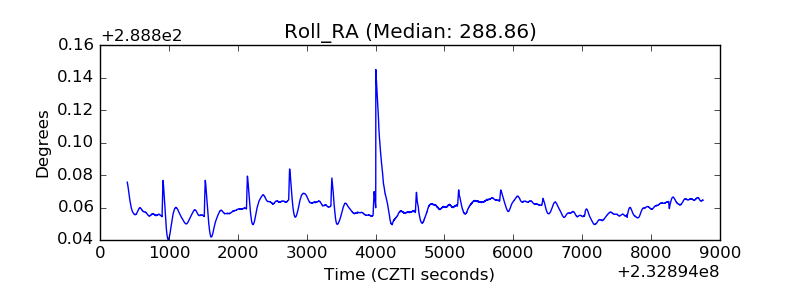 |
| Veto Counter |  |