| Param | Original file | Final file |
|---|---|---|
| Filename | modeM0/AS1G07_046T01_9000001236_08876cztM0_level2.evt | modeM0/AS1G07_046T01_9000001236_08876cztM0_level2_quad_clean.evt |
| Size (bytes) | 553,740,480 | 92,782,080 |
| Size | 528.1 MB | 88.5 MB |
| Events in quadrant A | 4,112,119 | 576,868 |
| Events in quadrant B | 3,839,360 | 576,523 |
| Events in quadrant C | 4,264,122 | 569,099 |
| Events in quadrant D | 4,035,303 | 555,148 |
| Mode M9 | |||
|---|---|---|---|
| Quadrant | BADHDUFLAG | Total packets | Discarded packets |
| A | 0 | 14 | 0 |
| B | 0 | 14 | 0 |
| C | 0 | 14 | 0 |
| D | 0 | 14 | 0 |
| Mode M0 | |||
|---|---|---|---|
| Quadrant | BADHDUFLAG | Total packets | Discarded packets |
| A | 0 | 17190 | 3 |
| B | 0 | 16326 | 2 |
| C | 0 | 17386 | 2 |
| D | 0 | 16980 | 2 |
| Mode SS | |||
|---|---|---|---|
| Quadrant | BADHDUFLAG | Total packets | Discarded packets |
| A | 0 | 156 | 0 |
| B | 0 | 156 | 0 |
| C | 0 | 156 | 0 |
| D | 0 | 156 | 0 |
| Quadrant | Total seconds | Saturated seconds | Saturation percentage |
|---|---|---|---|
| A | 7654 | 137 | 1.789914% |
| B | 7654 | 162 | 2.116540% |
| C | 7654 | 126 | 1.646198% |
| D | 7654 | 164 | 2.142670% |
Noise dominated data is calculated using 1-second bins in cleaned event files. If a bin has >2000 counts, and if more than 50% of those come from <1% of pixels, then it is considered to be noise-dominated and hence unusable.
| Quadrant | # 1 sec bins | Bins with >0 counts | Bins with >2000 counts | High rate bins dominated by noise | Noise dominated (total time) | Noise dominated (detector-on time) | Marked lightcurve |
|---|---|---|---|---|---|---|---|
| A | 8944 | 7655 | 7 | 7 | 0.08% | 0.09% | 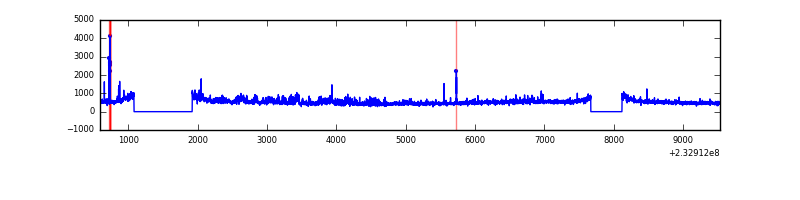 |
| B | 8944 | 7655 | 12 | 12 | 0.13% | 0.16% | 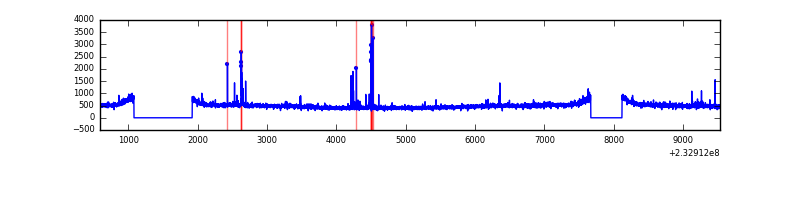 |
| C | 8944 | 7655 | 5 | 5 | 0.06% | 0.07% | 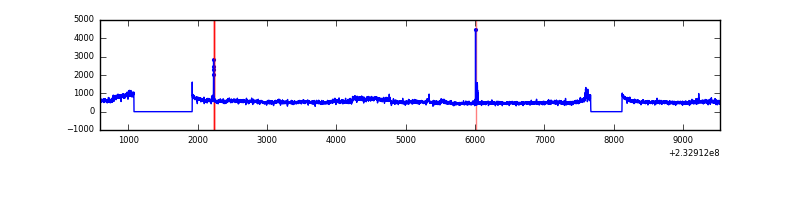 |
| D | 8944 | 7655 | 50 | 50 | 0.56% | 0.65% | 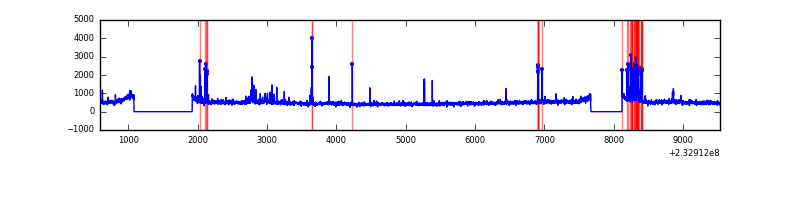 |
Top three noisy pixels from each quadrant. If the there are fewer than three noisy pixels in the level2.evt file, extra rows are filled as -1
| Pixel properties | Quadrant properties | ||||||
|---|---|---|---|---|---|---|---|
| Quadrant | DetID | PixID | Counts | Sigma | Mean | Median | Sigma |
| A | 8 | 5 | 388126 | 1975.91 | 952 | 931 | 196.0 |
| A | 5 | 16 | 43728 | 218.4 | 952 | 931 | 196.0 |
| A | 0 | 226 | 8680 | 39.54 | 952 | 931 | 196.0 |
| B | 10 | 16 | 44264 | 233.91 | 957 | 933 | 185.2 |
| B | 0 | 197 | 25351 | 131.81 | 957 | 933 | 185.2 |
| B | 0 | 214 | 24980 | 129.81 | 957 | 933 | 185.2 |
| C | 9 | 68 | 603761 | 2789.16 | 926 | 928 | 216.1 |
| C | 1 | 3 | 35557 | 160.22 | 926 | 928 | 216.1 |
| C | 14 | 67 | 13678 | 58.99 | 926 | 928 | 216.1 |
| D | 8 | 195 | 198233 | 880.03 | 921 | 900 | 224.2 |
| D | 7 | 71 | 188934 | 838.56 | 921 | 900 | 224.2 |
| D | 2 | 14 | 60847 | 267.34 | 921 | 900 | 224.2 |
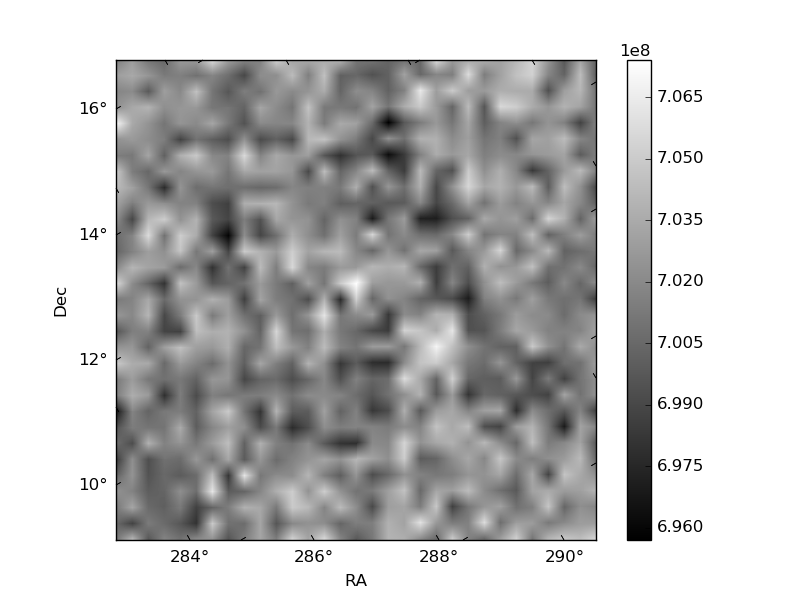
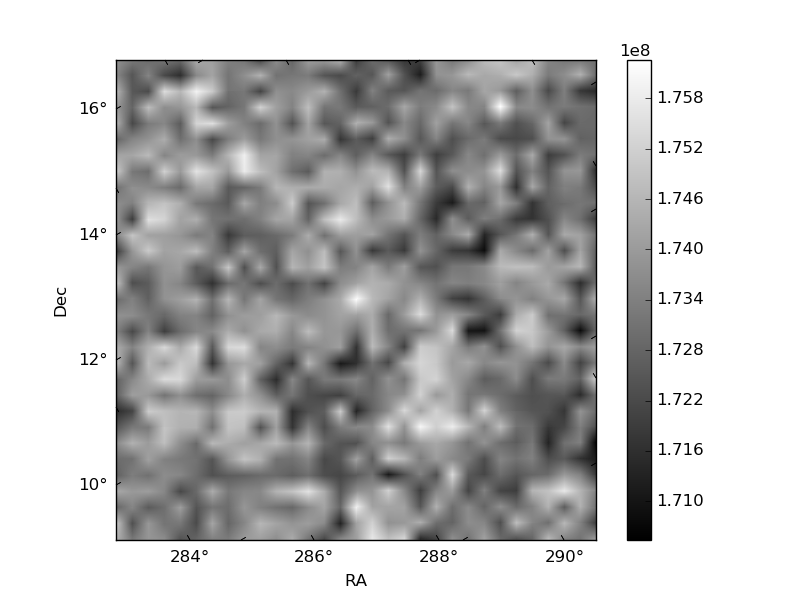
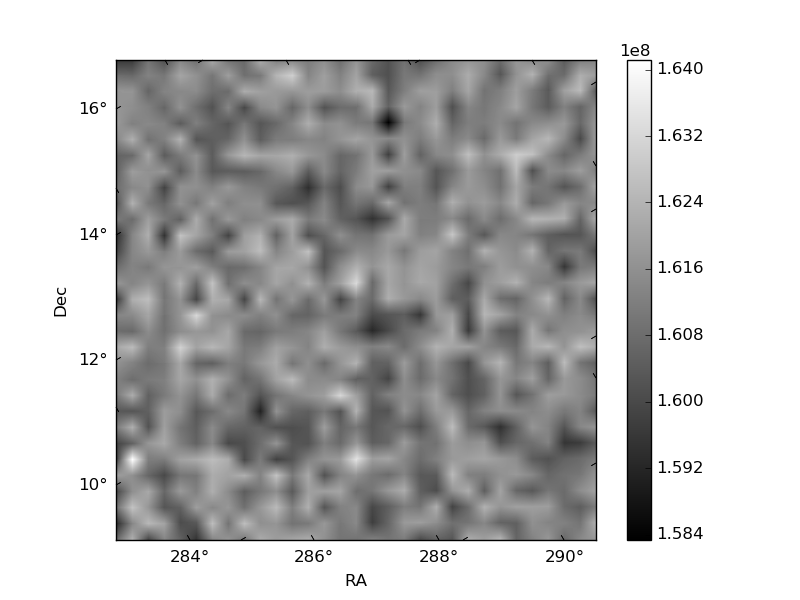
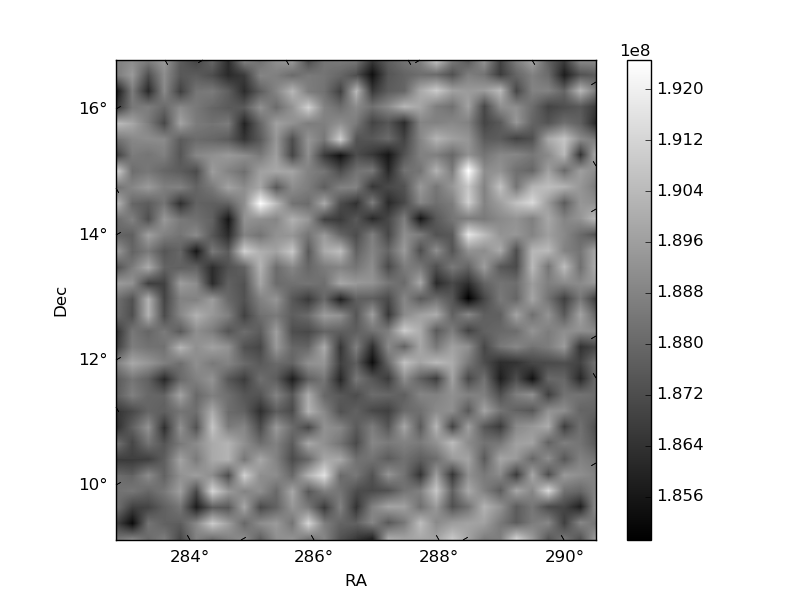
Histogram calculated using DETX and DETY for each event in the final _common_clean file
| Quadrant A | 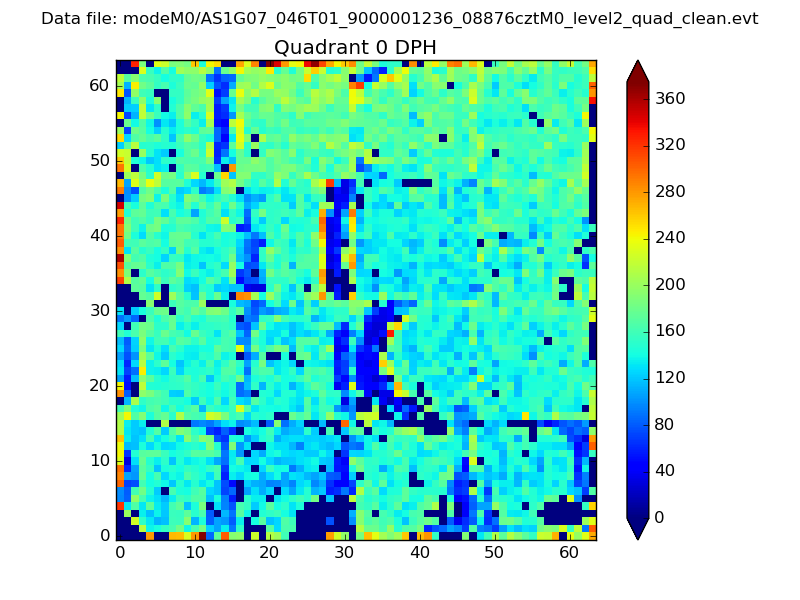 |
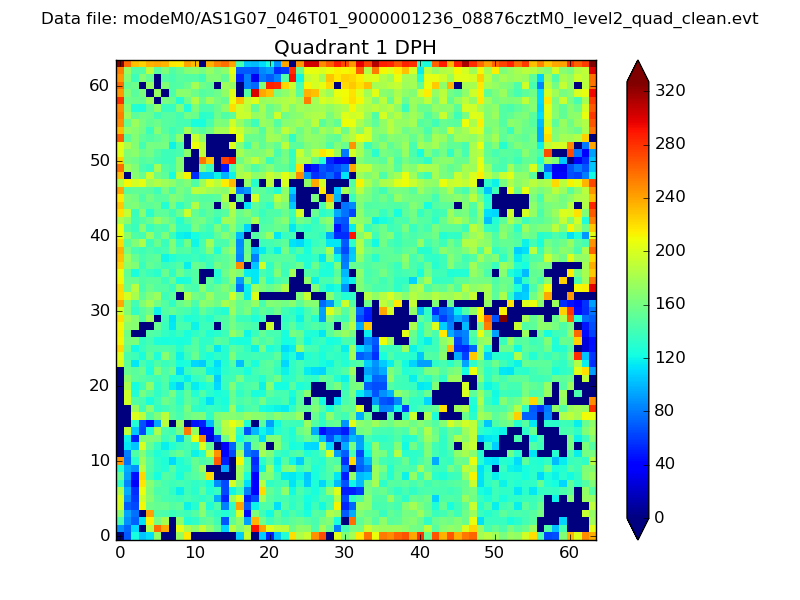 |
Quadrant B |
|---|---|---|---|
| Quadrant D | 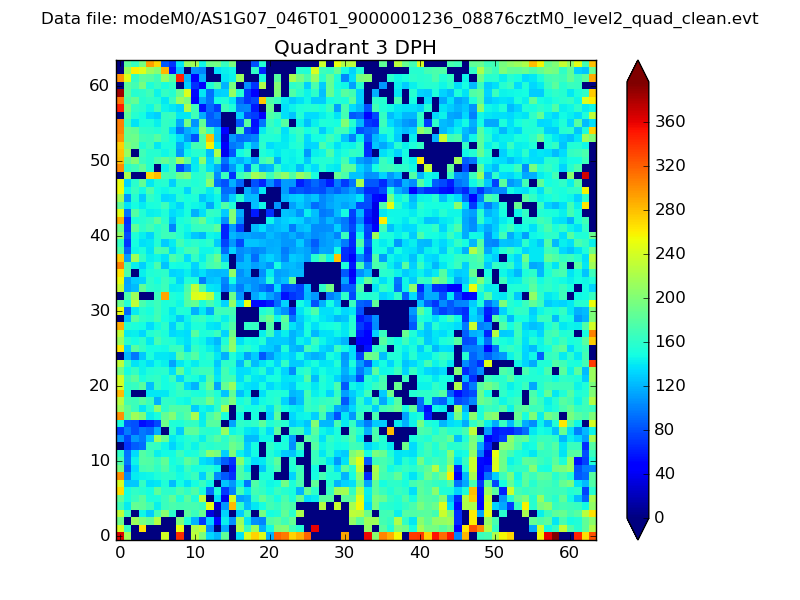 |
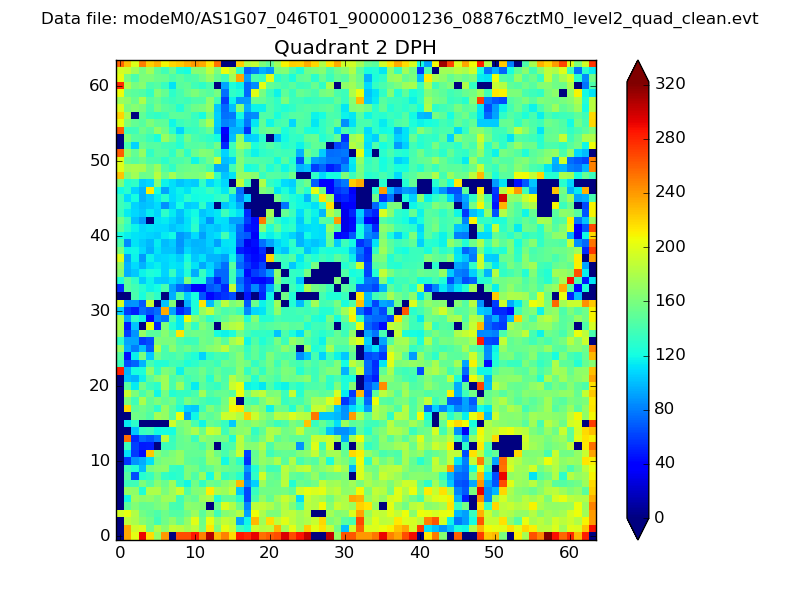 |
Quadrant C |
| Plot type | Count rate plots | Images |
|---|---|---|
| Comparison with Poisson distribution Blue bars denote a histogram of data divided into 1 sec bins. Red curve is a Poisson curve with rate = median count rate of data. |
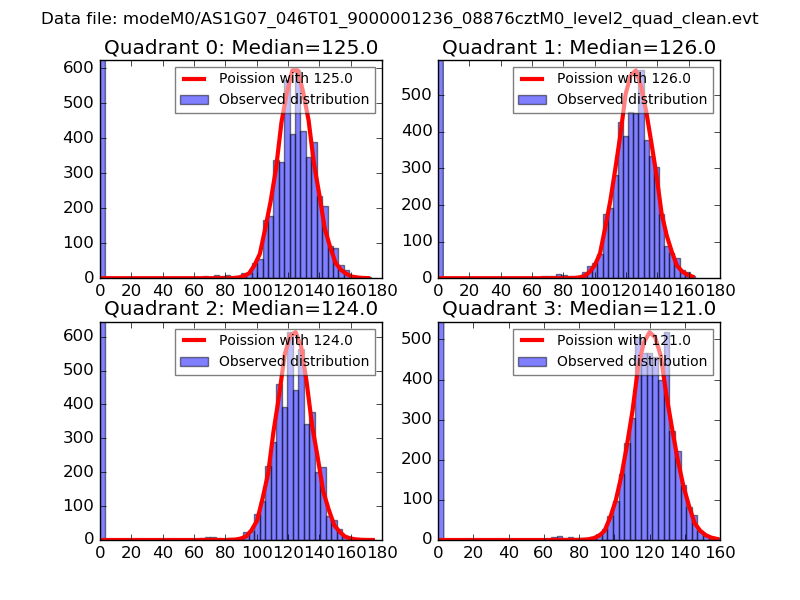 |
 |
| Quadrant-wise count rates Data is divided into 100 sec bins |
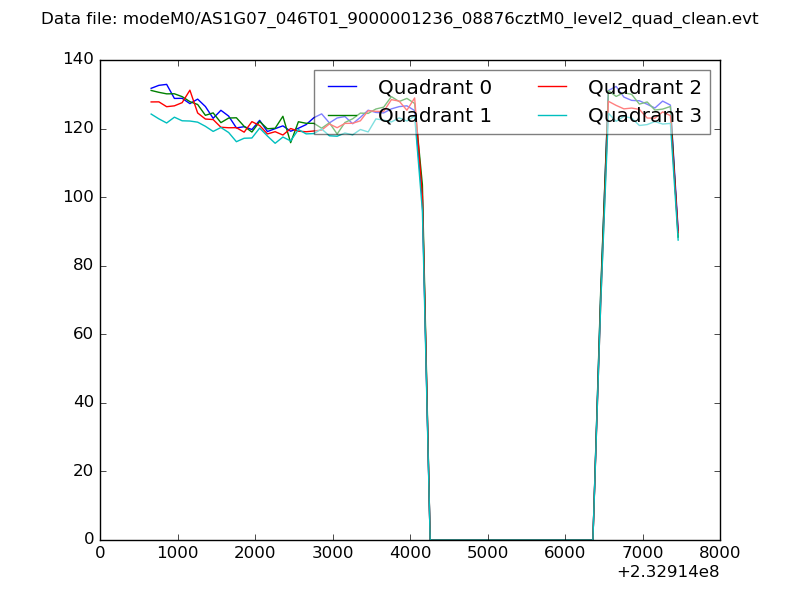 |
|
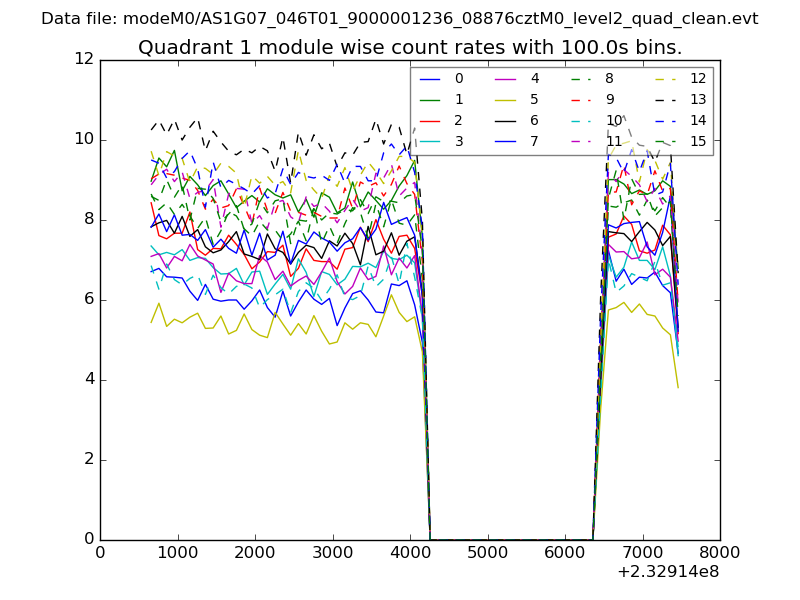
| Module-wise count rates for Quadrant A Data is divided into 100 sec bins |
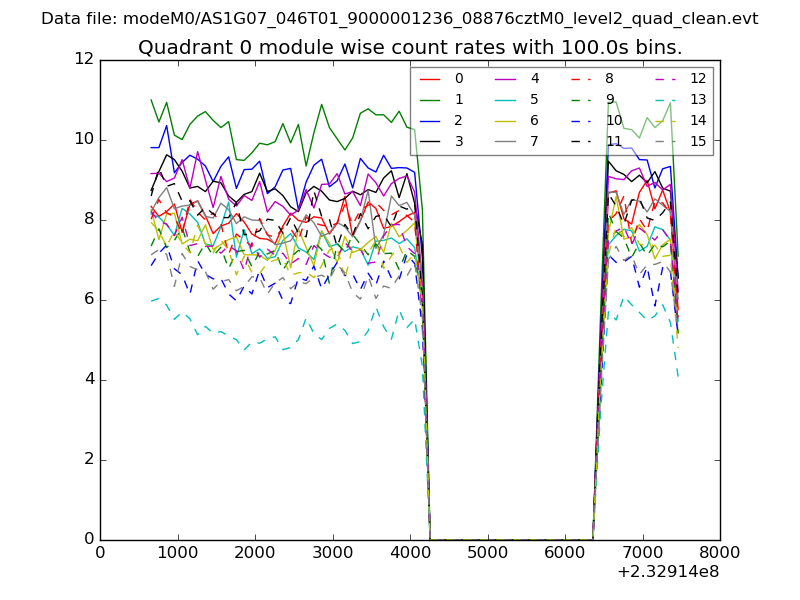 |
 |
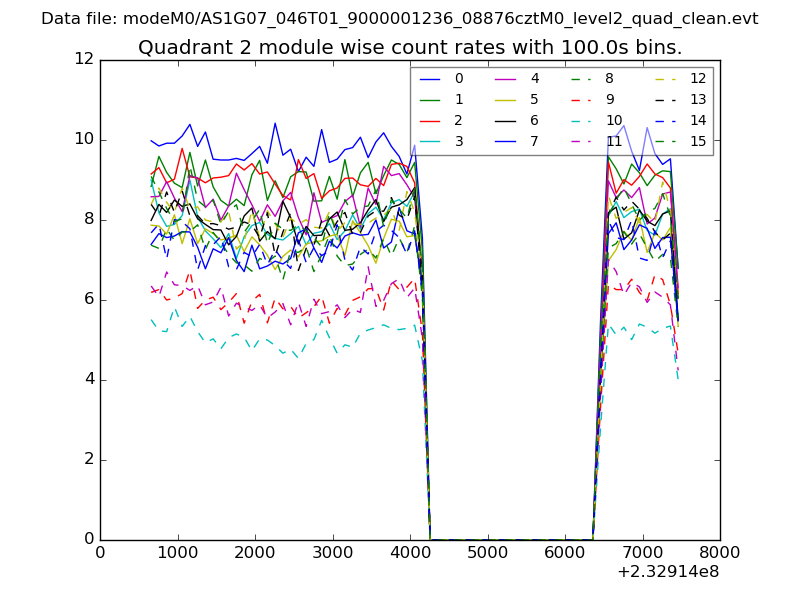
| Module-wise count rates for Quadrant B Data is divided into 100 sec bins |
 |
 |
| Module-wise count rates for Quadrant C Data is divided into 100 sec bins |
 |
 |
| Module-wise count rates for Quadrant D Data is divided into 100 sec bins |
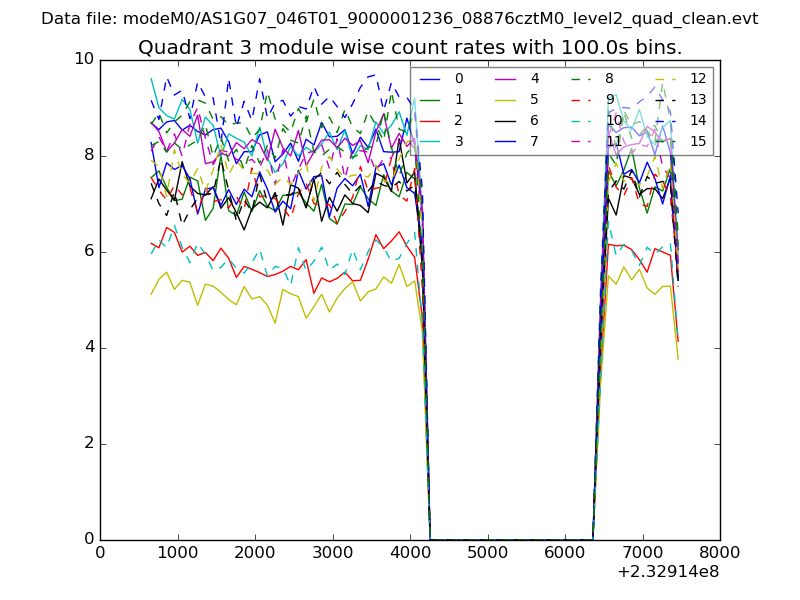 |
 |
| Parameter | Plot |
|---|---|
| CZT HV Monitor | 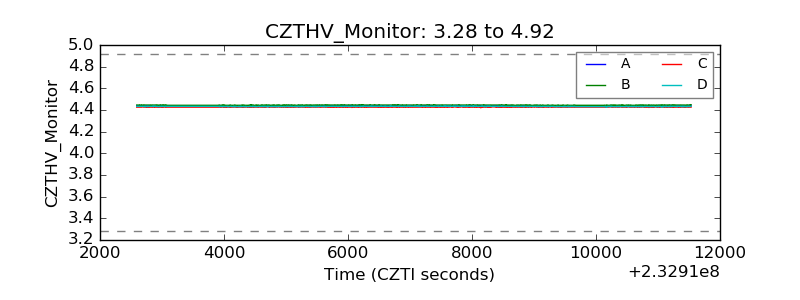 |
| D_VDD |  |
| Temperature 1 |  |
| Veto HV Monitor | 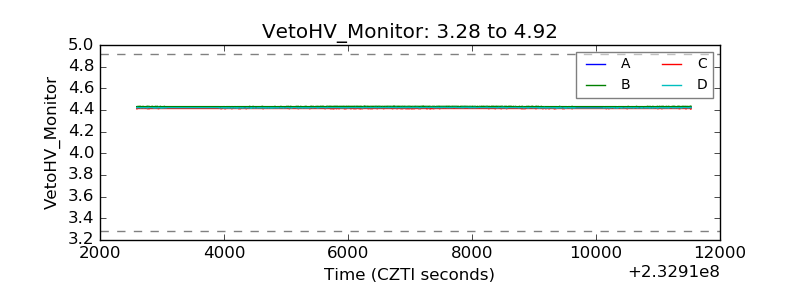 |
| Veto LLD |  |
| Alpha Counter | 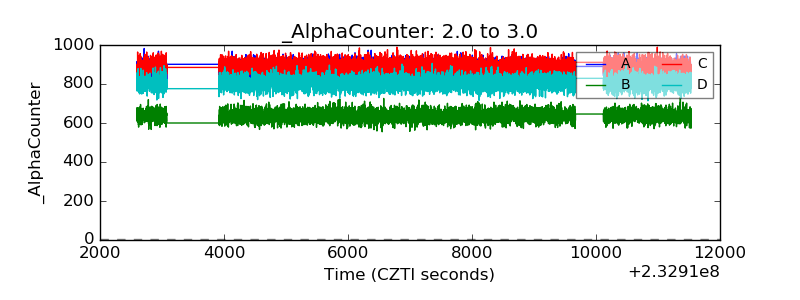 |
| _CPM_Rate | 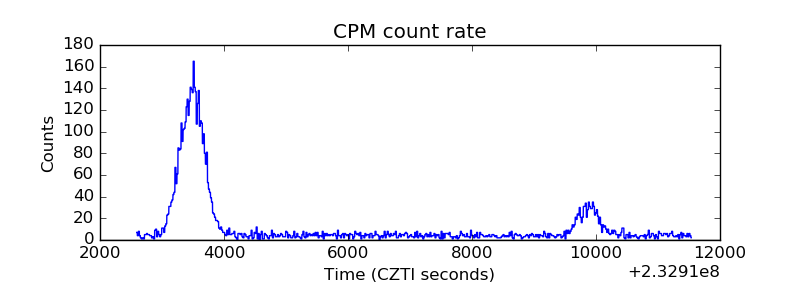 |
| CZT Counter | 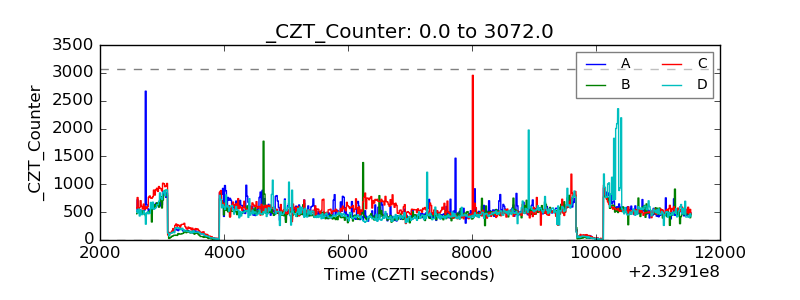 |
| +2.5 Volts monitor |  |
| +5 Volts monitor |  |
| _ROLL_ROT | 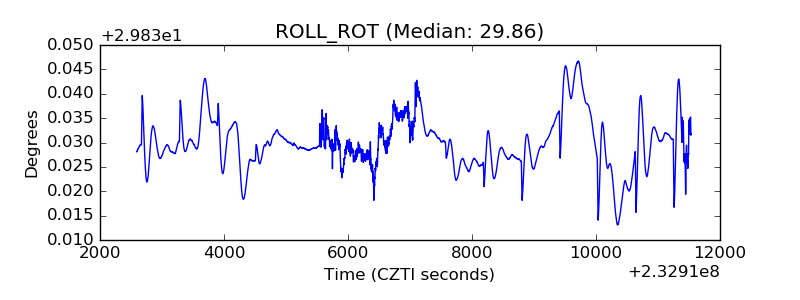 |
| _Roll_DEC | 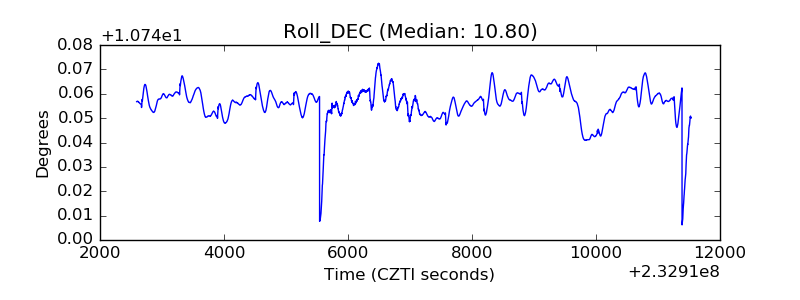 |
| _Roll_RA | 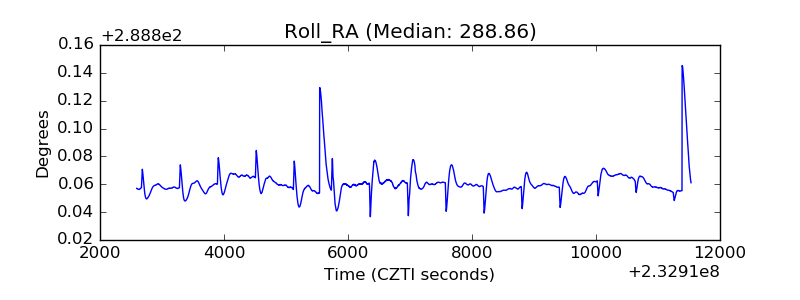 |
| Veto Counter | 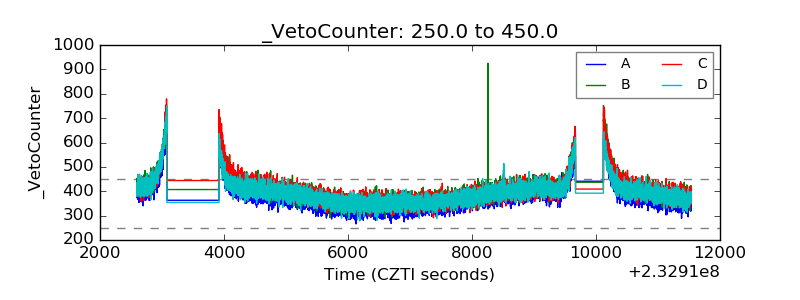 |