| Param | Original file | Final file |
|---|---|---|
| Filename | modeM0/AS1G07_046T01_9000001236_08878cztM0_level2.evt | modeM0/AS1G07_046T01_9000001236_08878cztM0_level2_quad_clean.evt |
| Size (bytes) | 79,012,800 | 13,662,720 |
| Size | 75.4 MB | 13.0 MB |
| Events in quadrant A | 790,422 | 87,303 |
| Events in quadrant B | 497,569 | 91,643 |
| Events in quadrant C | 490,348 | 88,627 |
| Events in quadrant D | 558,905 | 83,966 |
| Mode M9 | |||
|---|---|---|---|
| Quadrant | BADHDUFLAG | Total packets | Discarded packets |
| A | 0 | 2 | 0 |
| B | 0 | 2 | 0 |
| C | 0 | 2 | 0 |
| D | 0 | 2 | 0 |
| Mode M0 | |||
|---|---|---|---|
| Quadrant | BADHDUFLAG | Total packets | Discarded packets |
| A | 0 | 2891 | 1 |
| B | 0 | 1968 | 1 |
| C | 0 | 1940 | 1 |
| D | 0 | 2155 | 1 |
| Mode SS | |||
|---|---|---|---|
| Quadrant | BADHDUFLAG | Total packets | Discarded packets |
| A | 0 | 20 | 0 |
| B | 0 | 20 | 0 |
| C | 0 | 20 | 0 |
| D | 0 | 20 | 0 |
| Quadrant | Total seconds | Saturated seconds | Saturation percentage |
|---|---|---|---|
| A | 773 | 117 | 15.135834% |
| B | 773 | 84 | 10.866753% |
| C | 773 | 48 | 6.209573% |
| D | 773 | 61 | 7.891332% |
Noise dominated data is calculated using 1-second bins in cleaned event files. If a bin has >2000 counts, and if more than 50% of those come from <1% of pixels, then it is considered to be noise-dominated and hence unusable.
| Quadrant | # 1 sec bins | Bins with >0 counts | Bins with >2000 counts | High rate bins dominated by noise | Noise dominated (total time) | Noise dominated (detector-on time) | Marked lightcurve |
|---|---|---|---|---|---|---|---|
| A | 973 | 775 | 0 | 0 | 0.00% | 0.00% | 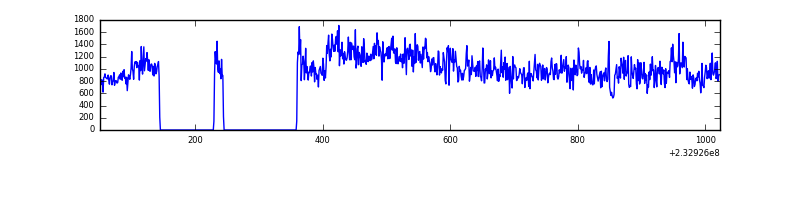 |
| B | 973 | 775 | 0 | 0 | 0.00% | 0.00% | 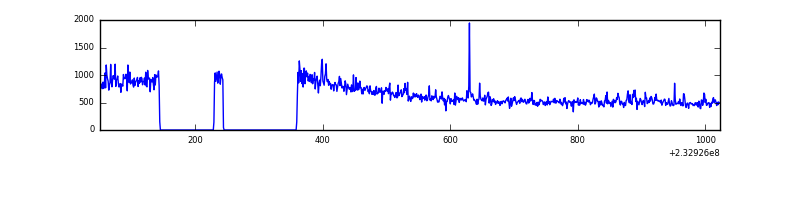 |
| C | 973 | 775 | 3 | 3 | 0.31% | 0.39% | 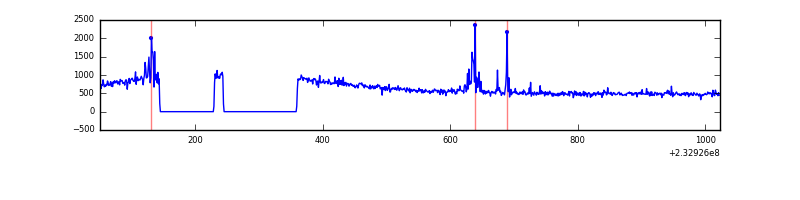 |
| D | 973 | 774 | 7 | 7 | 0.72% | 0.90% | 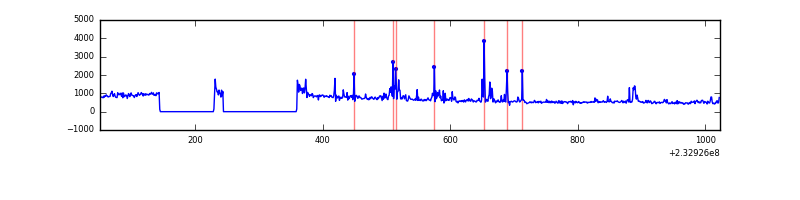 |
Top three noisy pixels from each quadrant. If the there are fewer than three noisy pixels in the level2.evt file, extra rows are filled as -1
| Pixel properties | Quadrant properties | ||||||
|---|---|---|---|---|---|---|---|
| Quadrant | DetID | PixID | Counts | Sigma | Mean | Median | Sigma |
| A | 8 | 5 | 328191 | 12162.89 | 118 | 114 | 27.0 |
| A | 0 | 128 | 6829 | 248.95 | 118 | 114 | 27.0 |
| A | 0 | 226 | 1057 | 34.96 | 118 | 114 | 27.0 |
| B | 6 | 51 | 18345 | 676.04 | 121 | 118 | 27.0 |
| B | 4 | 173 | 5463 | 198.25 | 121 | 118 | 27.0 |
| B | 12 | 111 | 2831 | 100.62 | 121 | 118 | 27.0 |
| C | 14 | 234 | 24749 | 801.22 | 118 | 119 | 30.7 |
| C | 9 | 68 | 2719 | 84.58 | 118 | 119 | 30.7 |
| C | 13 | 61 | 906 | 25.6 | 118 | 119 | 30.7 |
| D | 7 | 71 | 36964 | 1139.06 | 117 | 113 | 32.4 |
| D | 8 | 195 | 33371 | 1028.0 | 117 | 113 | 32.4 |
| D | 1 | 52 | 26739 | 823.0 | 117 | 113 | 32.4 |
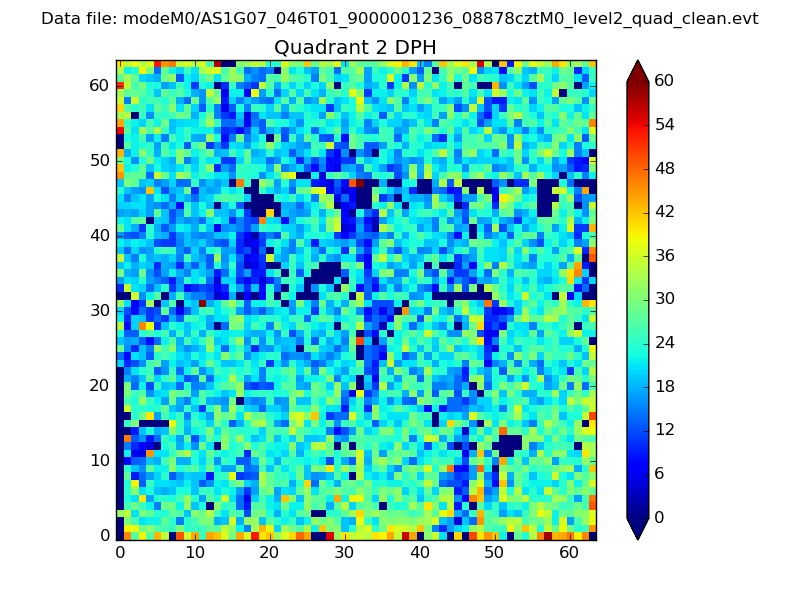
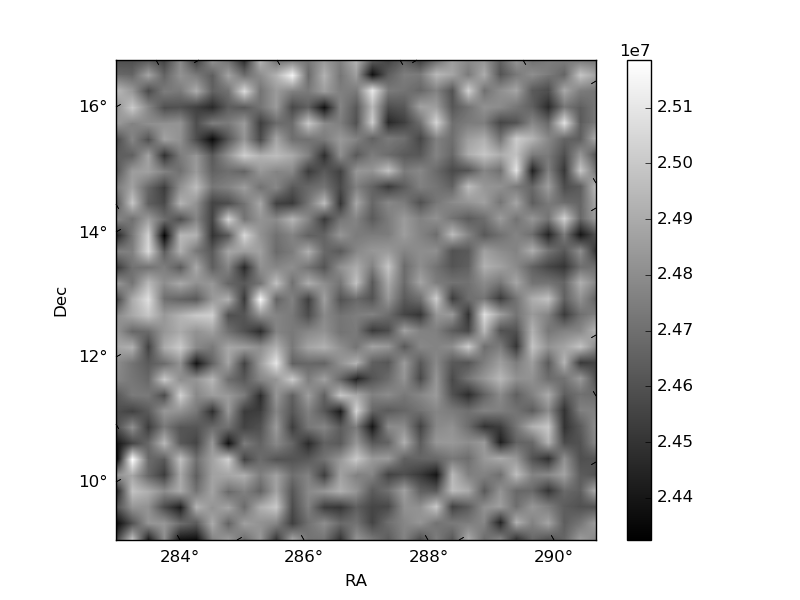
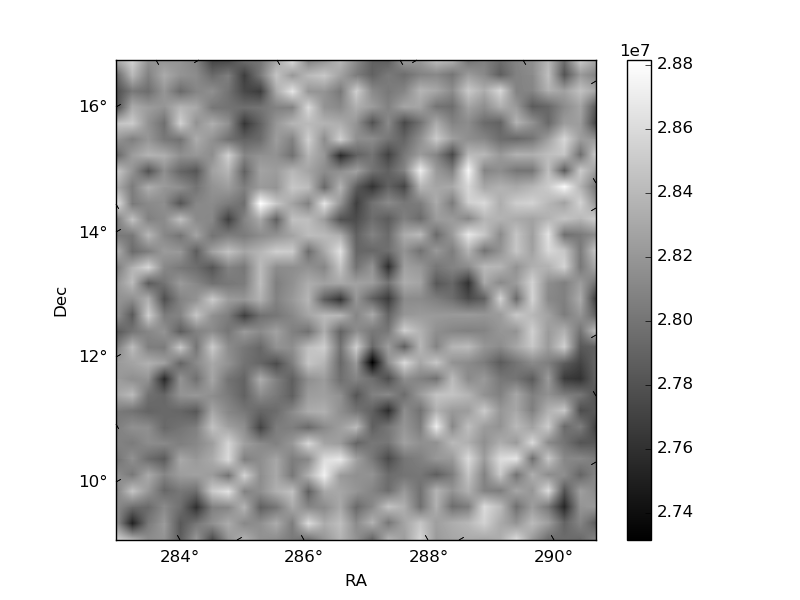
Histogram calculated using DETX and DETY for each event in the final _common_clean file
| Quadrant A | 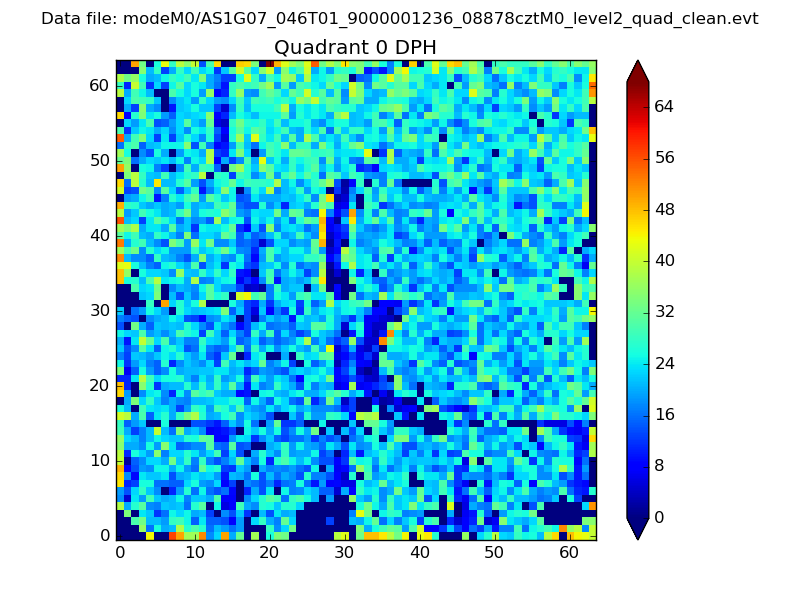 |
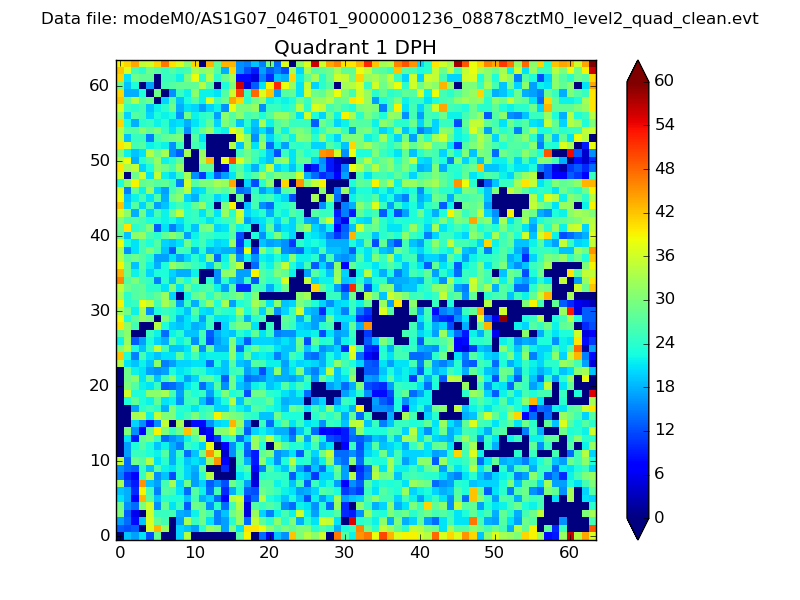 |
Quadrant B |
|---|---|---|---|
| Quadrant D | 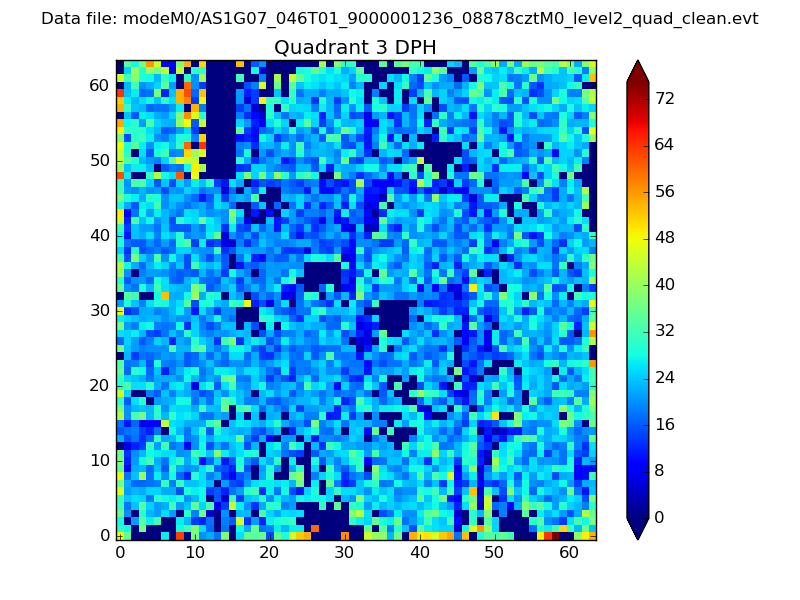 |
 |
Quadrant C |
| Plot type | Count rate plots | Images |
|---|---|---|
| Comparison with Poisson distribution Blue bars denote a histogram of data divided into 1 sec bins. Red curve is a Poisson curve with rate = median count rate of data. |
 |
 |
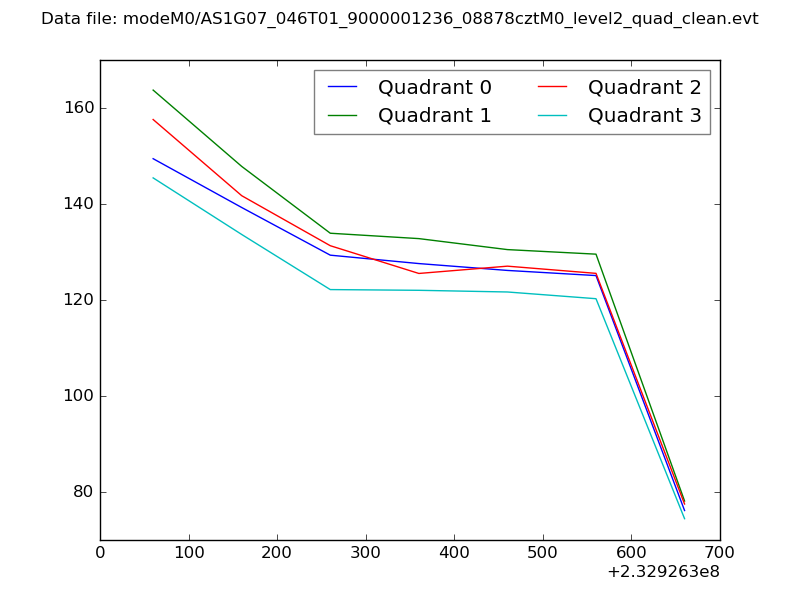
| Quadrant-wise count rates Data is divided into 100 sec bins |
 |
|
| Module-wise count rates for Quadrant A Data is divided into 100 sec bins |
 |
 |
| Module-wise count rates for Quadrant B Data is divided into 100 sec bins |
 |
 |
| Module-wise count rates for Quadrant C Data is divided into 100 sec bins |
 |
 |
| Module-wise count rates for Quadrant D Data is divided into 100 sec bins |
 |
 |
| Parameter | Plot |
|---|---|
| CZT HV Monitor | 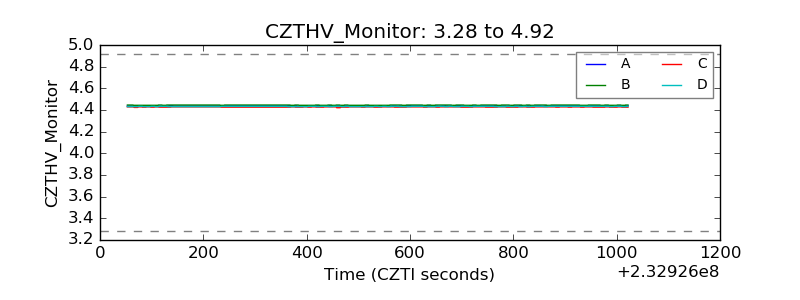 |
| D_VDD | 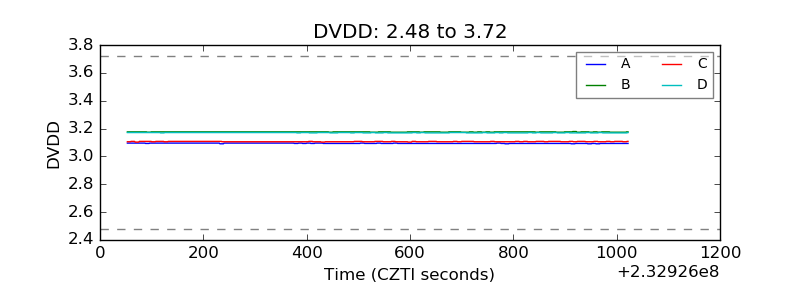 |
| Temperature 1 |  |
| Veto HV Monitor | 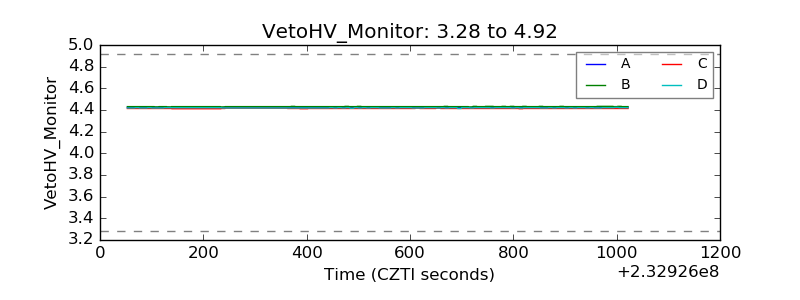 |
| Veto LLD | 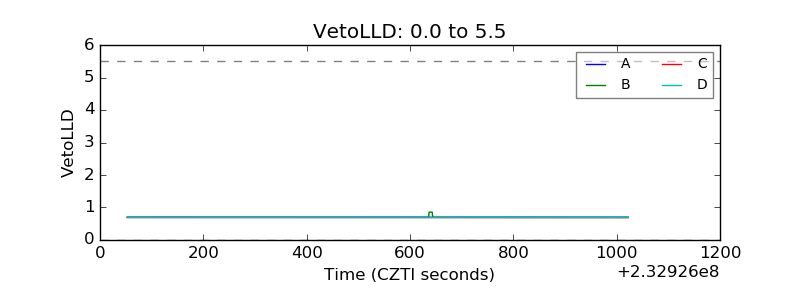 |
| Alpha Counter | 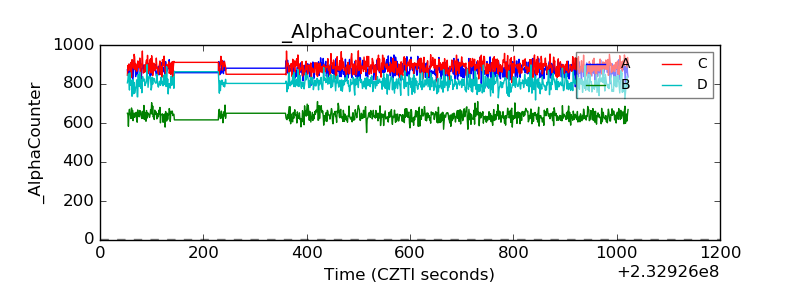 |
| _CPM_Rate | 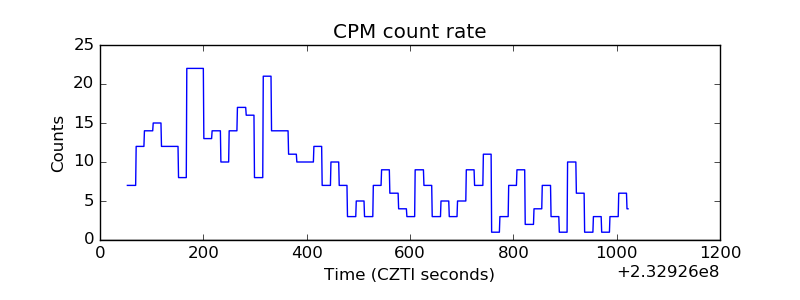 |
| CZT Counter | 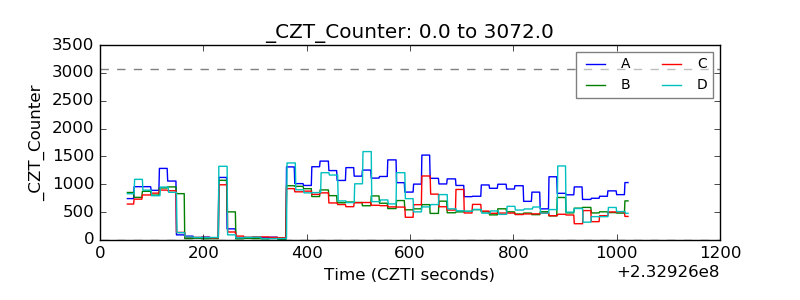 |
| +2.5 Volts monitor |  |
| +5 Volts monitor |  |
| _ROLL_ROT |  |
| _Roll_DEC |  |
| _Roll_RA | 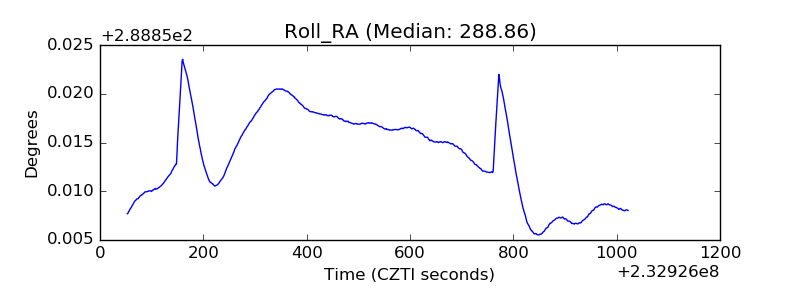 |
| Veto Counter | 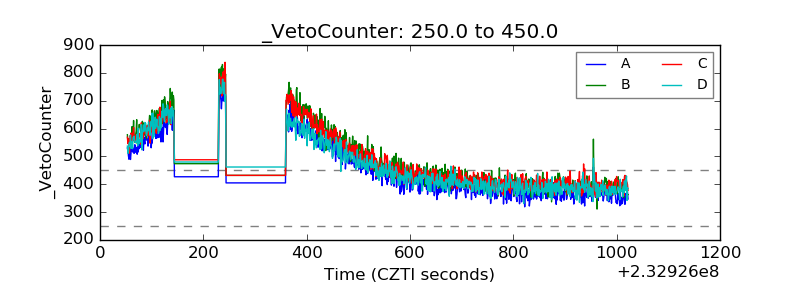 |