| Param | Original file | Final file |
|---|---|---|
| Filename | modeM0/AS1A03_092T01_9000001240cztM0_level2.fits | modeM0/AS1A03_092T01_9000001240cztM0_level2_quad_clean.evt |
| Size (bytes) | 2,926,425,600 | 3,091,849,920 |
| Size | 2.7 GB | 2.9 GB |
| Events in quadrant A | 17,669,449 | 18,858,364 |
| Events in quadrant B | 17,115,926 | 18,882,271 |
| Events in quadrant C | 17,458,555 | 17,949,984 |
| Events in quadrant D | 15,034,114 | 16,607,833 |
| Mode M9 | |||
|---|---|---|---|
| Quadrant | BADHDUFLAG | Total packets | Discarded packets |
| A | 0 | 505 | 0 |
| B | 0 | 502 | 0 |
| C | 0 | 502 | 0 |
| D | 0 | 503 | 0 |
| Mode SS | |||
|---|---|---|---|
| Quadrant | BADHDUFLAG | Total packets | Discarded packets |
| A | 0 | 6194 | 0 |
| B | 0 | 6191 | 0 |
| C | 0 | 6208 | 0 |
| D | 0 | 6212 | 0 |
| Mode M0 | |||
|---|---|---|---|
| Quadrant | BADHDUFLAG | Total packets | Discarded packets |
| A | 0 | 730784 | 0 |
| B | 0 | 665270 | 0 |
| C | 0 | 639900 | 0 |
| D | 0 | 746713 | 0 |
| Quadrant | Total seconds | Saturated seconds | Saturation percentage |
|---|---|---|---|
| A | 312164 | 5927 | 1.898681% |
| B | 312251 | 4484 | 1.436024% |
| C | 312267 | 2191 | 0.701643% |
| D | 312179 | 6504 | 2.083420% |
Noise dominated data is calculated using 1-second bins in cleaned event files. If a bin has >2000 counts, and if more than 50% of those come from <1% of pixels, then it is considered to be noise-dominated and hence unusable.
| Quadrant | # 1 sec bins | Bins with >0 counts | Bins with >2000 counts | High rate bins dominated by noise | Noise dominated (total time) | Noise dominated (detector-on time) | Marked lightcurve |
|---|---|---|---|---|---|---|---|
| A | 367406 | 312708 | 0 | 0 | 0.00% | 0.00% |  |
| B | 367406 | 312679 | 0 | 0 | 0.00% | 0.00% | 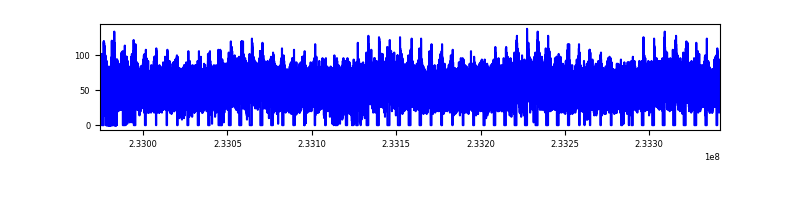 |
| C | 367406 | 312850 | 0 | 0 | 0.00% | 0.00% | 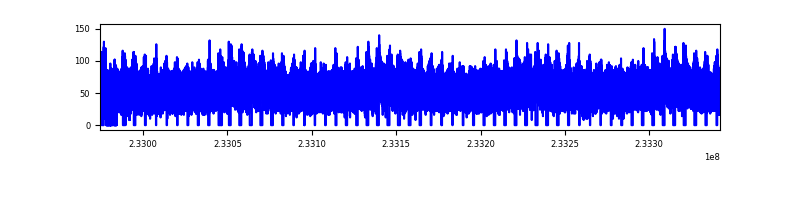 |
| D | 367406 | 312708 | 0 | 0 | 0.00% | 0.00% | 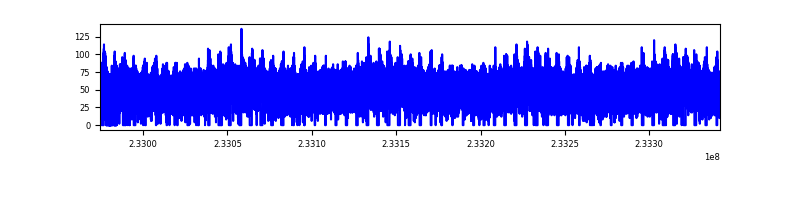 |
Top three noisy pixels from each quadrant. If the there are fewer than three noisy pixels in the level2.evt file, extra rows are filled as -1
| Pixel properties | Quadrant properties | ||||||
|---|---|---|---|---|---|---|---|
| Quadrant | DetID | PixID | Counts | Sigma | Mean | Median | Sigma |
| A | 0 | 29 | 17001 | 11.03 | 4596 | 4306 | 1150.4 |
| A | 7 | 110 | 14762 | 9.09 | 4596 | 4306 | 1150.4 |
| A | 0 | 30 | 13249 | 7.77 | 4596 | 4306 | 1150.4 |
| B | 2 | 9 | 14714 | 11.85 | 4515 | 4301 | 879.0 |
| B | 12 | 226 | 11655 | 8.37 | 4515 | 4301 | 879.0 |
| B | 14 | 254 | 11459 | 8.14 | 4515 | 4301 | 879.0 |
| C | 1 | 80 | 12853 | 7.13 | 4612 | 4272 | 1203.6 |
| C | 1 | 81 | 12645 | 6.96 | 4612 | 4272 | 1203.6 |
| C | 12 | 241 | 12353 | 6.71 | 4612 | 4272 | 1203.6 |
| D | 3 | 14 | 11631 | 6.85 | 4296 | 3915 | 1127.1 |
| D | 6 | 231 | 11024 | 6.31 | 4296 | 3915 | 1127.1 |
| D | 3 | 31 | 10907 | 6.2 | 4296 | 3915 | 1127.1 |
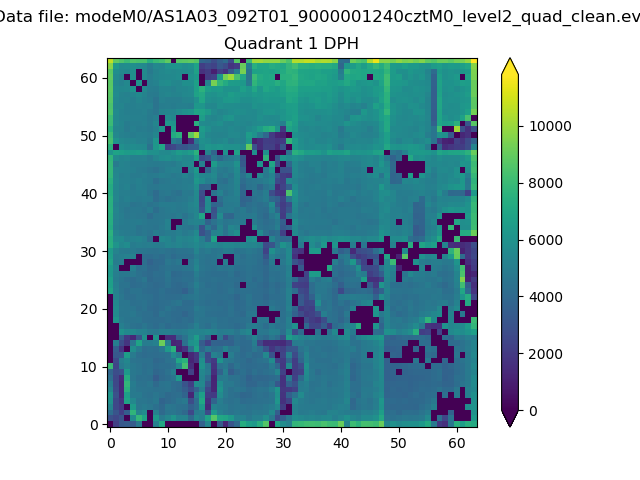
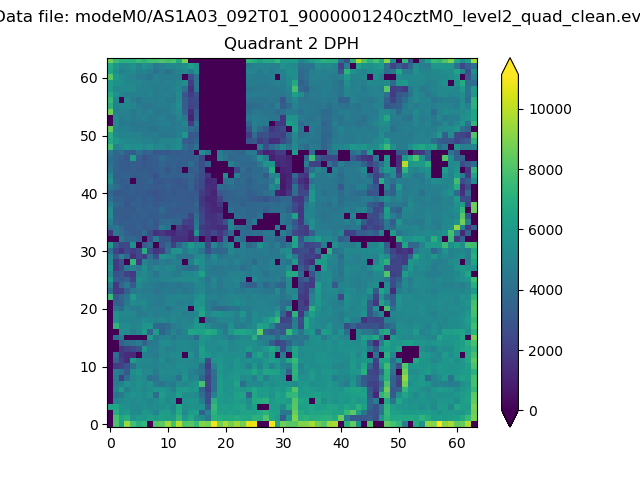
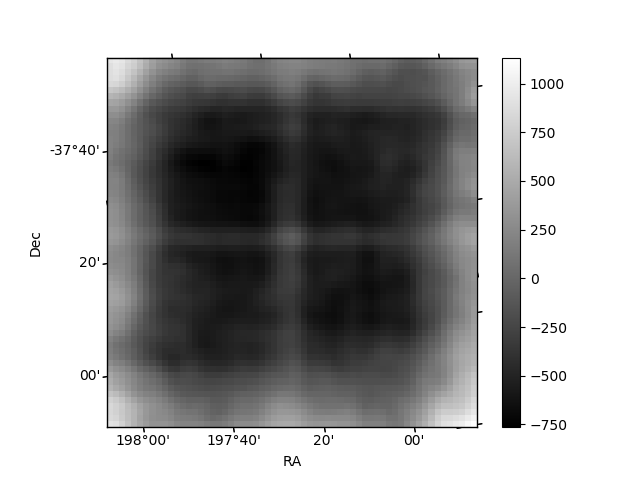
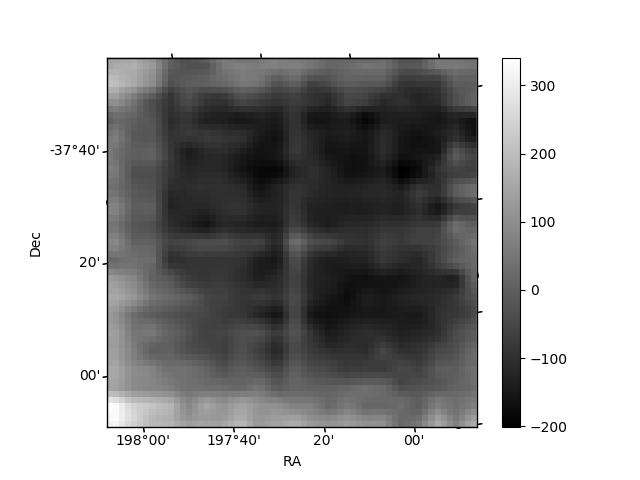
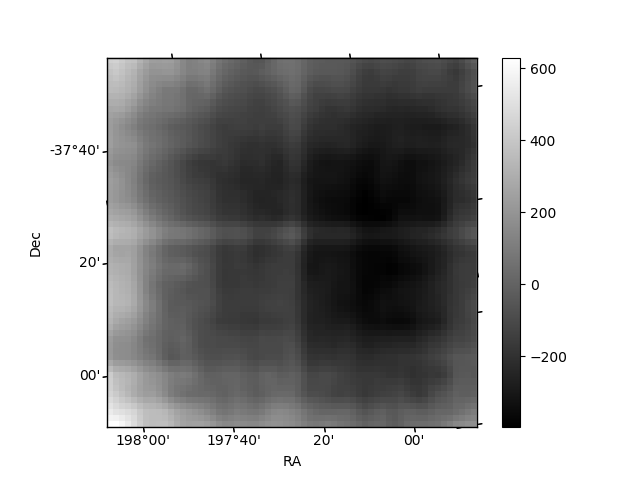
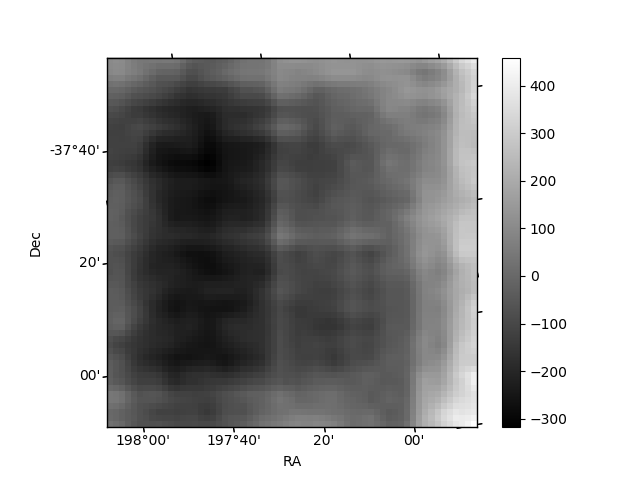
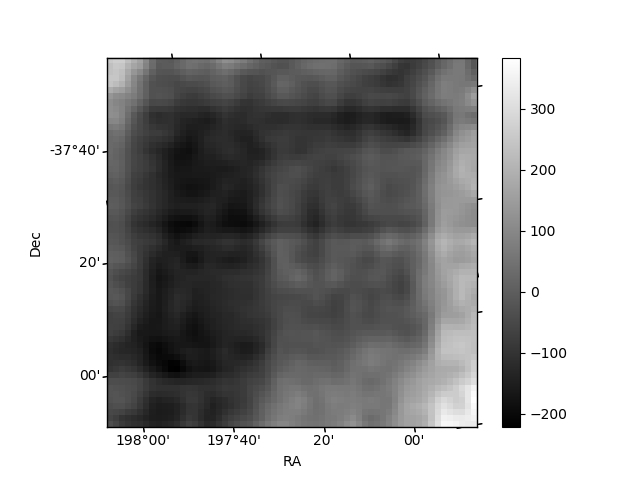
Histogram calculated using DETX and DETY for each event in the final _common_clean file
| Quadrant A | 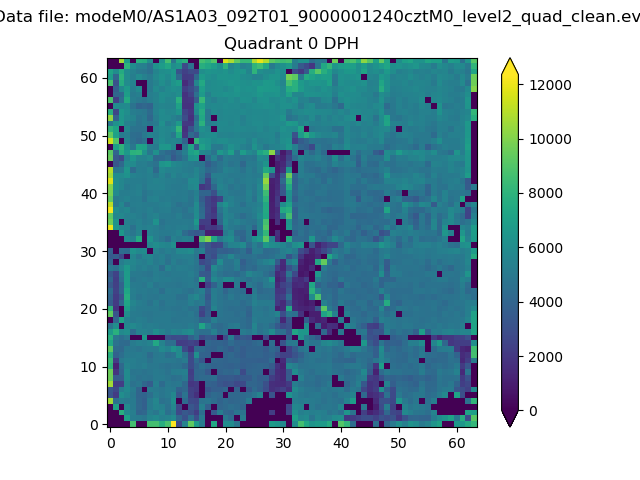 |
 |
Quadrant B |
|---|---|---|---|
| Quadrant D | 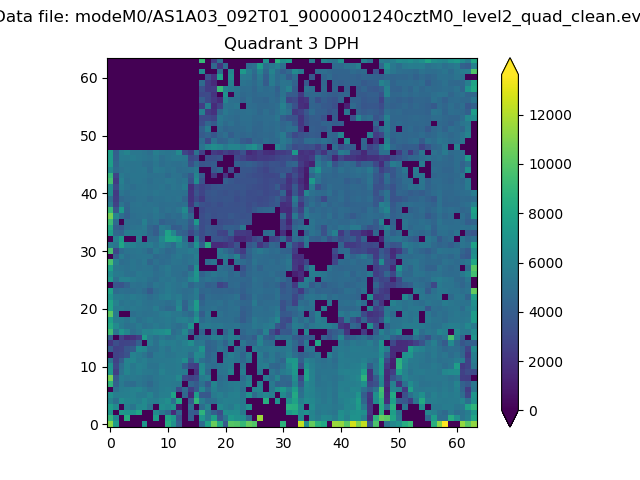 |
 |
Quadrant C |
| Plot type | Count rate plots | Images |
|---|---|---|
| Comparison with Poisson distribution Blue bars denote a histogram of data divided into 1 sec bins. Red curve is a Poisson curve with rate = median count rate of data. |
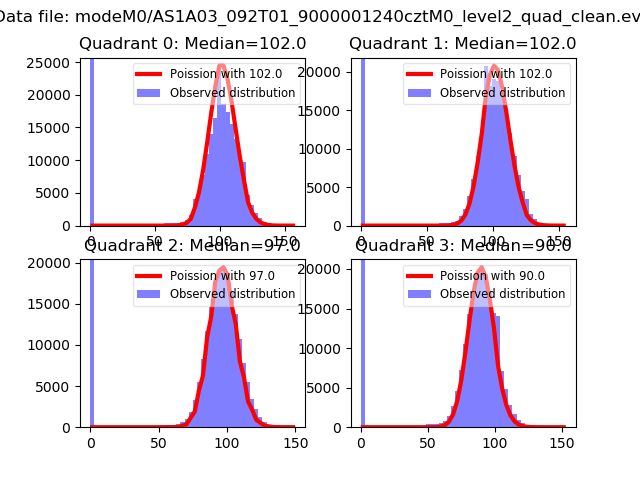 |
 |
| Quadrant-wise count rates Data is divided into 100 sec bins |
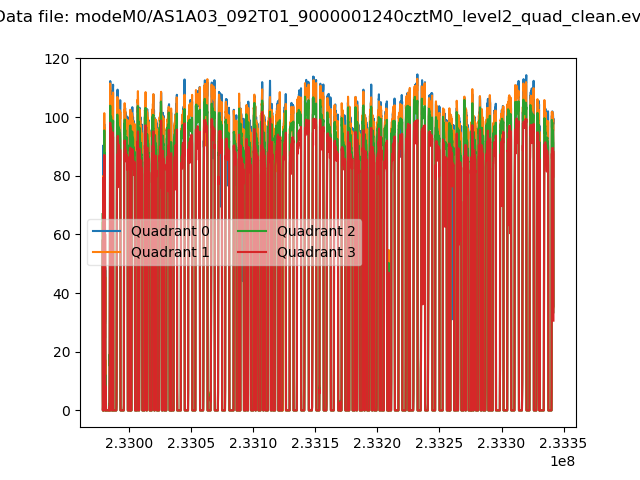 |
|
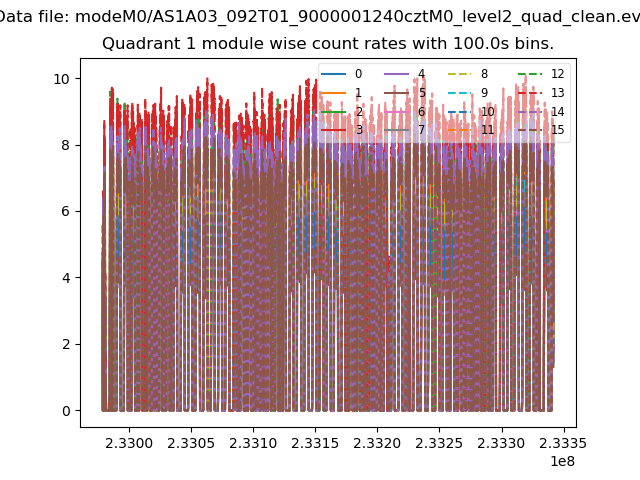
| Module-wise count rates for Quadrant A Data is divided into 100 sec bins |
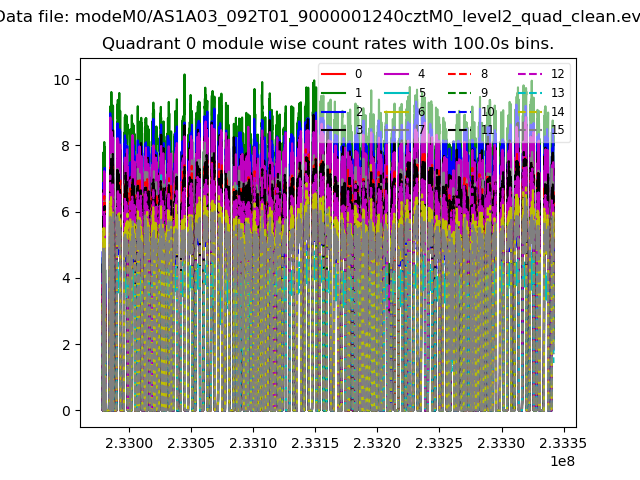 |
 |
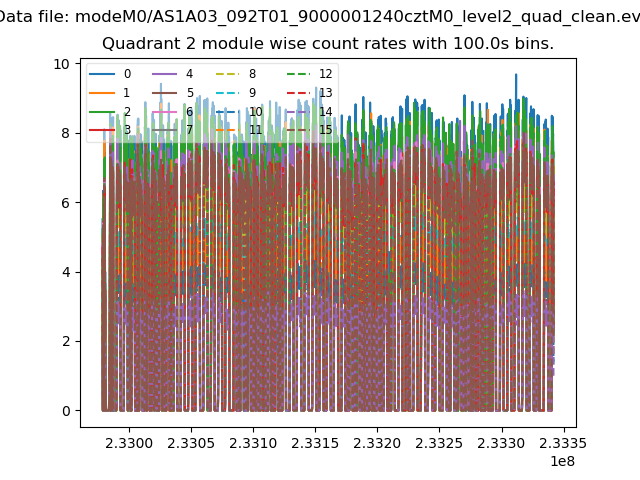
| Module-wise count rates for Quadrant B Data is divided into 100 sec bins |
 |
 |
| Module-wise count rates for Quadrant C Data is divided into 100 sec bins |
 |
 |
| Module-wise count rates for Quadrant D Data is divided into 100 sec bins |
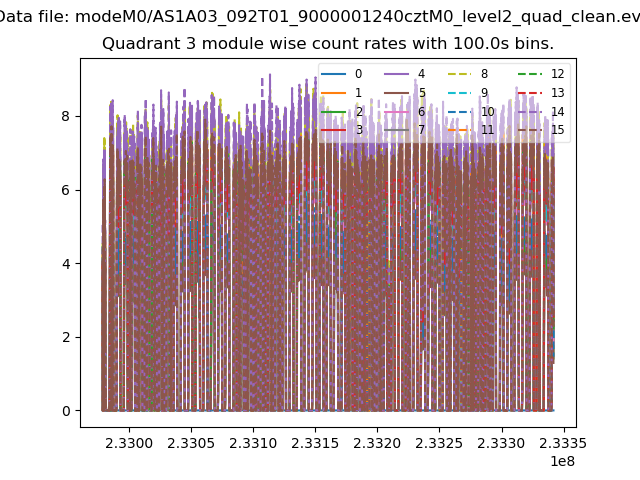 |
 |
| Parameter | Plot |
|---|---|
| CZT HV Monitor | 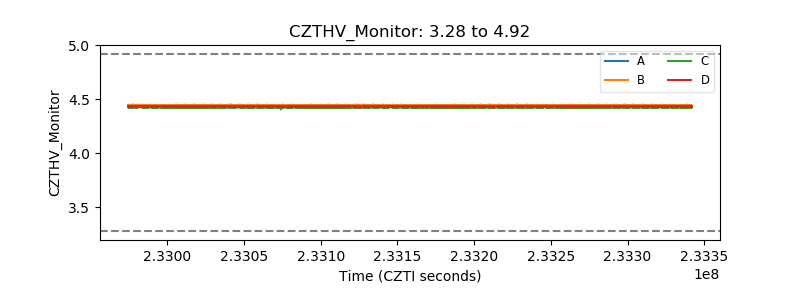 |
| D_VDD | 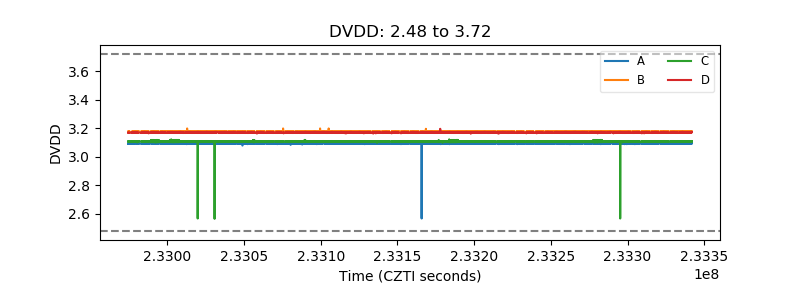 |
| Temperature 1 | 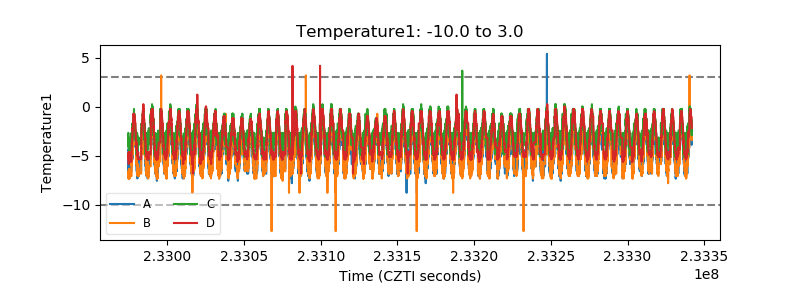 |
| Veto HV Monitor | 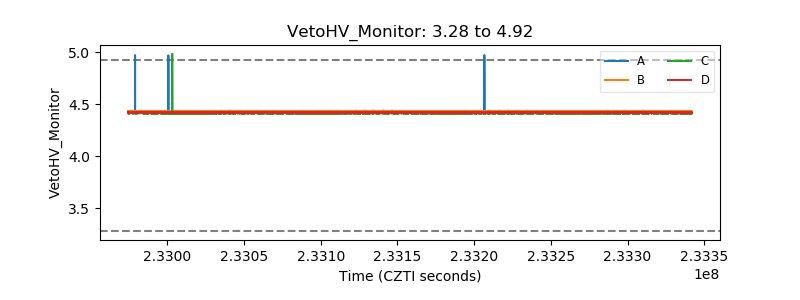 |
| Veto LLD | 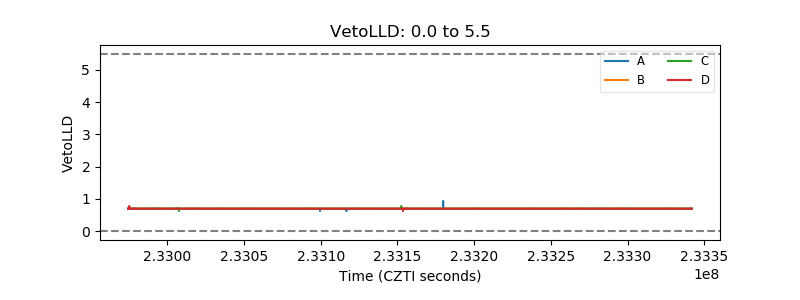 |
| Alpha Counter | 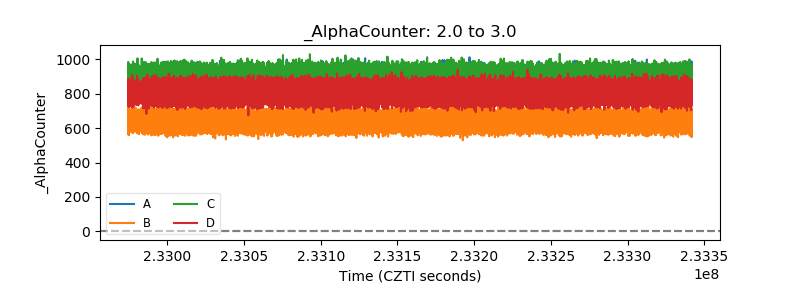 |
| _CPM_Rate | 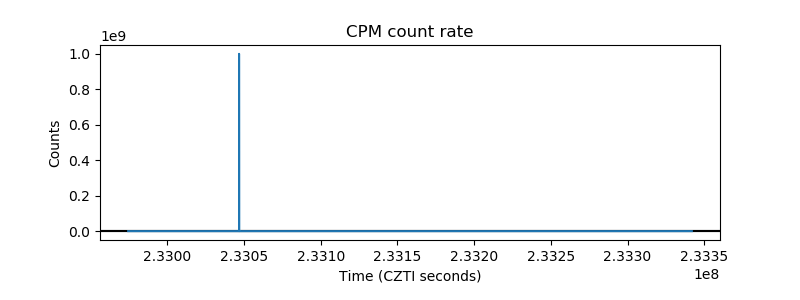 |
| CZT Counter | 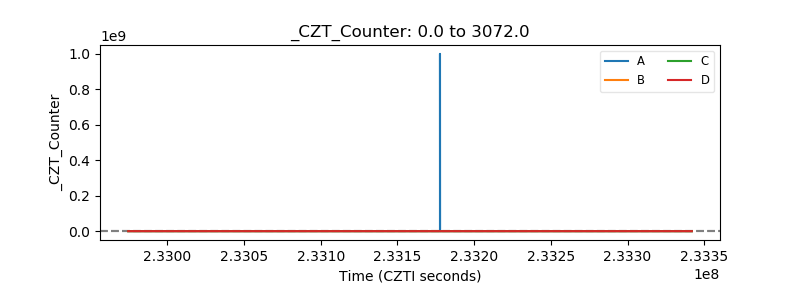 |
| +2.5 Volts monitor | 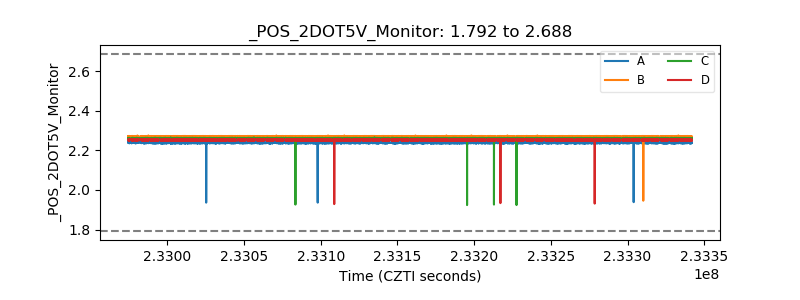 |
| +5 Volts monitor | 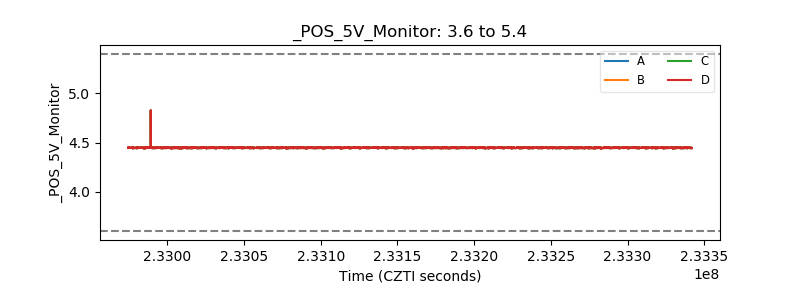 |
| _ROLL_ROT | 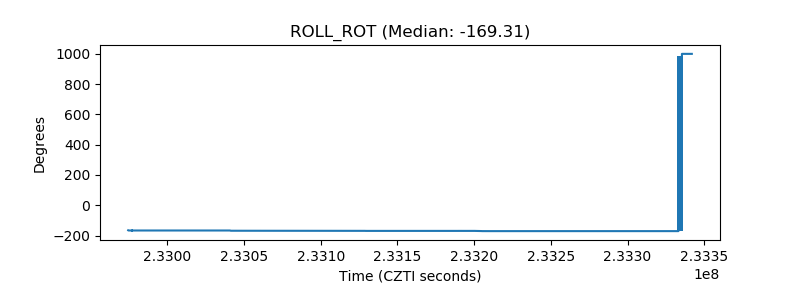 |
| _Roll_DEC | 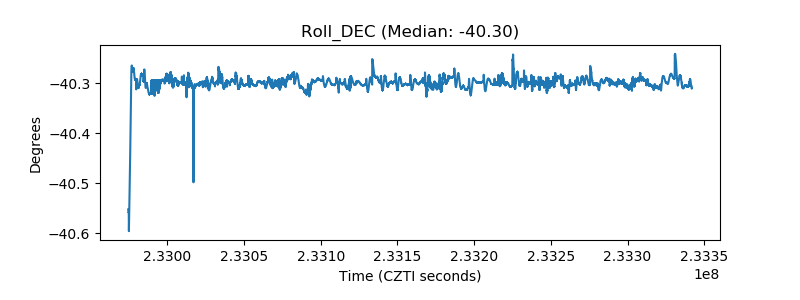 |
| _Roll_RA | 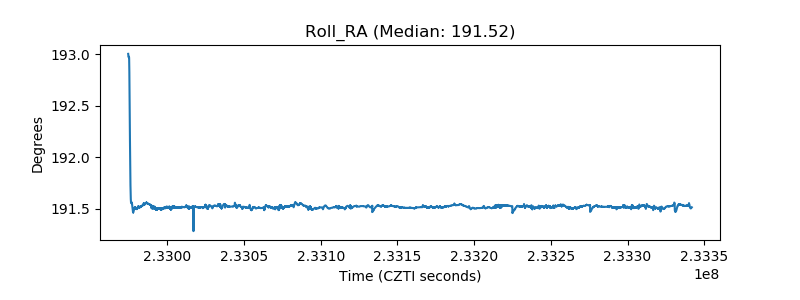 |
| Veto Counter | 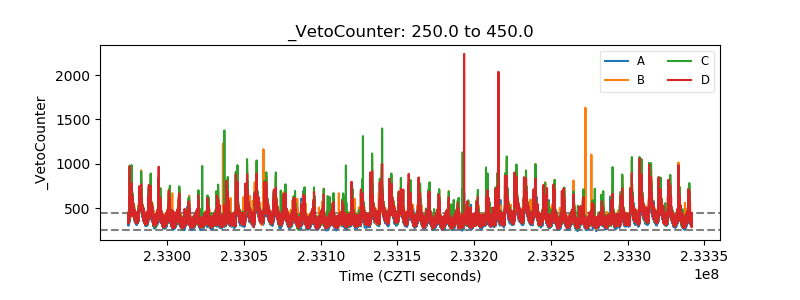 |