| Param | Original file | Final file |
|---|---|---|
| Filename | modeM0/AS1A03_092T01_9000001240_08886cztM0_level2.evt | modeM0/AS1A03_092T01_9000001240_08886cztM0_level2_quad_clean.evt |
| Size (bytes) | 173,738,880 | 31,150,080 |
| Size | 165.7 MB | 29.7 MB |
| Events in quadrant A | 1,359,115 | 197,799 |
| Events in quadrant B | 1,211,873 | 200,358 |
| Events in quadrant C | 1,193,765 | 193,615 |
| Events in quadrant D | 1,342,011 | 188,796 |
| Mode M9 | |||
|---|---|---|---|
| Quadrant | BADHDUFLAG | Total packets | Discarded packets |
| A | 0 | 13 | 0 |
| B | 0 | 13 | 0 |
| C | 0 | 13 | 0 |
| D | 0 | 13 | 0 |
| Mode SS | |||
|---|---|---|---|
| Quadrant | BADHDUFLAG | Total packets | Discarded packets |
| A | 0 | 46 | 0 |
| B | 0 | 46 | 0 |
| C | 0 | 46 | 0 |
| D | 0 | 46 | 0 |
| Mode M0 | |||
|---|---|---|---|
| Quadrant | BADHDUFLAG | Total packets | Discarded packets |
| A | 0 | 5545 | 23 |
| B | 0 | 5012 | 25 |
| C | 0 | 4966 | 20 |
| D | 0 | 5542 | 36 |
| Quadrant | Total seconds | Saturated seconds | Saturation percentage |
|---|---|---|---|
| A | 2252 | 98 | 4.351687% |
| B | 2249 | 94 | 4.179635% |
| C | 2251 | 80 | 3.553976% |
| D | 2247 | 85 | 3.782822% |
Noise dominated data is calculated using 1-second bins in cleaned event files. If a bin has >2000 counts, and if more than 50% of those come from <1% of pixels, then it is considered to be noise-dominated and hence unusable.
| Quadrant | # 1 sec bins | Bins with >0 counts | Bins with >2000 counts | High rate bins dominated by noise | Noise dominated (total time) | Noise dominated (detector-on time) | Marked lightcurve |
|---|---|---|---|---|---|---|---|
| A | 3505 | 2260 | 8 | 8 | 0.23% | 0.35% | 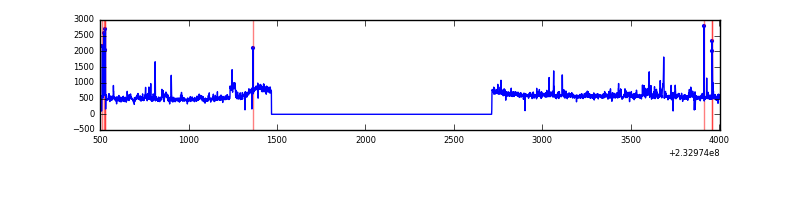 |
| B | 3505 | 2260 | 0 | 0 | 0.00% | 0.00% | 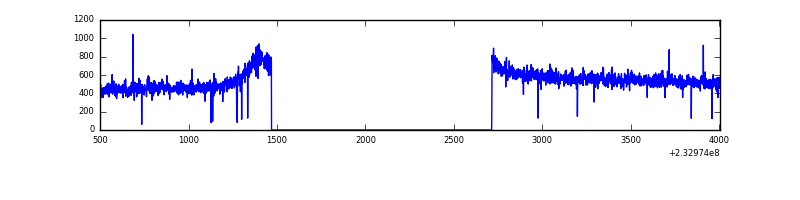 |
| C | 3504 | 2259 | 0 | 0 | 0.00% | 0.00% | 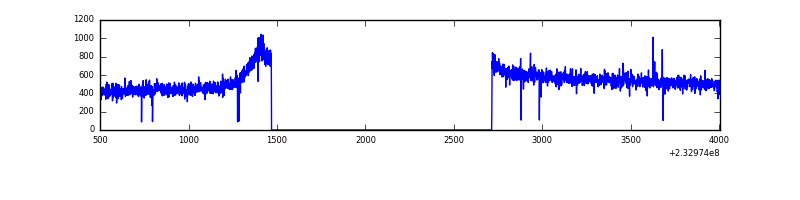 |
| D | 3505 | 2259 | 4 | 4 | 0.11% | 0.18% | 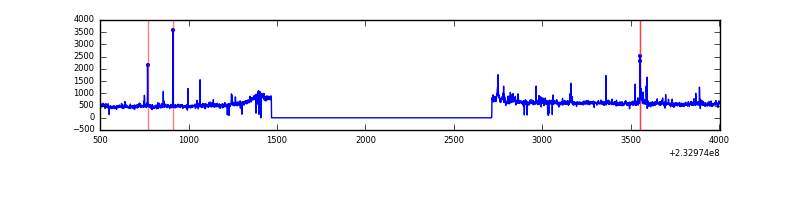 |
Top three noisy pixels from each quadrant. If the there are fewer than three noisy pixels in the level2.evt file, extra rows are filled as -1
| Pixel properties | Quadrant properties | ||||||
|---|---|---|---|---|---|---|---|
| Quadrant | DetID | PixID | Counts | Sigma | Mean | Median | Sigma |
| A | 8 | 5 | 113952 | 1739.81 | 313 | 306 | 65.3 |
| A | 15 | 174 | 28279 | 428.24 | 313 | 306 | 65.3 |
| A | 5 | 16 | 13024 | 194.7 | 313 | 306 | 65.3 |
| B | 12 | 111 | 6589 | 104.82 | 310 | 304 | 60.0 |
| B | 11 | 111 | 5327 | 83.77 | 310 | 304 | 60.0 |
| B | 14 | 111 | 4095 | 63.22 | 310 | 304 | 60.0 |
| C | 12 | 4 | 5179 | 68.64 | 304 | 305 | 71.0 |
| C | 13 | 61 | 2329 | 28.5 | 304 | 305 | 71.0 |
| C | 3 | 202 | 772 | 6.58 | 304 | 305 | 71.0 |
| D | 8 | 195 | 114045 | 1468.57 | 303 | 296 | 77.5 |
| D | 2 | 136 | 28621 | 365.69 | 303 | 296 | 77.5 |
| D | 2 | 14 | 26455 | 337.73 | 303 | 296 | 77.5 |
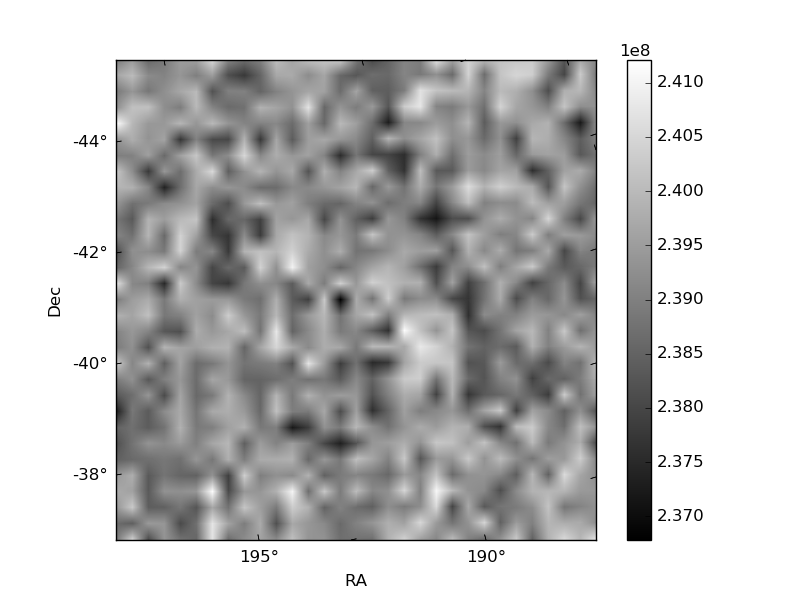
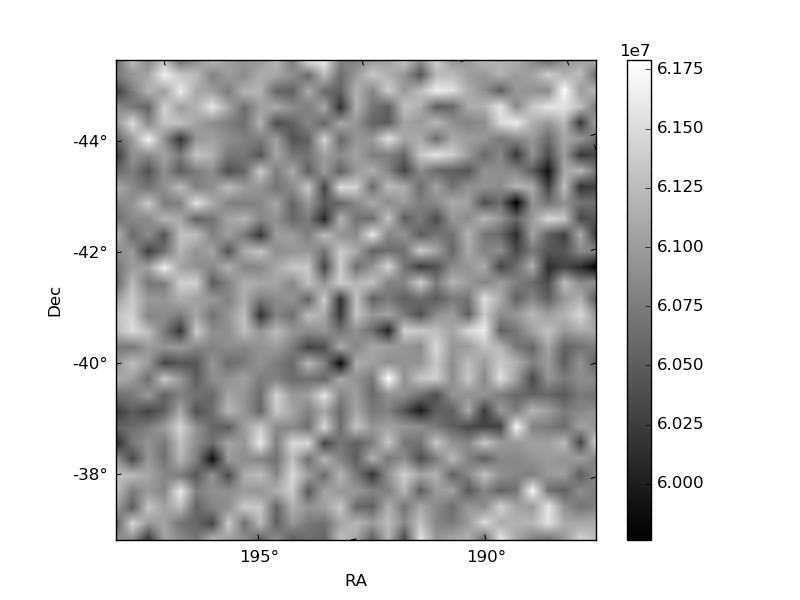
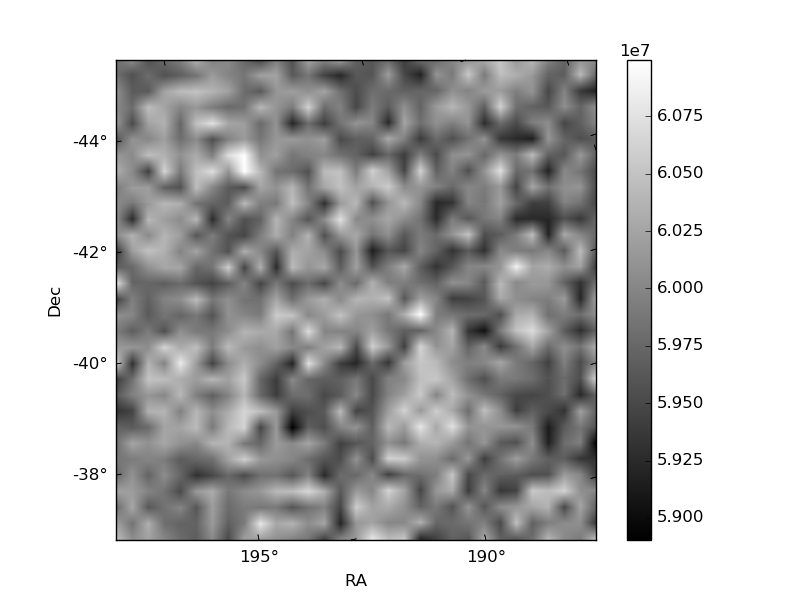
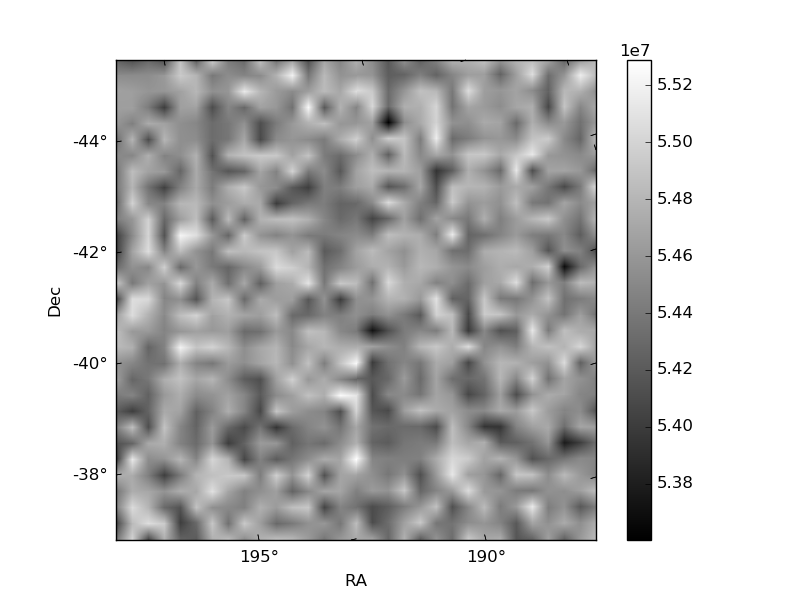
Histogram calculated using DETX and DETY for each event in the final _common_clean file
| Quadrant A | 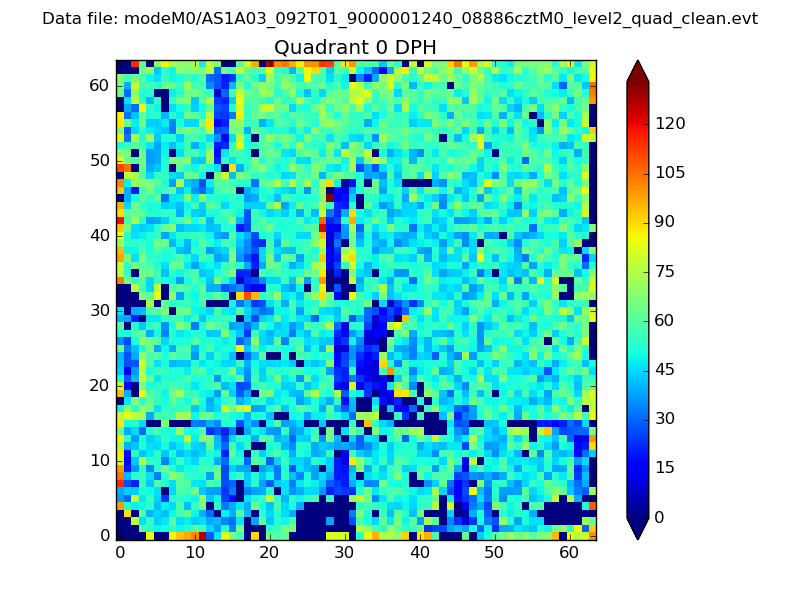 |
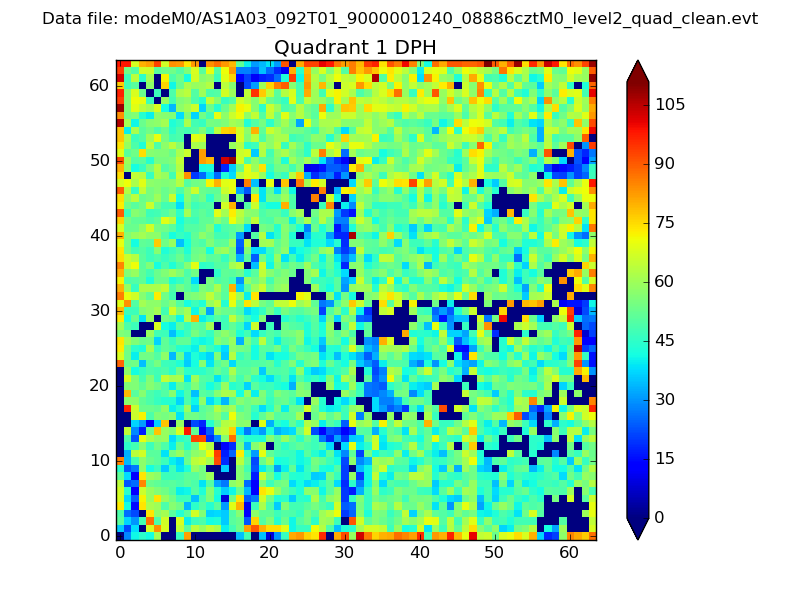 |
Quadrant B |
|---|---|---|---|
| Quadrant D | 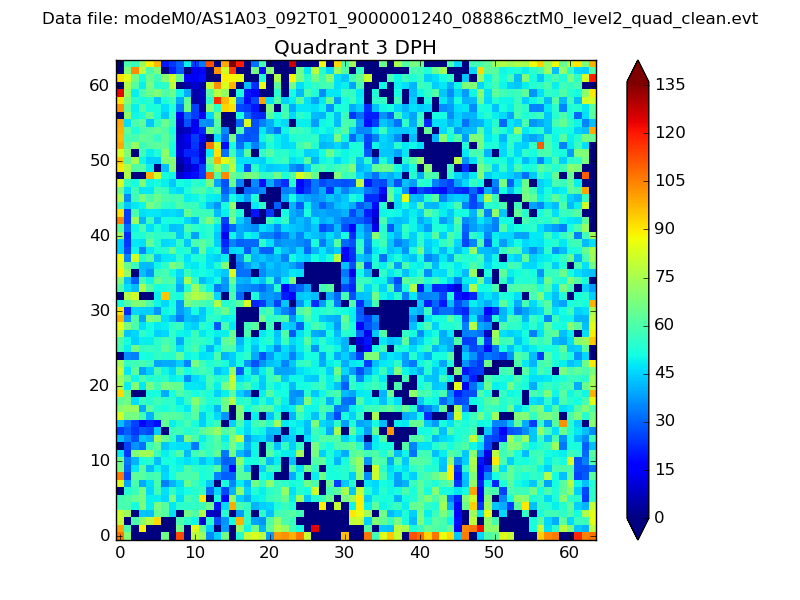 |
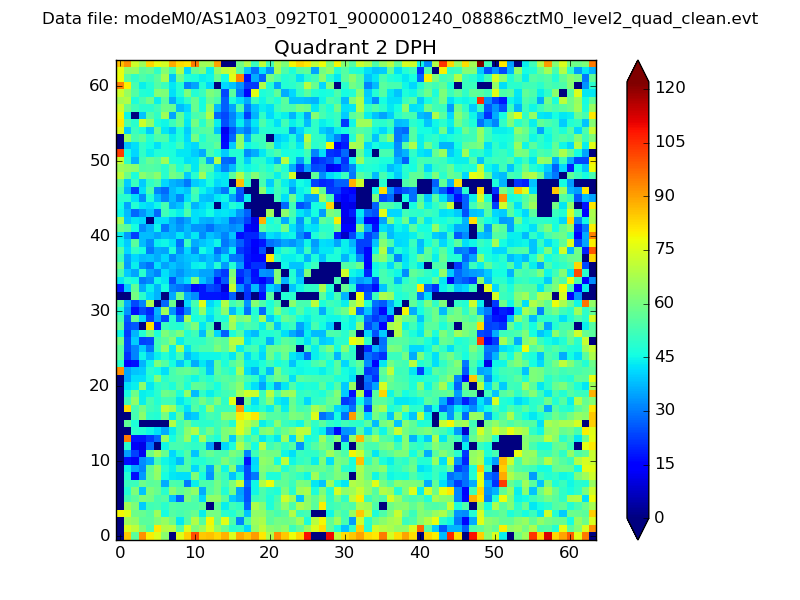 |
Quadrant C |
| Plot type | Count rate plots | Images |
|---|---|---|
| Comparison with Poisson distribution Blue bars denote a histogram of data divided into 1 sec bins. Red curve is a Poisson curve with rate = median count rate of data. |
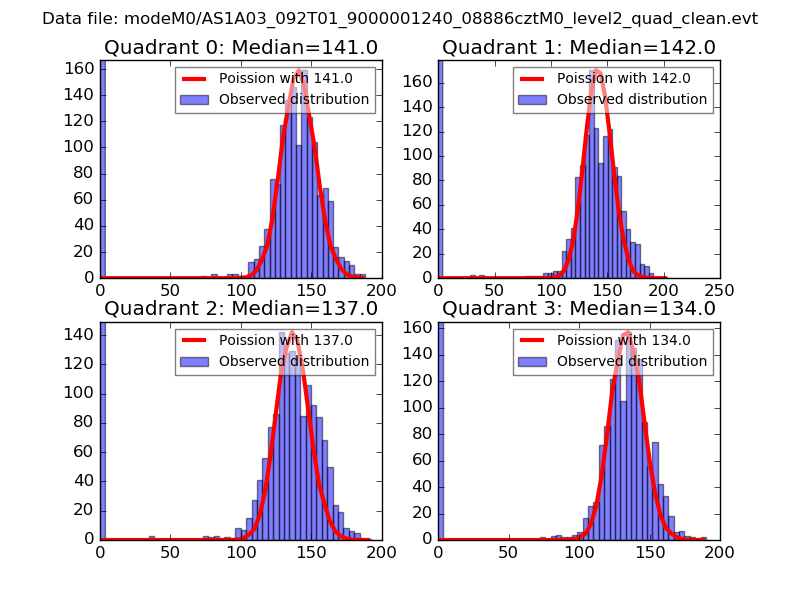 |
 |
| Quadrant-wise count rates Data is divided into 100 sec bins |
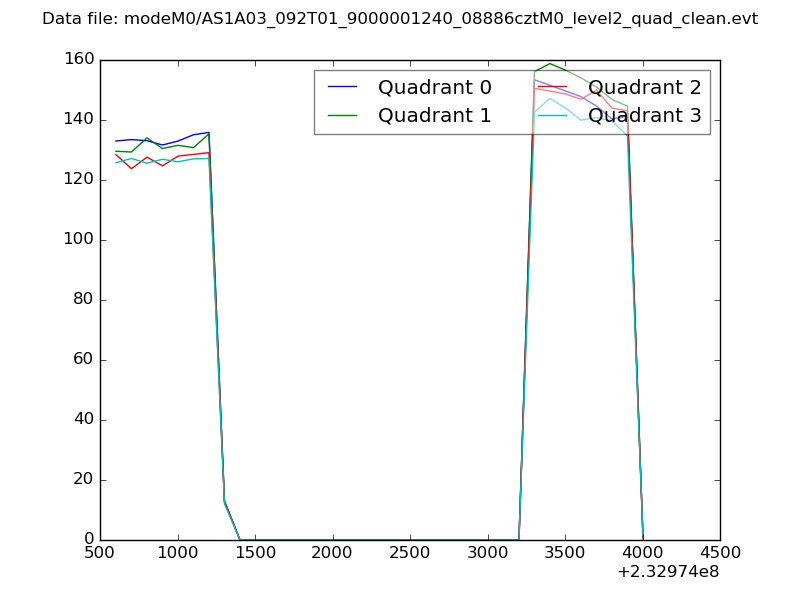 |
|
| Module-wise count rates for Quadrant A Data is divided into 100 sec bins |
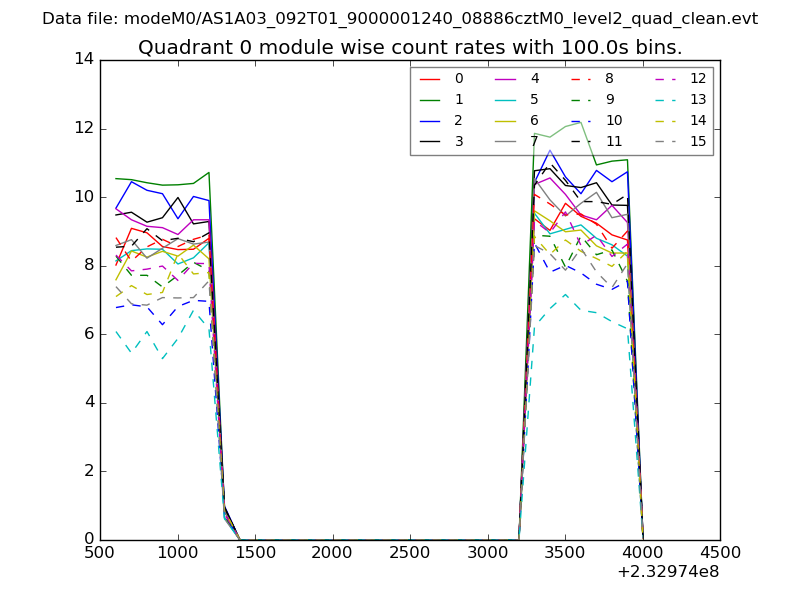 |
 |
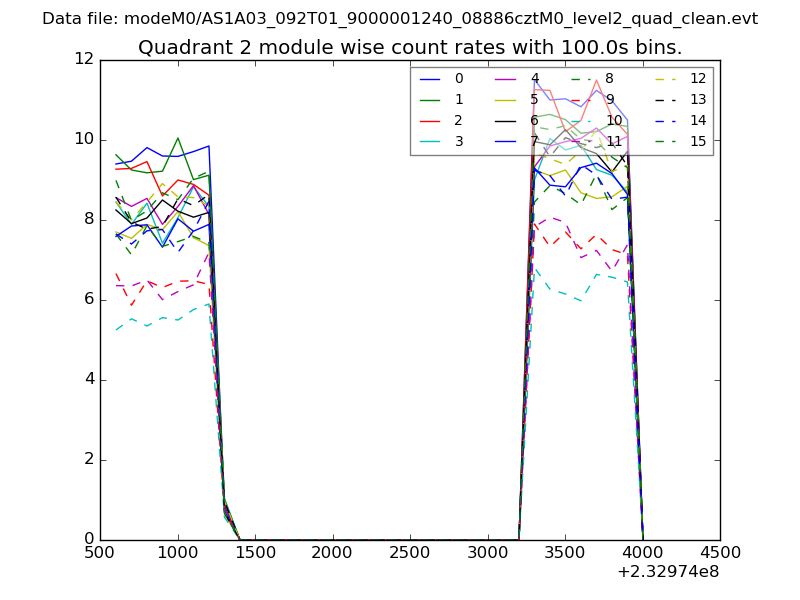
| Module-wise count rates for Quadrant B Data is divided into 100 sec bins |
 |
 |
| Module-wise count rates for Quadrant C Data is divided into 100 sec bins |
 |
 |
| Module-wise count rates for Quadrant D Data is divided into 100 sec bins |
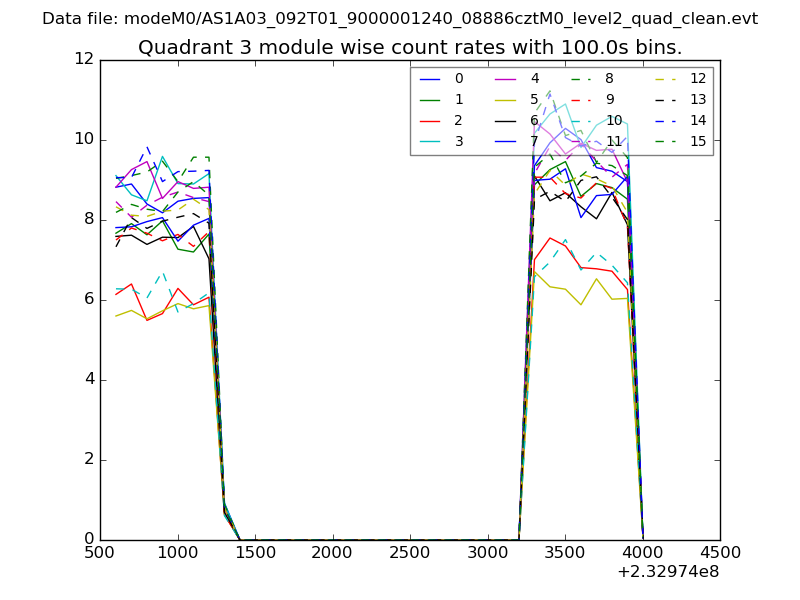 |
 |
| Parameter | Plot |
|---|---|
| CZT HV Monitor | 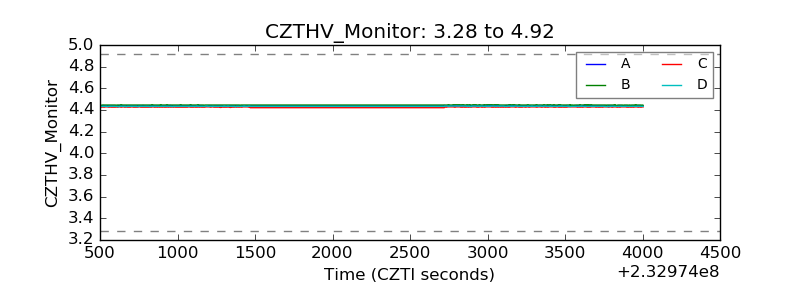 |
| D_VDD | 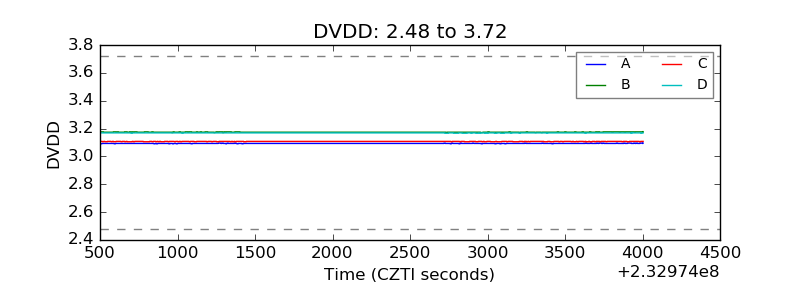 |
| Temperature 1 |  |
| Veto HV Monitor | 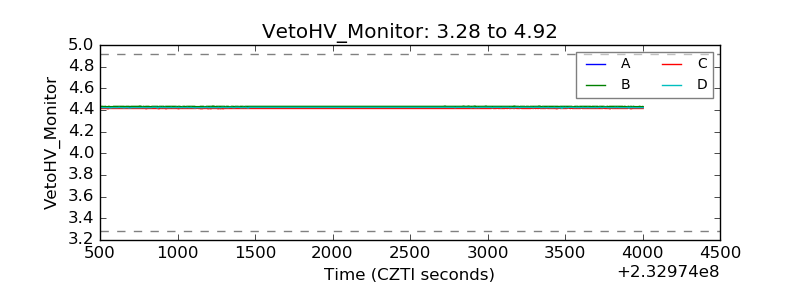 |
| Veto LLD | 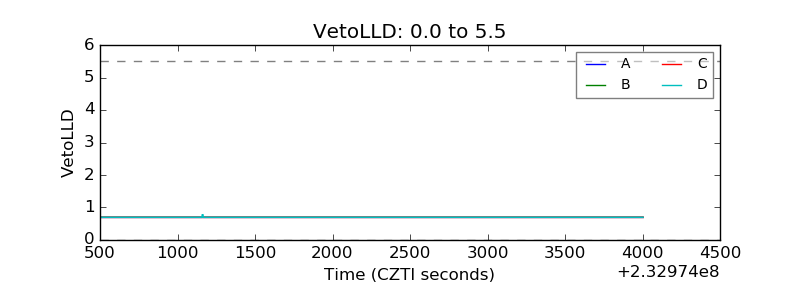 |
| Alpha Counter | 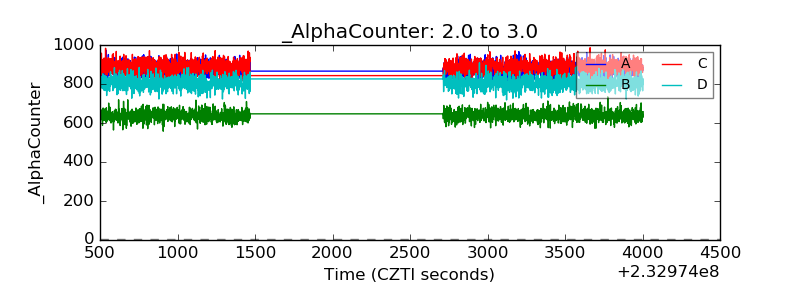 |
| _CPM_Rate | 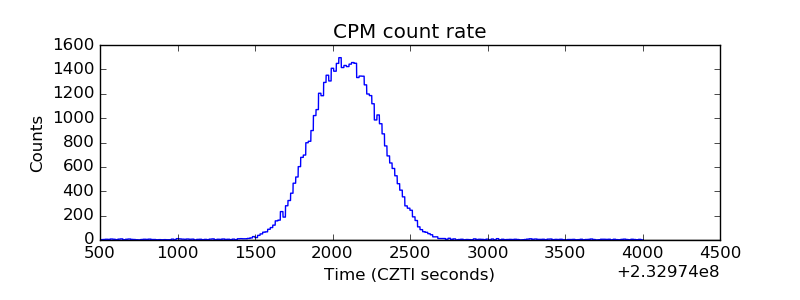 |
| CZT Counter | 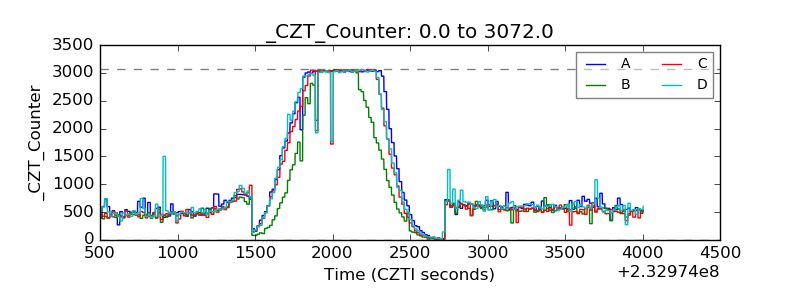 |
| +2.5 Volts monitor |  |
| +5 Volts monitor | 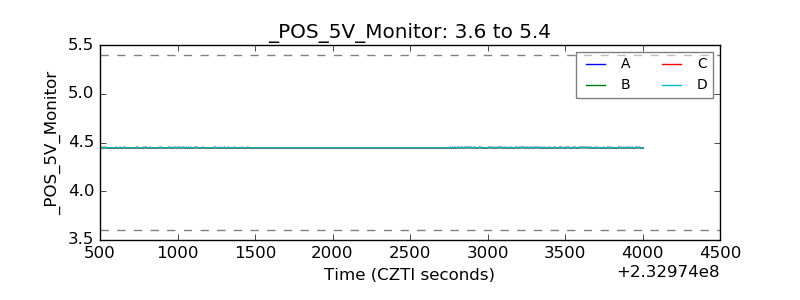 |
| _ROLL_ROT | 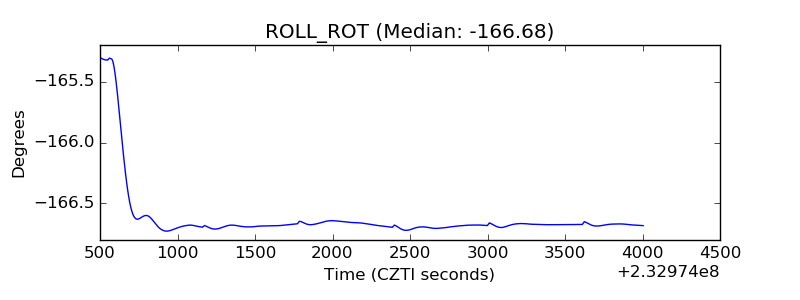 |
| _Roll_DEC | 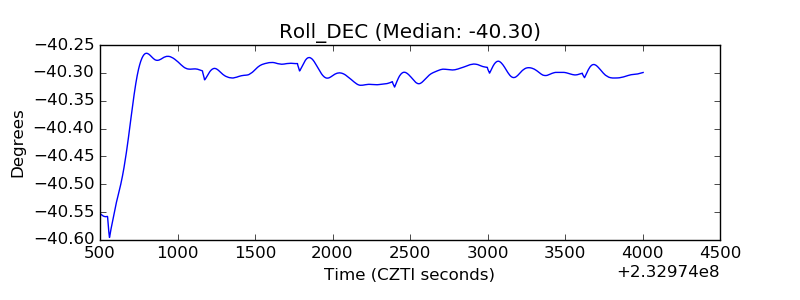 |
| _Roll_RA | 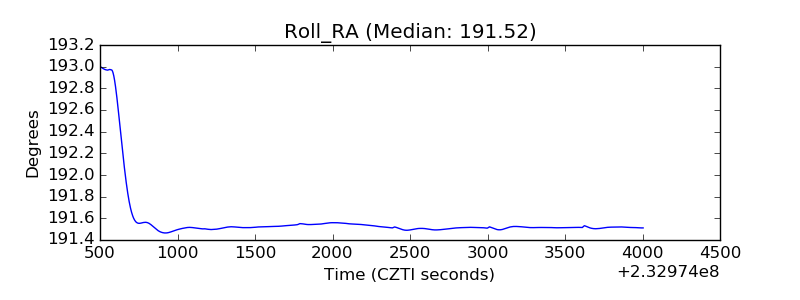 |
| Veto Counter | 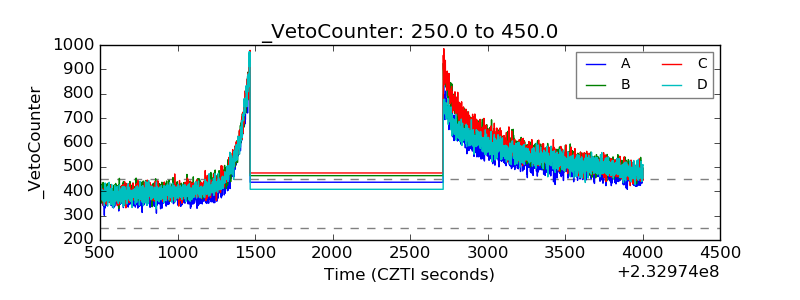 |