| Param | Original file | Final file |
|---|---|---|
| Filename | modeM0/AS1A03_092T01_9000001240_08887cztM0_level2.evt | modeM0/AS1A03_092T01_9000001240_08887cztM0_level2_quad_clean.evt |
| Size (bytes) | 117,696,960 | 31,000,320 |
| Size | 112.2 MB | 29.6 MB |
| Events in quadrant A | 894,608 | 200,603 |
| Events in quadrant B | 833,915 | 211,597 |
| Events in quadrant C | 772,684 | 207,292 |
| Events in quadrant D | 945,342 | 194,962 |
| Mode M9 | |||
|---|---|---|---|
| Quadrant | BADHDUFLAG | Total packets | Discarded packets |
| A | 0 | 19 | 14 |
| B | 0 | 15 | 8 |
| C | 0 | 19 | 13 |
| D | 0 | 18 | 11 |
| Mode SS | |||
|---|---|---|---|
| Quadrant | BADHDUFLAG | Total packets | Discarded packets |
| A | 0 | 119 | 85 |
| B | 0 | 121 | 87 |
| C | 0 | 120 | 82 |
| D | 0 | 118 | 86 |
| Mode M0 | |||
|---|---|---|---|
| Quadrant | BADHDUFLAG | Total packets | Discarded packets |
| A | 0 | 13586 | 10010 |
| B | 0 | 12537 | 8984 |
| C | 0 | 12269 | 8767 |
| D | 0 | 14025 | 10256 |
| Quadrant | Total seconds | Saturated seconds | Saturation percentage |
|---|---|---|---|
| A | 1623 | 17 | 1.047443% |
| B | 1701 | 12 | 0.705467% |
| C | 1718 | 4 | 0.232829% |
| D | 1654 | 15 | 0.906892% |
Noise dominated data is calculated using 1-second bins in cleaned event files. If a bin has >2000 counts, and if more than 50% of those come from <1% of pixels, then it is considered to be noise-dominated and hence unusable.
| Quadrant | # 1 sec bins | Bins with >0 counts | Bins with >2000 counts | High rate bins dominated by noise | Noise dominated (total time) | Noise dominated (detector-on time) | Marked lightcurve |
|---|---|---|---|---|---|---|---|
| A | 6360 | 2151 | 1 | 1 | 0.02% | 0.05% | 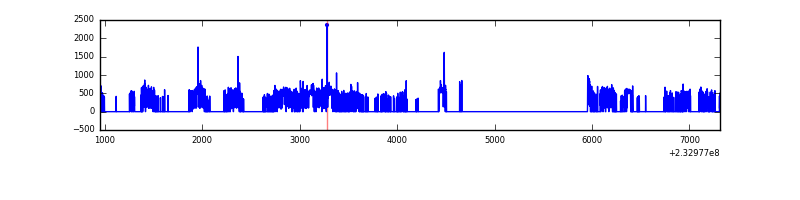 |
| B | 6357 | 2226 | 1 | 1 | 0.02% | 0.04% | 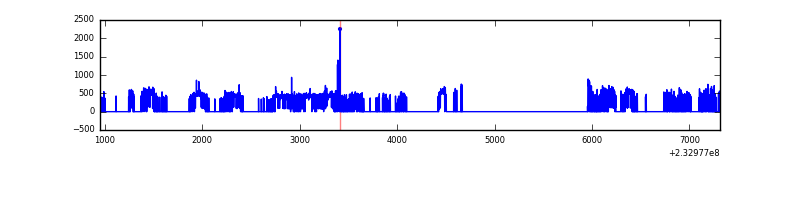 |
| C | 6352 | 2265 | 0 | 0 | 0.00% | 0.00% |  |
| D | 6352 | 2186 | 5 | 5 | 0.08% | 0.23% | 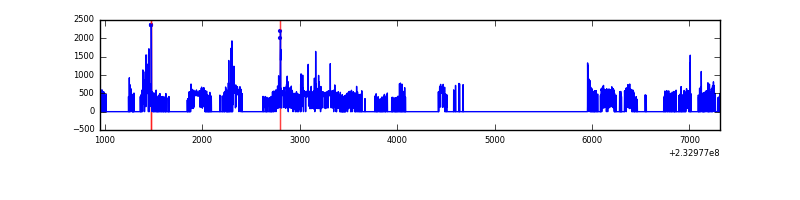 |
Top three noisy pixels from each quadrant. If the there are fewer than three noisy pixels in the level2.evt file, extra rows are filled as -1
| Pixel properties | Quadrant properties | ||||||
|---|---|---|---|---|---|---|---|
| Quadrant | DetID | PixID | Counts | Sigma | Mean | Median | Sigma |
| A | 8 | 5 | 111625 | 2672.33 | 198 | 194 | 41.7 |
| A | 0 | 128 | 9339 | 219.32 | 198 | 194 | 41.7 |
| A | 15 | 174 | 4492 | 103.07 | 198 | 194 | 41.7 |
| B | 0 | 214 | 12458 | 302.13 | 206 | 202 | 40.6 |
| B | 4 | 80 | 6504 | 155.35 | 206 | 202 | 40.6 |
| B | 12 | 111 | 4008 | 93.82 | 206 | 202 | 40.6 |
| C | 13 | 61 | 1455 | 27.09 | 197 | 198 | 46.4 |
| C | 12 | 4 | 984 | 16.94 | 197 | 198 | 46.4 |
| C | 1 | 3 | 634 | 9.4 | 197 | 198 | 46.4 |
| D | 8 | 195 | 99635 | 1962.92 | 191 | 186 | 50.7 |
| D | 1 | 52 | 25246 | 494.63 | 191 | 186 | 50.7 |
| D | 12 | 233 | 21980 | 430.17 | 191 | 186 | 50.7 |
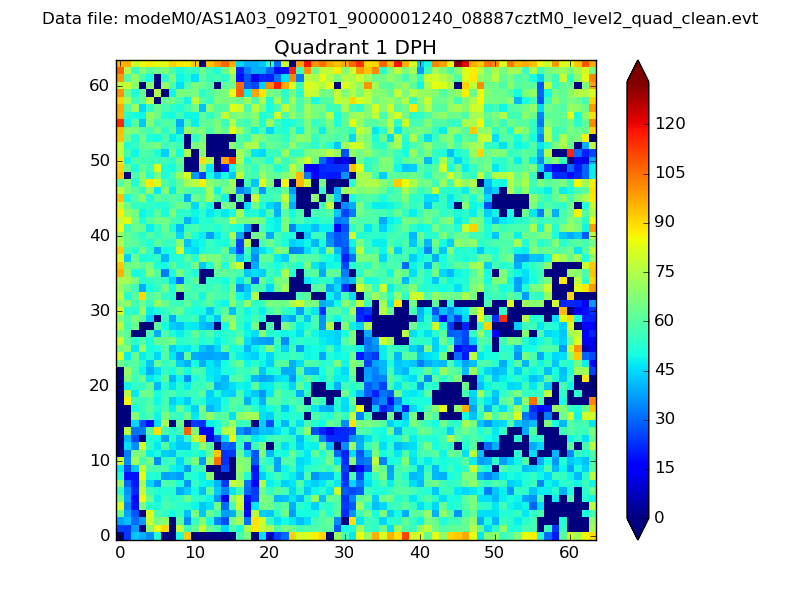
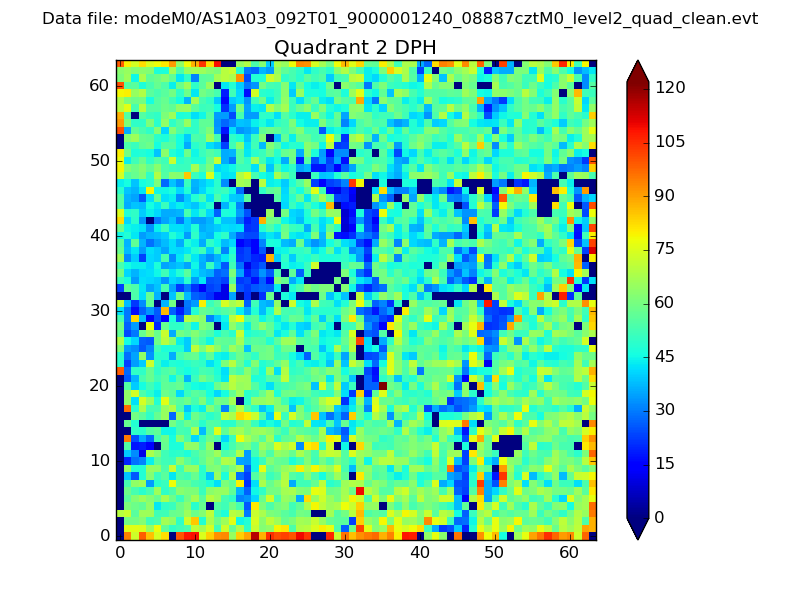
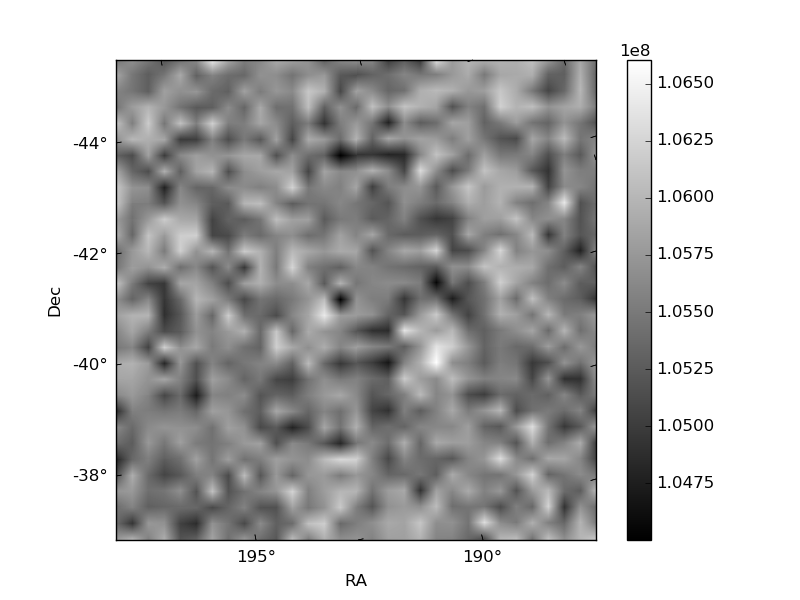
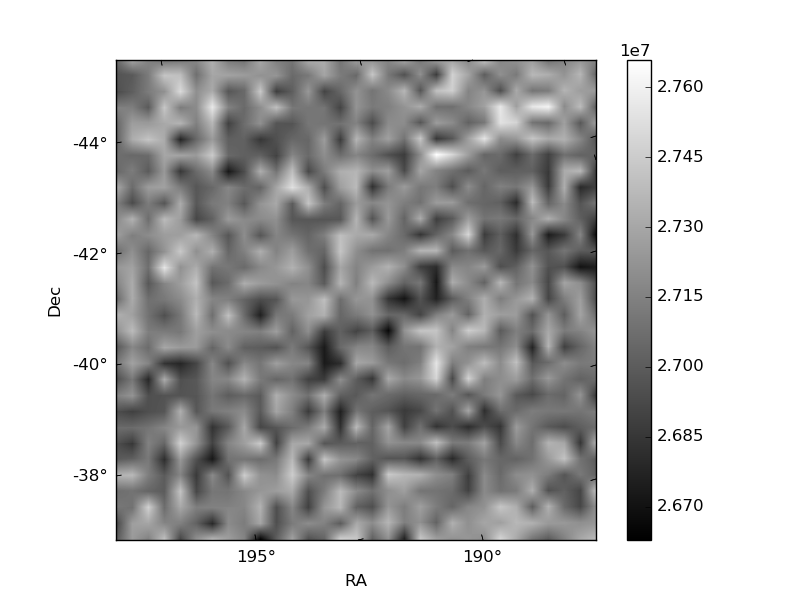
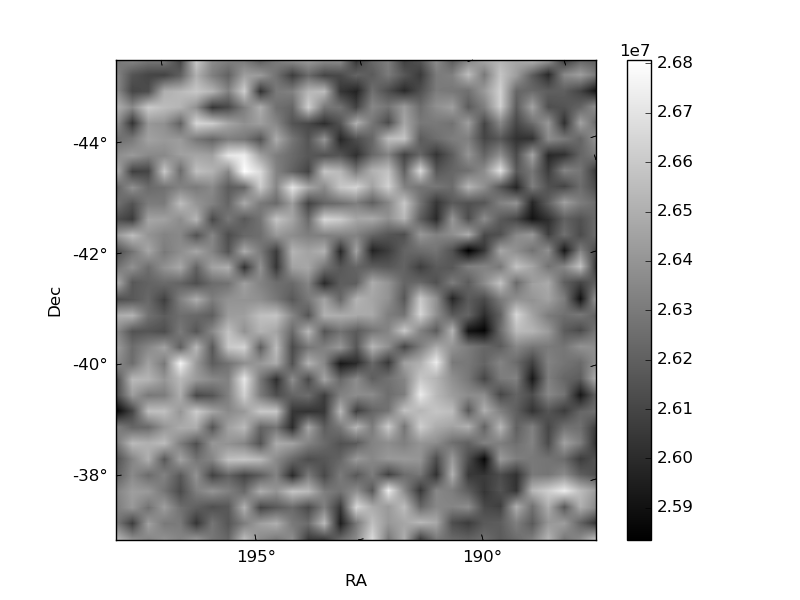
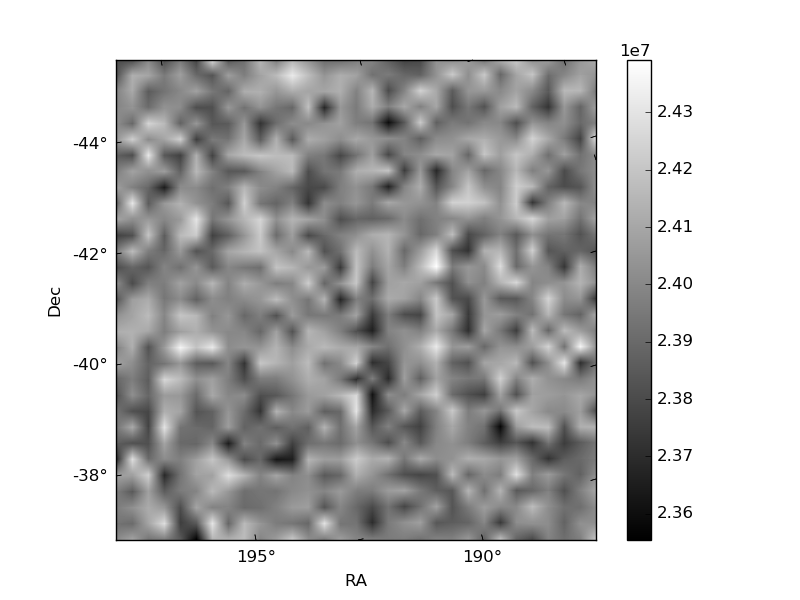
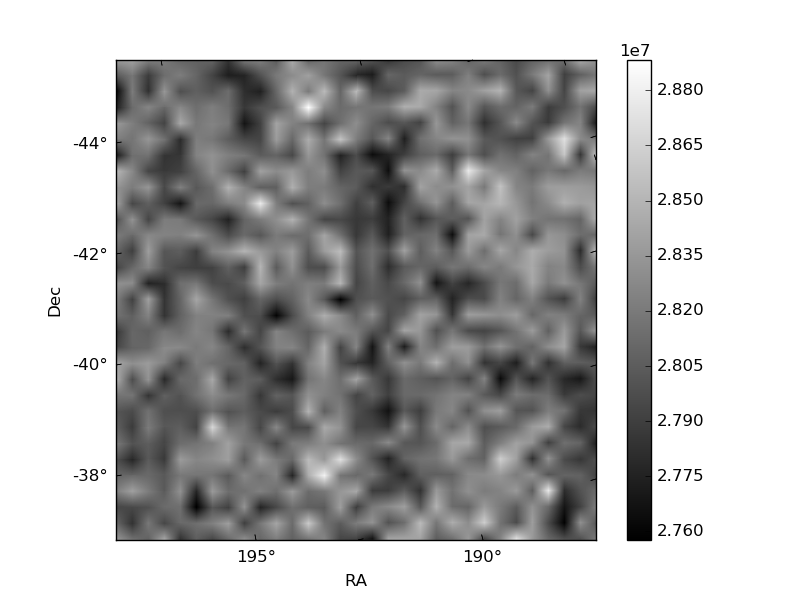
Histogram calculated using DETX and DETY for each event in the final _common_clean file
| Quadrant A | 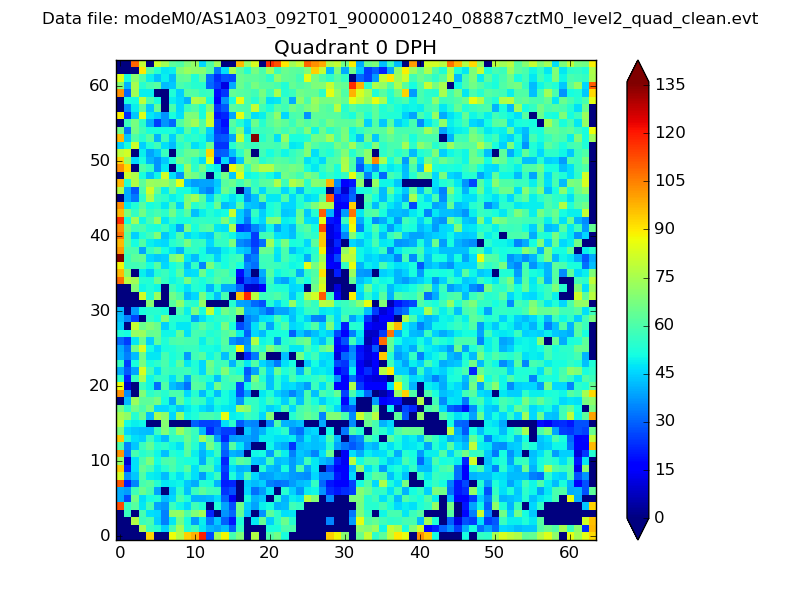 |
 |
Quadrant B |
|---|---|---|---|
| Quadrant D | 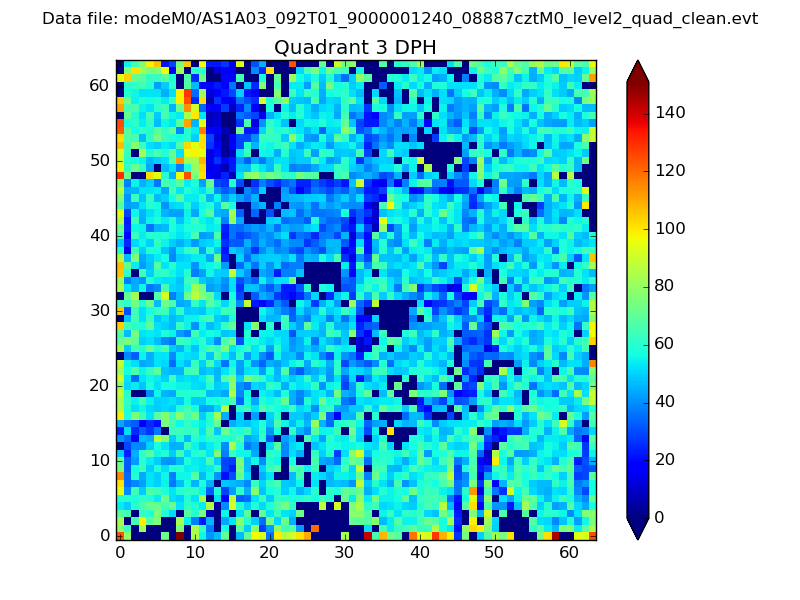 |
 |
Quadrant C |
| Plot type | Count rate plots | Images |
|---|---|---|
| Comparison with Poisson distribution Blue bars denote a histogram of data divided into 1 sec bins. Red curve is a Poisson curve with rate = median count rate of data. |
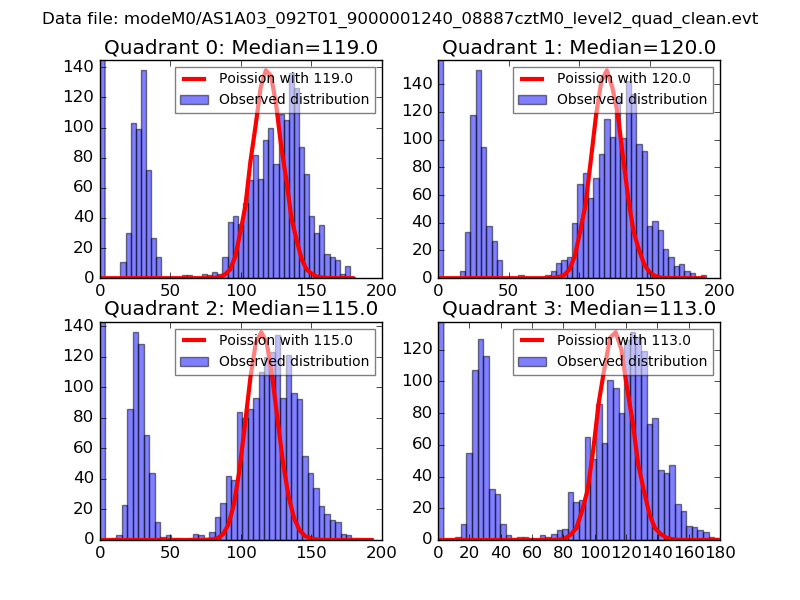 |
 |
| Quadrant-wise count rates Data is divided into 100 sec bins |
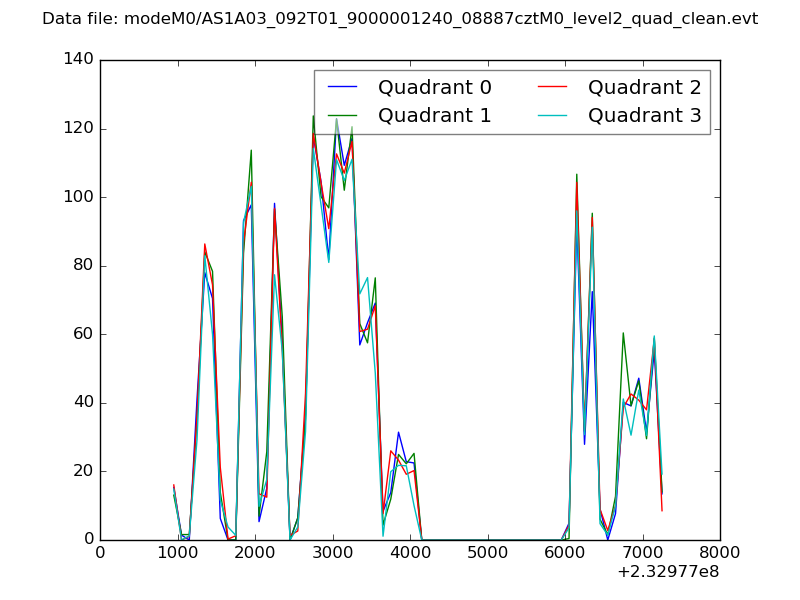 |
|
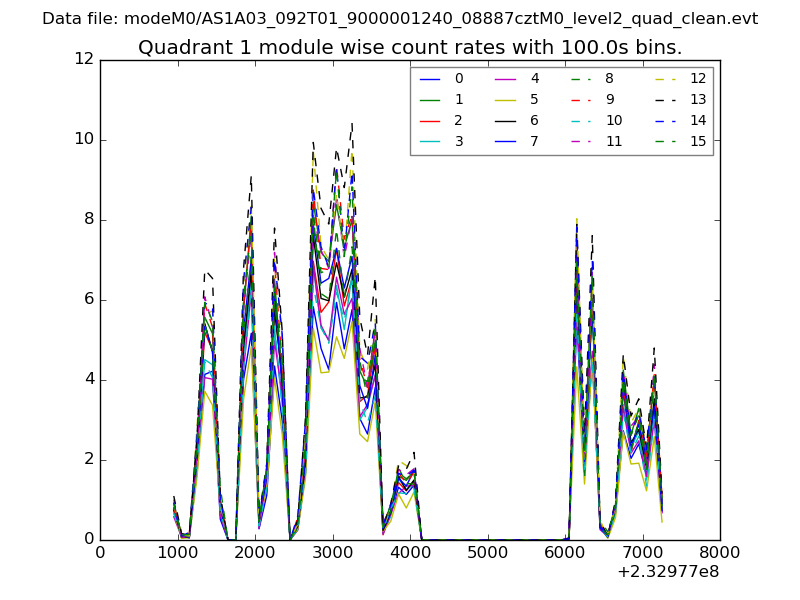
| Module-wise count rates for Quadrant A Data is divided into 100 sec bins |
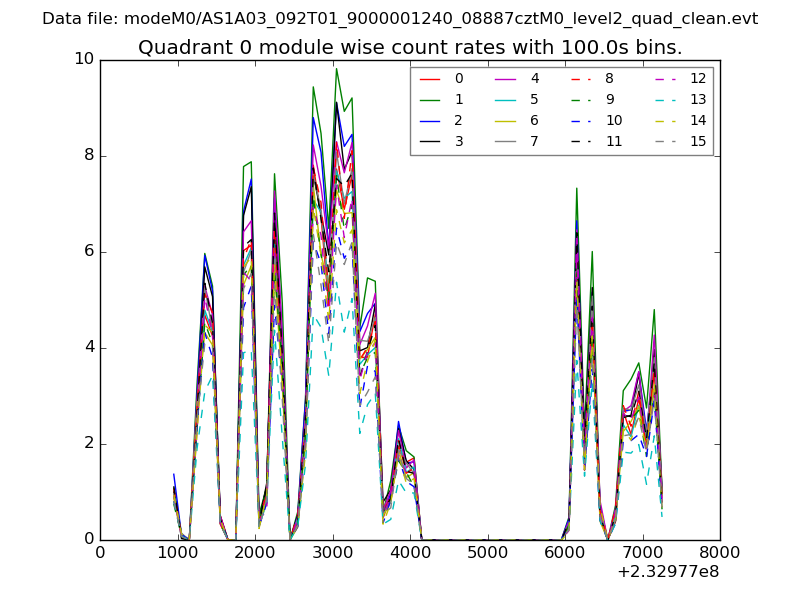 |
 |
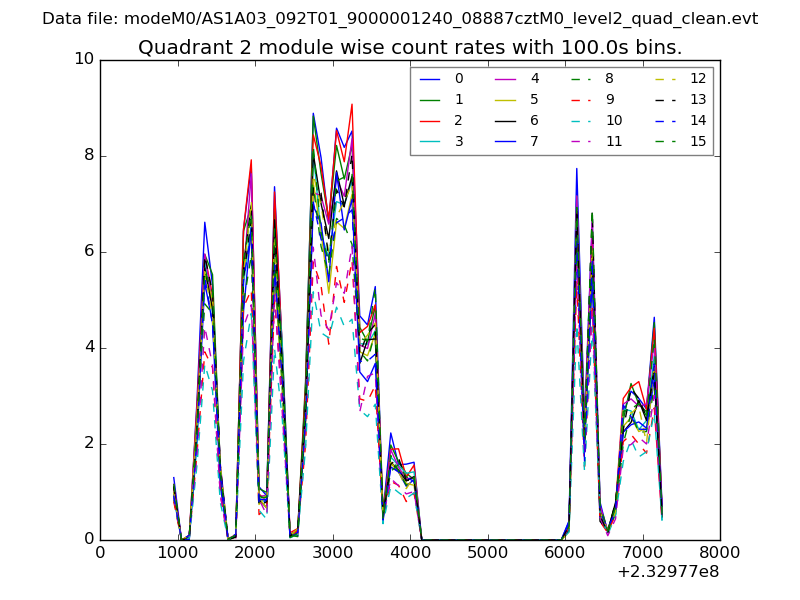
| Module-wise count rates for Quadrant B Data is divided into 100 sec bins |
 |
 |
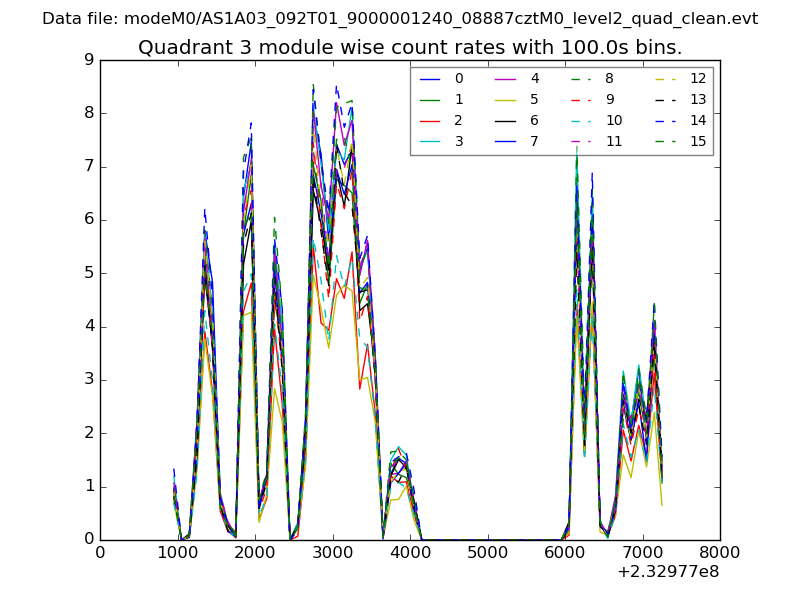
| Module-wise count rates for Quadrant C Data is divided into 100 sec bins |
 |
 |
| Module-wise count rates for Quadrant D Data is divided into 100 sec bins |
 |
 |
| Parameter | Plot |
|---|---|
| CZT HV Monitor | 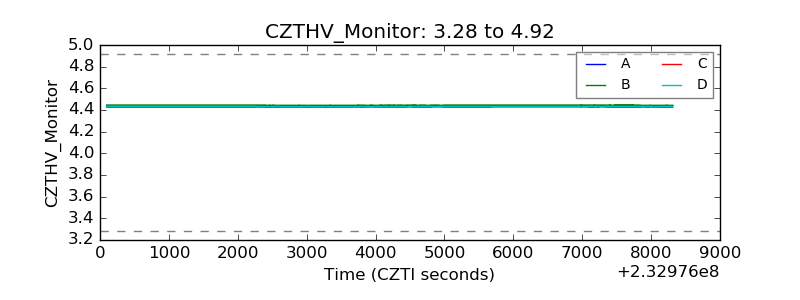 |
| D_VDD | 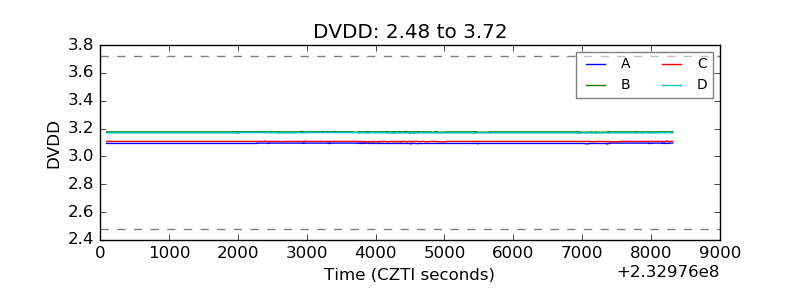 |
| Temperature 1 | 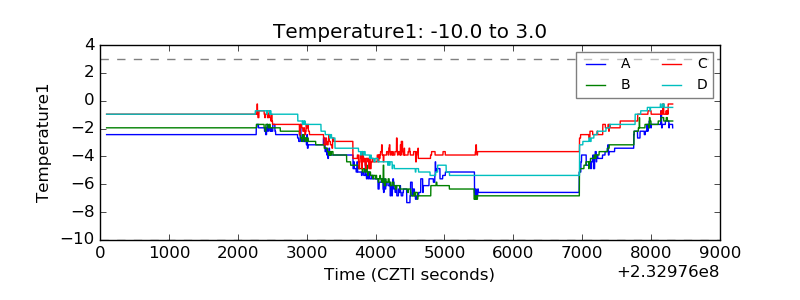 |
| Veto HV Monitor | 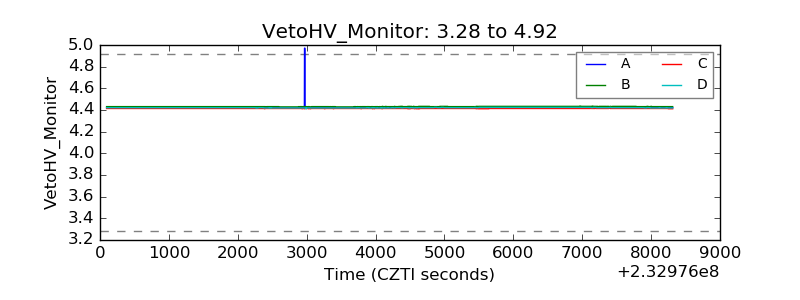 |
| Veto LLD | 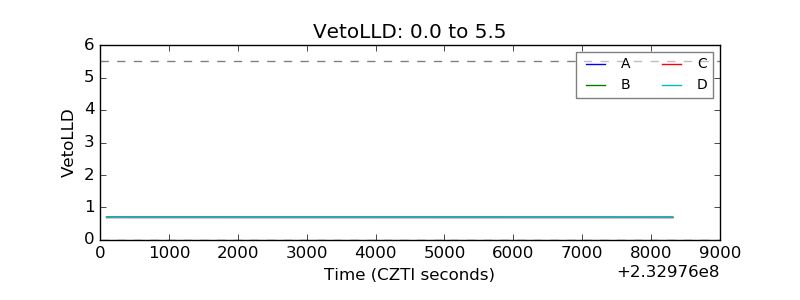 |
| Alpha Counter | 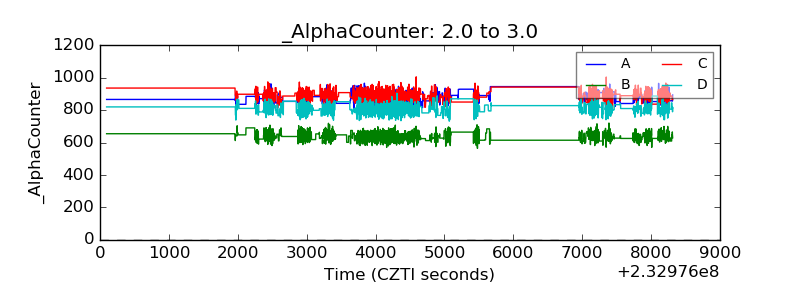 |
| _CPM_Rate | 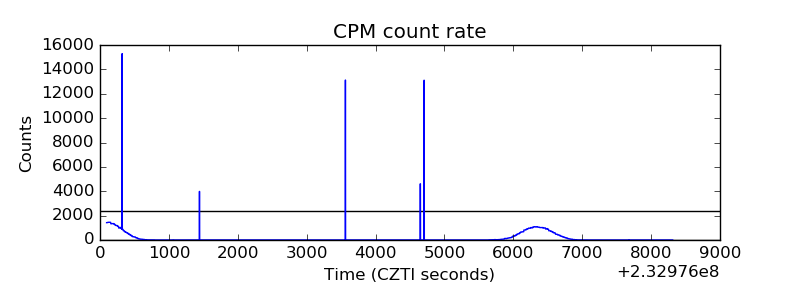 |
| CZT Counter | 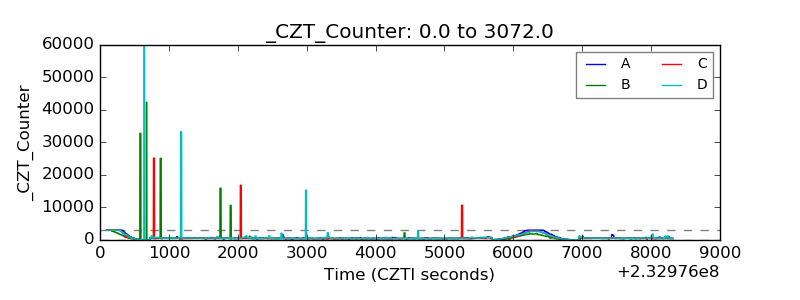 |
| +2.5 Volts monitor |  |
| +5 Volts monitor |  |
| _ROLL_ROT | 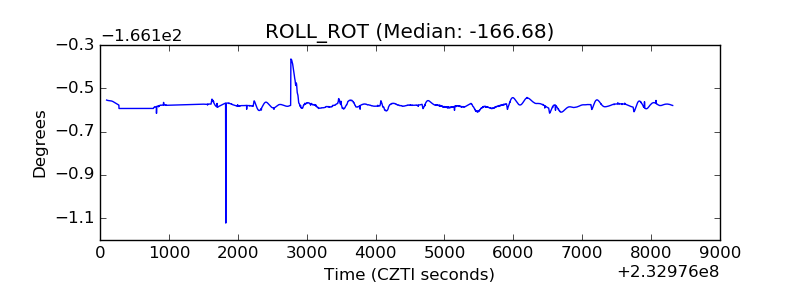 |
| _Roll_DEC | 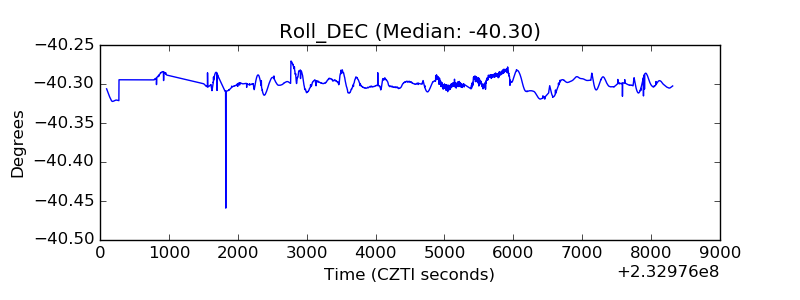 |
| _Roll_RA | 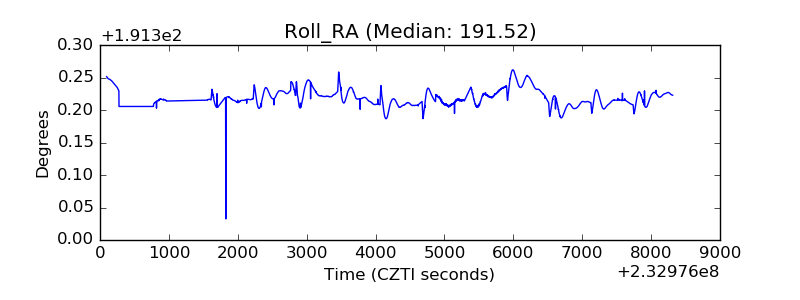 |
| Veto Counter | 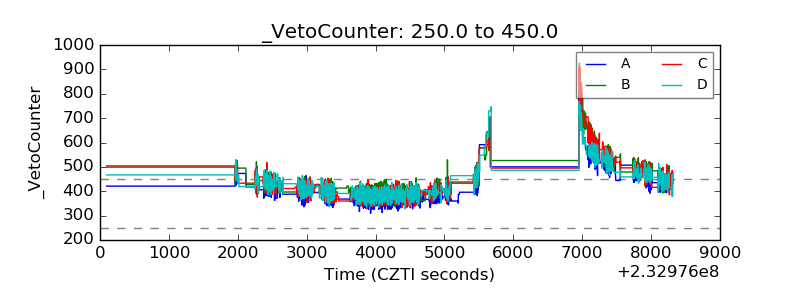 |