| Param | Original file | Final file |
|---|---|---|
| Filename | modeM0/AS1A03_092T01_9000001240_08888cztM0_level2.evt | modeM0/AS1A03_092T01_9000001240_08888cztM0_level2_quad_clean.evt |
| Size (bytes) | 474,929,280 | 109,681,920 |
| Size | 452.9 MB | 104.6 MB |
| Events in quadrant A | 3,363,973 | 733,236 |
| Events in quadrant B | 3,307,591 | 736,759 |
| Events in quadrant C | 2,976,011 | 711,587 |
| Events in quadrant D | 4,298,826 | 691,582 |
| Mode M9 | |||
|---|---|---|---|
| Quadrant | BADHDUFLAG | Total packets | Discarded packets |
| A | 0 | 12 | 0 |
| B | 0 | 12 | 0 |
| C | 0 | 12 | 0 |
| D | 0 | 12 | 0 |
| Mode SS | |||
|---|---|---|---|
| Quadrant | BADHDUFLAG | Total packets | Discarded packets |
| A | 0 | 130 | 0 |
| B | 0 | 130 | 0 |
| C | 0 | 130 | 0 |
| D | 0 | 130 | 0 |
| Mode M0 | |||
|---|---|---|---|
| Quadrant | BADHDUFLAG | Total packets | Discarded packets |
| A | 0 | 13985 | 2 |
| B | 0 | 13898 | 1 |
| C | 0 | 13248 | 1 |
| D | 0 | 16771 | 1 |
| Quadrant | Total seconds | Saturated seconds | Saturation percentage |
|---|---|---|---|
| A | 6434 | 124 | 1.927261% |
| B | 6434 | 113 | 1.756295% |
| C | 6434 | 66 | 1.025800% |
| D | 6434 | 193 | 2.999689% |
Noise dominated data is calculated using 1-second bins in cleaned event files. If a bin has >2000 counts, and if more than 50% of those come from <1% of pixels, then it is considered to be noise-dominated and hence unusable.
| Quadrant | # 1 sec bins | Bins with >0 counts | Bins with >2000 counts | High rate bins dominated by noise | Noise dominated (total time) | Noise dominated (detector-on time) | Marked lightcurve |
|---|---|---|---|---|---|---|---|
| A | 7634 | 6435 | 21 | 21 | 0.28% | 0.33% | 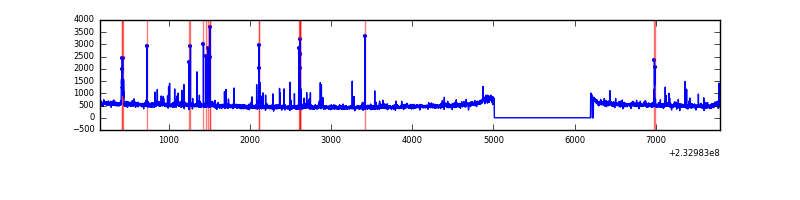 |
| B | 7634 | 6435 | 3 | 3 | 0.04% | 0.05% | 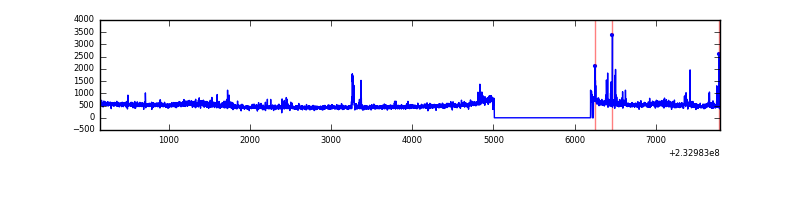 |
| C | 7634 | 6435 | 0 | 0 | 0.00% | 0.00% | 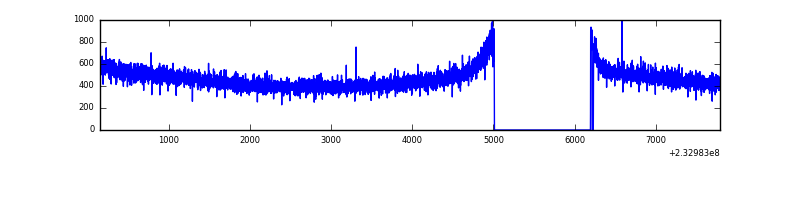 |
| D | 7634 | 6435 | 79 | 79 | 1.03% | 1.23% | 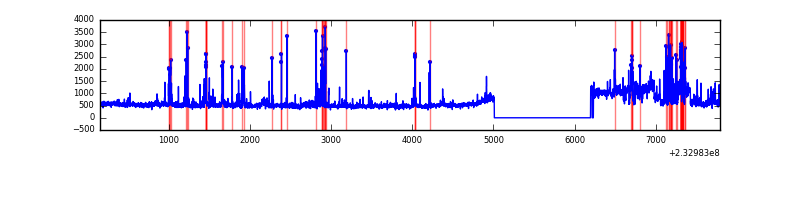 |
Top three noisy pixels from each quadrant. If the there are fewer than three noisy pixels in the level2.evt file, extra rows are filled as -1
| Pixel properties | Quadrant properties | ||||||
|---|---|---|---|---|---|---|---|
| Quadrant | DetID | PixID | Counts | Sigma | Mean | Median | Sigma |
| A | 0 | 128 | 92028 | 552.76 | 806 | 791 | 165.1 |
| A | 8 | 5 | 91479 | 549.43 | 806 | 791 | 165.1 |
| A | 15 | 174 | 57334 | 342.57 | 806 | 791 | 165.1 |
| B | 0 | 214 | 73279 | 482.27 | 796 | 779 | 150.3 |
| B | 10 | 16 | 30501 | 197.71 | 796 | 779 | 150.3 |
| B | 3 | 220 | 23910 | 153.87 | 796 | 779 | 150.3 |
| C | 13 | 61 | 5812 | 29.09 | 760 | 764 | 173.5 |
| C | 8 | 128 | 4778 | 23.13 | 760 | 764 | 173.5 |
| C | 8 | 112 | 2969 | 12.71 | 760 | 764 | 173.5 |
| D | 1 | 52 | 538203 | 2793.77 | 763 | 744 | 192.4 |
| D | 8 | 195 | 379131 | 1966.9 | 763 | 744 | 192.4 |
| D | 12 | 233 | 200315 | 1037.39 | 763 | 744 | 192.4 |
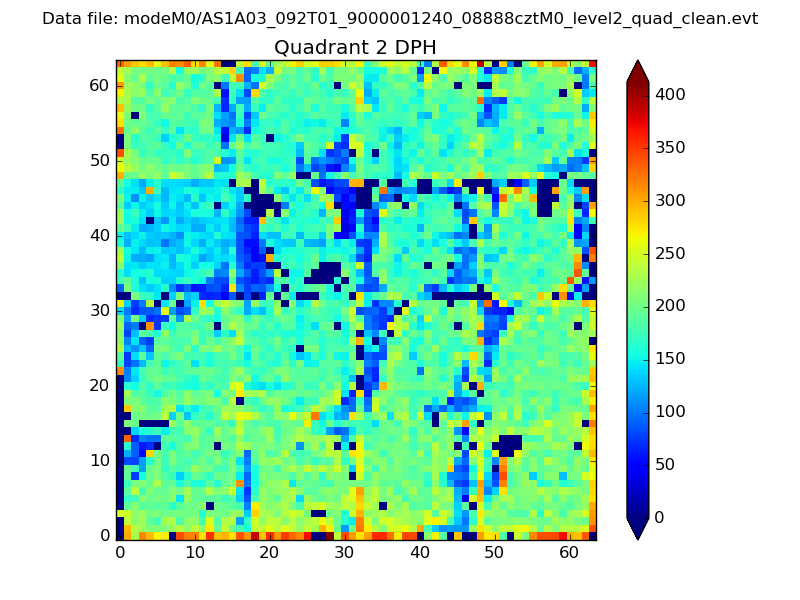
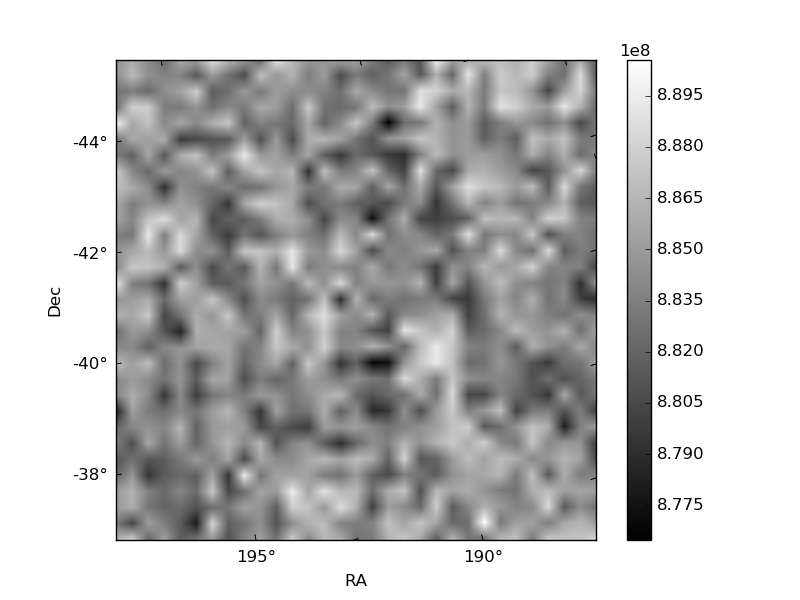
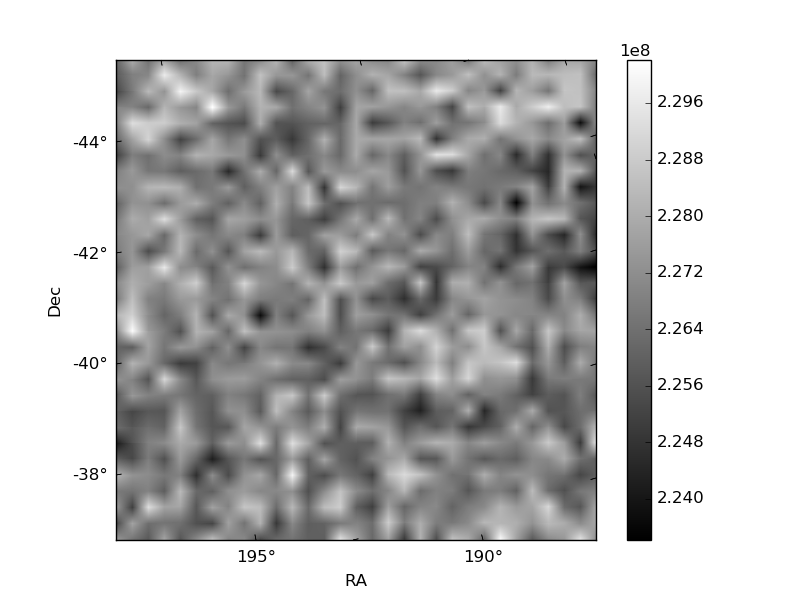
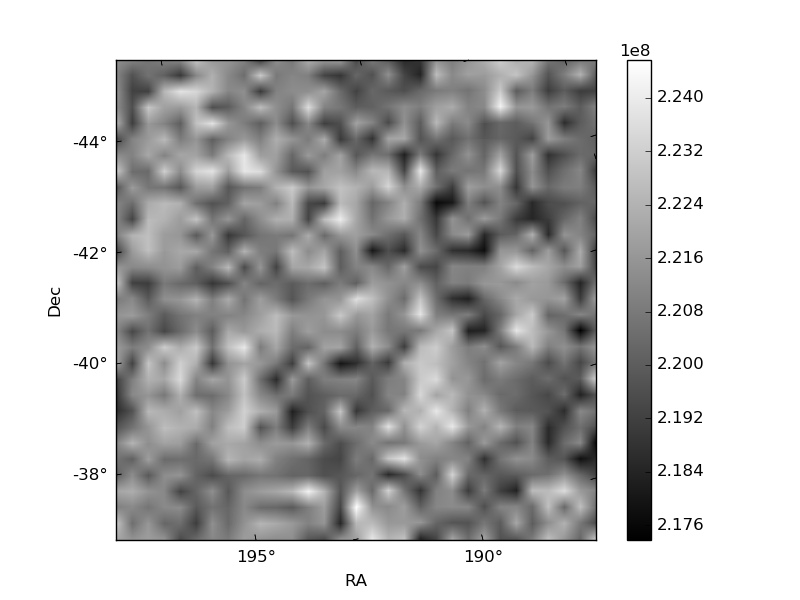
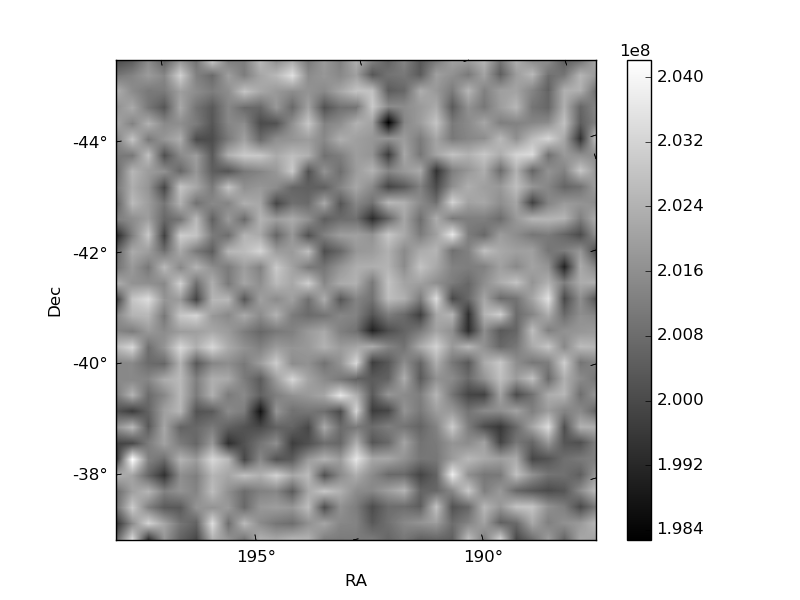
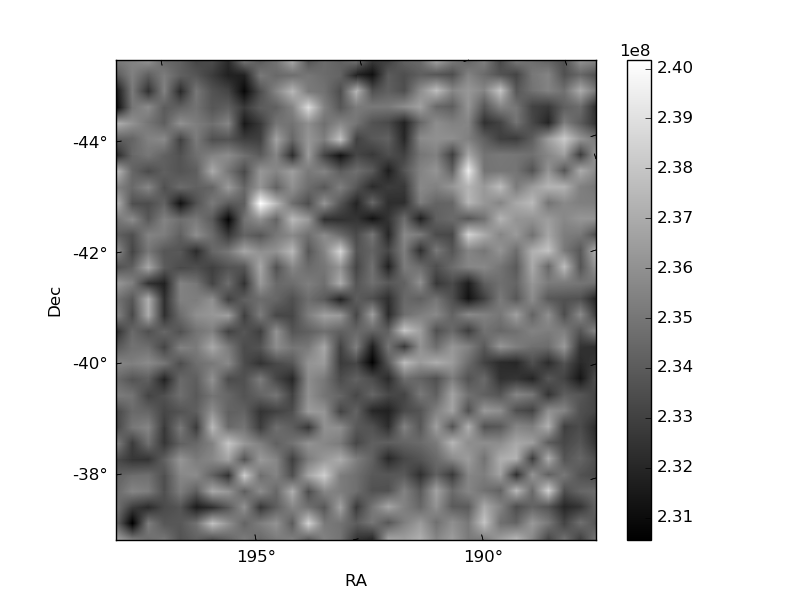
Histogram calculated using DETX and DETY for each event in the final _common_clean file
| Quadrant A | 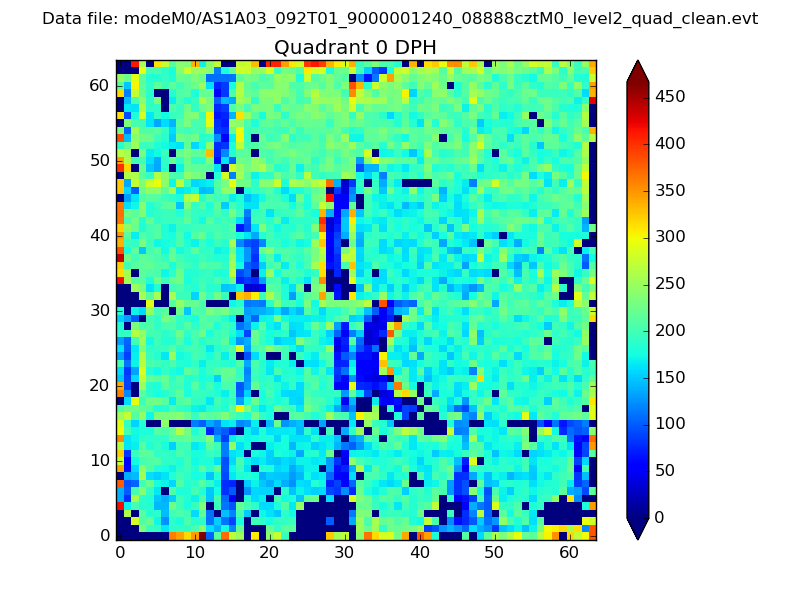 |
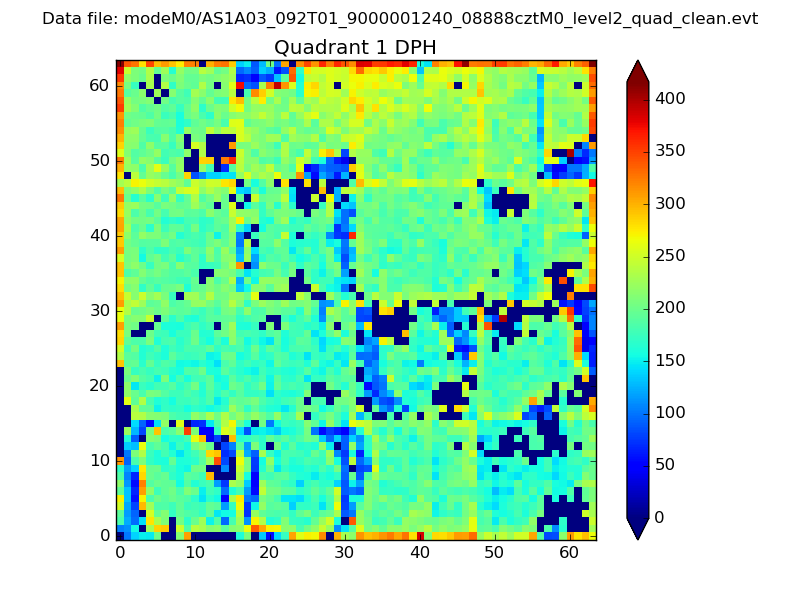 |
Quadrant B |
|---|---|---|---|
| Quadrant D | 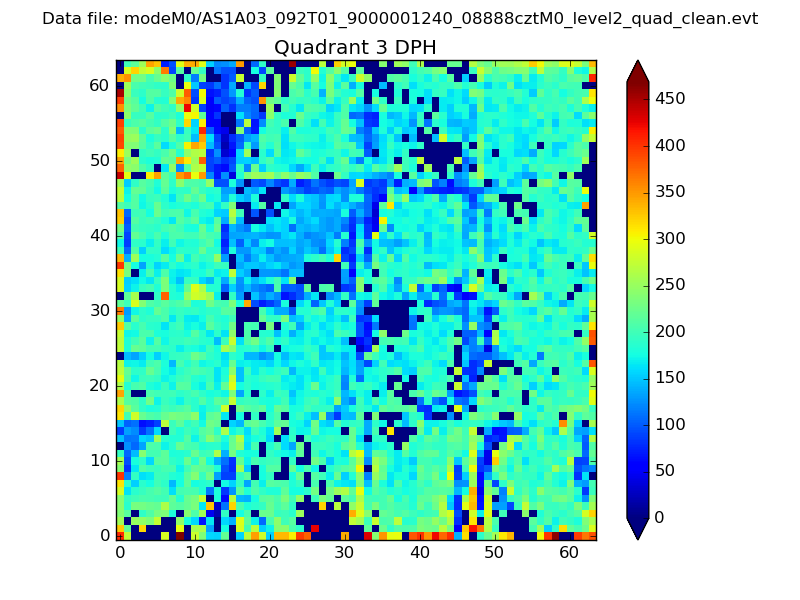 |
 |
Quadrant C |
| Plot type | Count rate plots | Images |
|---|---|---|
| Comparison with Poisson distribution Blue bars denote a histogram of data divided into 1 sec bins. Red curve is a Poisson curve with rate = median count rate of data. |
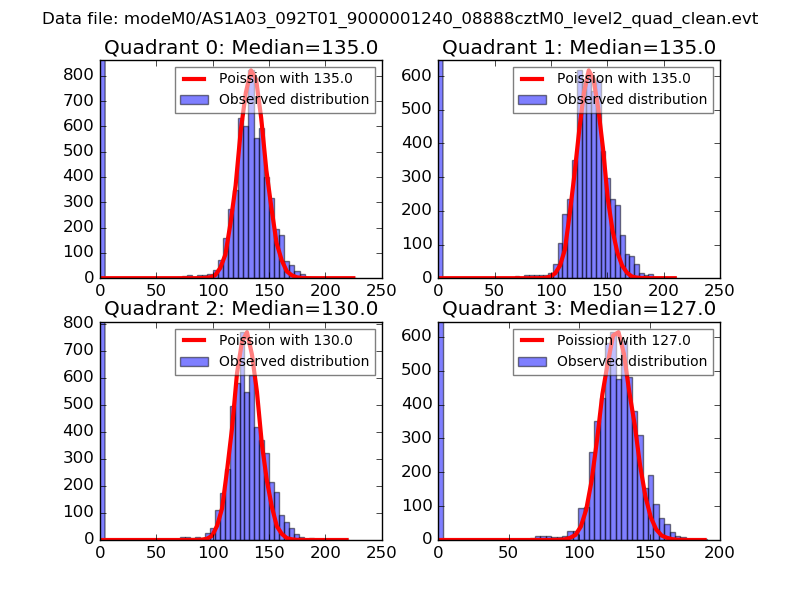 |
 |
| Quadrant-wise count rates Data is divided into 100 sec bins |
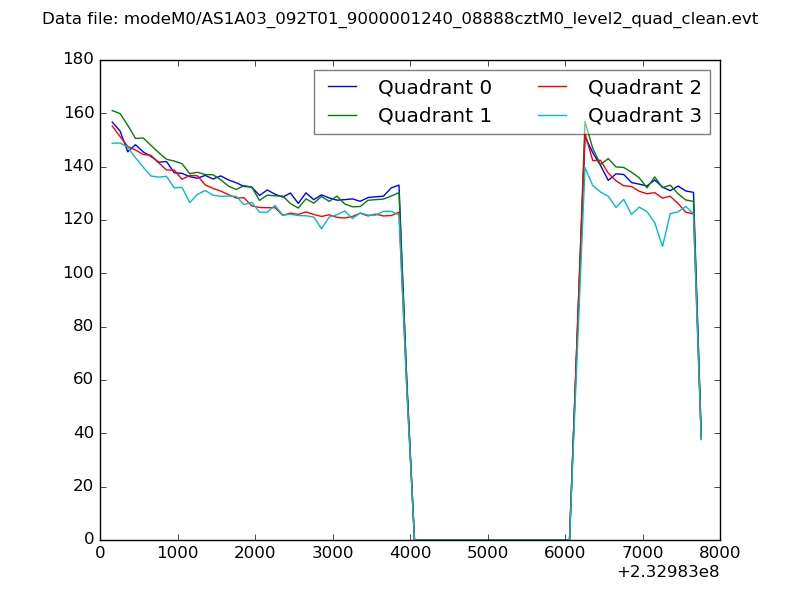 |
|
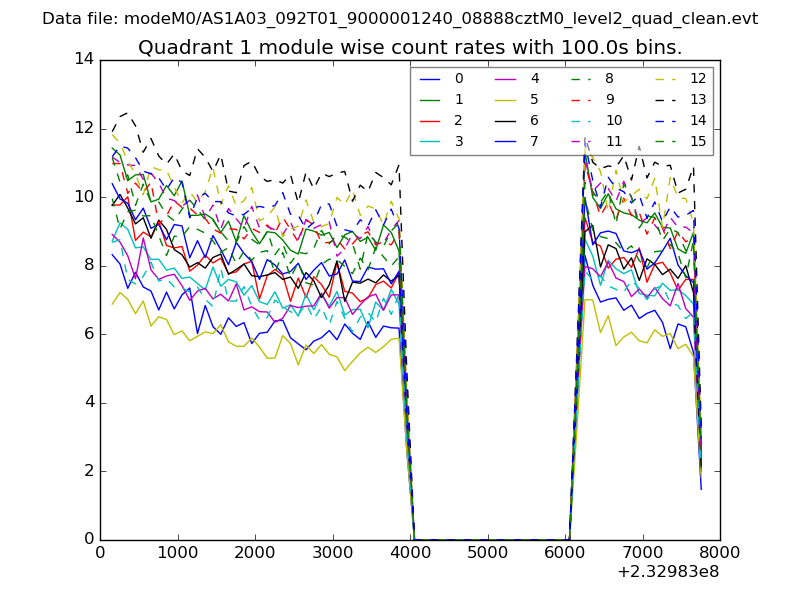
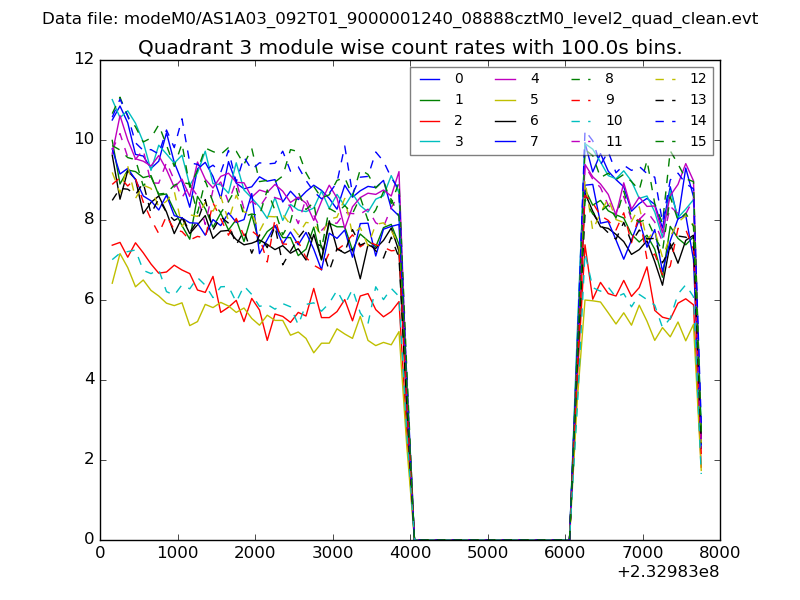
| Module-wise count rates for Quadrant A Data is divided into 100 sec bins |
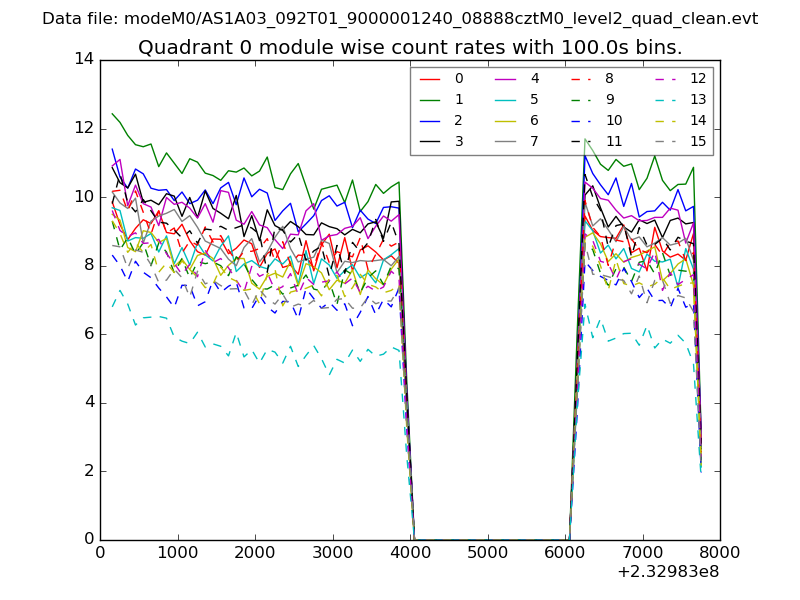 |
 |
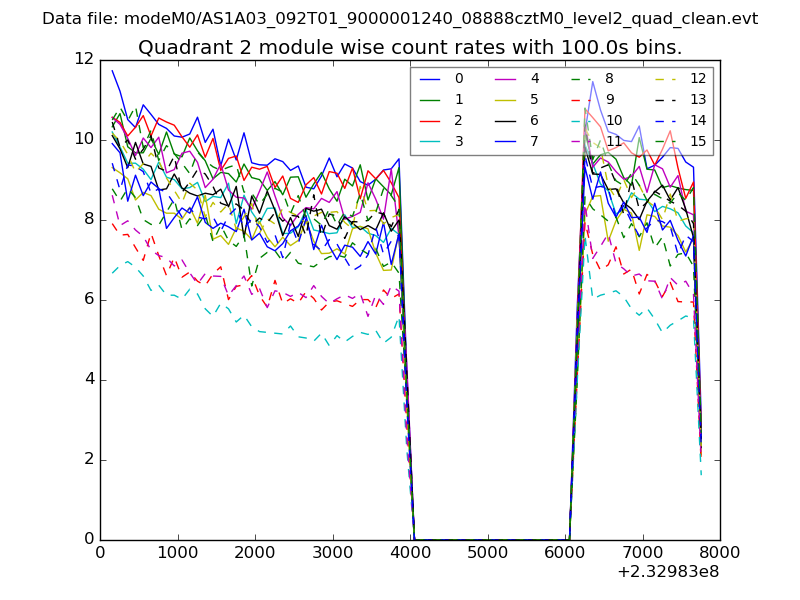
| Module-wise count rates for Quadrant B Data is divided into 100 sec bins |
 |
 |
| Module-wise count rates for Quadrant C Data is divided into 100 sec bins |
 |
 |
| Module-wise count rates for Quadrant D Data is divided into 100 sec bins |
 |
 |
| Parameter | Plot |
|---|---|
| CZT HV Monitor | 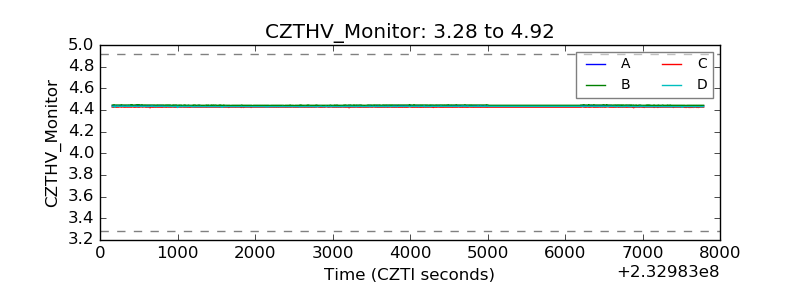 |
| D_VDD | 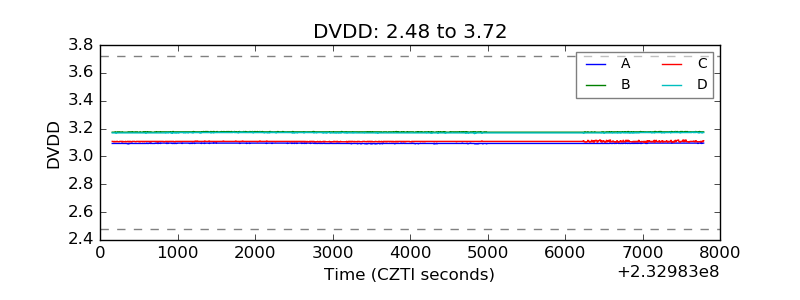 |
| Temperature 1 | 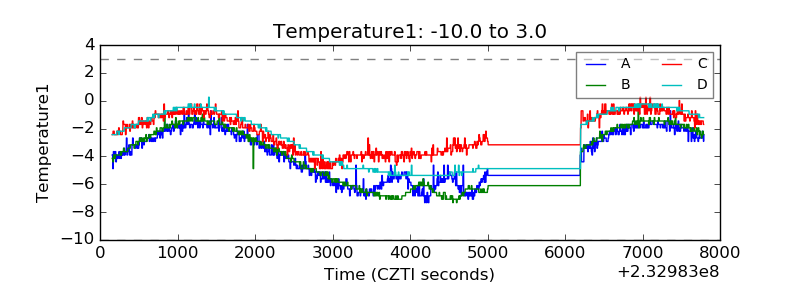 |
| Veto HV Monitor | 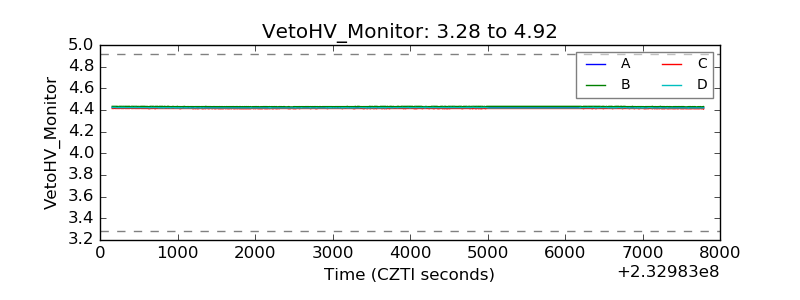 |
| Veto LLD | 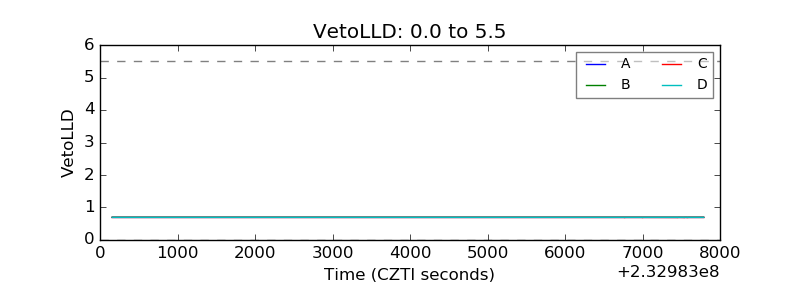 |
| Alpha Counter | 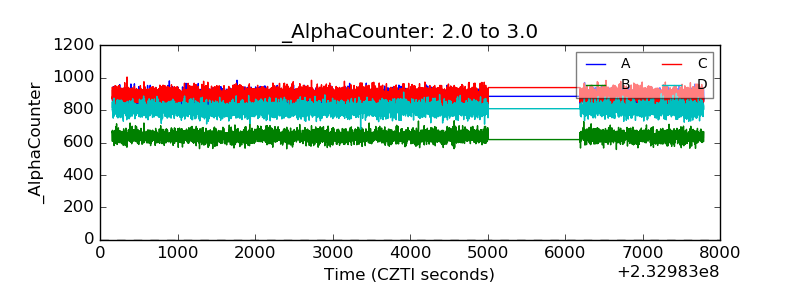 |
| _CPM_Rate | 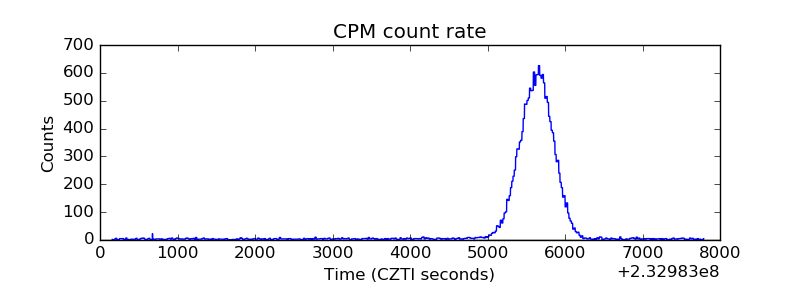 |
| CZT Counter | 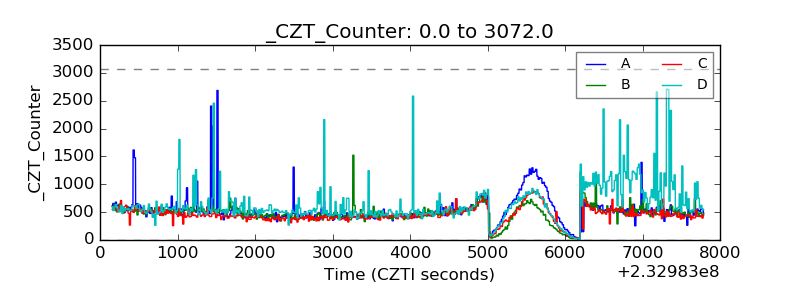 |
| +2.5 Volts monitor |  |
| +5 Volts monitor |  |
| _ROLL_ROT | 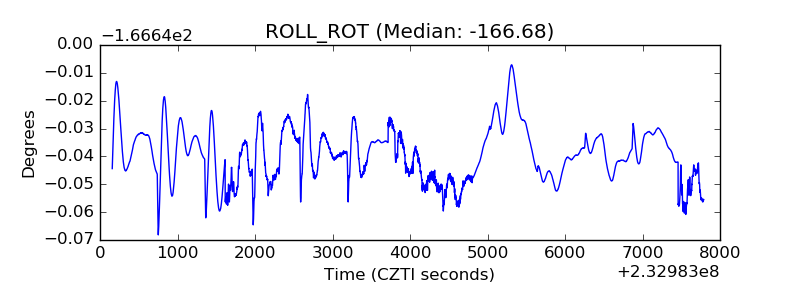 |
| _Roll_DEC | 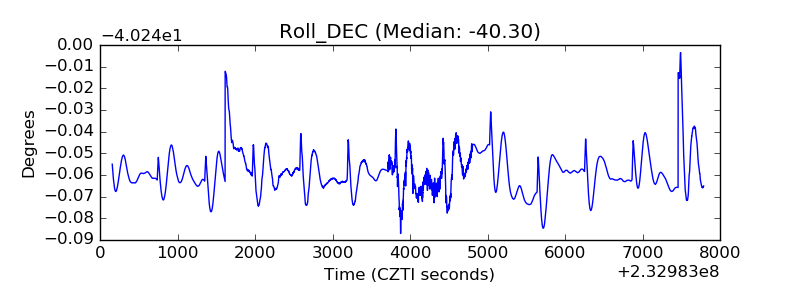 |
| _Roll_RA | 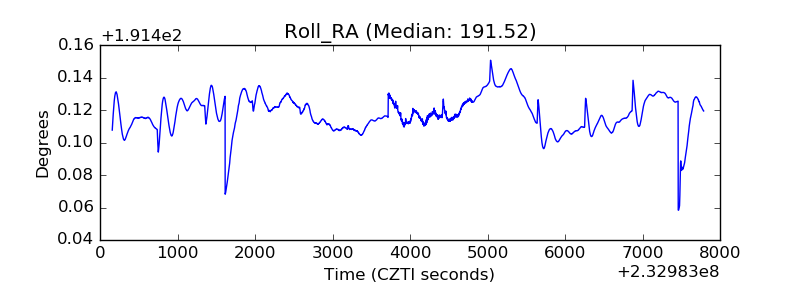 |
| Veto Counter | 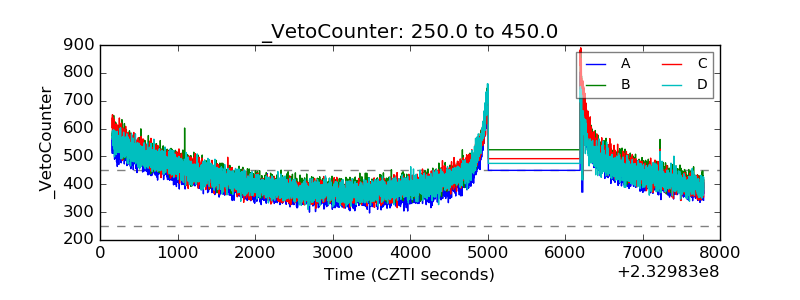 |