| Param | Original file | Final file |
|---|---|---|
| Filename | modeM0/AS1A03_092T01_9000001240_08889cztM0_level2.evt | modeM0/AS1A03_092T01_9000001240_08889cztM0_level2_quad_clean.evt |
| Size (bytes) | 1,195,139,520 | 253,425,600 |
| Size | 1.1 GB | 241.7 MB |
| Events in quadrant A | 9,283,863 | 1,675,475 |
| Events in quadrant B | 8,077,618 | 1,685,543 |
| Events in quadrant C | 7,323,763 | 1,628,202 |
| Events in quadrant D | 10,427,929 | 1,582,755 |
| Mode M9 | |||
|---|---|---|---|
| Quadrant | BADHDUFLAG | Total packets | Discarded packets |
| A | 0 | 35 | 0 |
| B | 0 | 35 | 0 |
| C | 0 | 35 | 0 |
| D | 0 | 35 | 0 |
| Mode SS | |||
|---|---|---|---|
| Quadrant | BADHDUFLAG | Total packets | Discarded packets |
| A | 0 | 326 | 0 |
| B | 0 | 326 | 0 |
| C | 0 | 326 | 2 |
| D | 0 | 326 | 2 |
| Mode M0 | |||
|---|---|---|---|
| Quadrant | BADHDUFLAG | Total packets | Discarded packets |
| A | 0 | 37949 | 123 |
| B | 0 | 34478 | 106 |
| C | 0 | 33157 | 100 |
| D | 0 | 41250 | 269 |
| Quadrant | Total seconds | Saturated seconds | Saturation percentage |
|---|---|---|---|
| A | 16016 | 450 | 2.809690% |
| B | 16020 | 295 | 1.841448% |
| C | 16022 | 175 | 1.092248% |
| D | 16004 | 398 | 2.486878% |
Noise dominated data is calculated using 1-second bins in cleaned event files. If a bin has >2000 counts, and if more than 50% of those come from <1% of pixels, then it is considered to be noise-dominated and hence unusable.
| Quadrant | # 1 sec bins | Bins with >0 counts | Bins with >2000 counts | High rate bins dominated by noise | Noise dominated (total time) | Noise dominated (detector-on time) | Marked lightcurve |
|---|---|---|---|---|---|---|---|
| A | 19531 | 16037 | 126 | 126 | 0.65% | 0.79% | 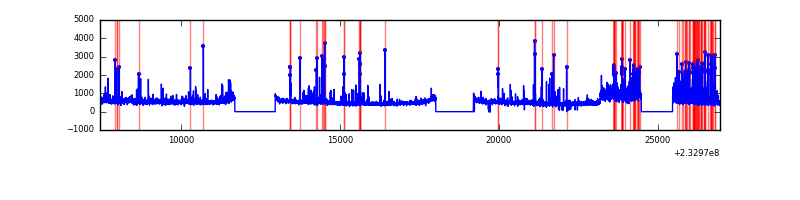 |
| B | 19531 | 16045 | 20 | 20 | 0.10% | 0.12% | 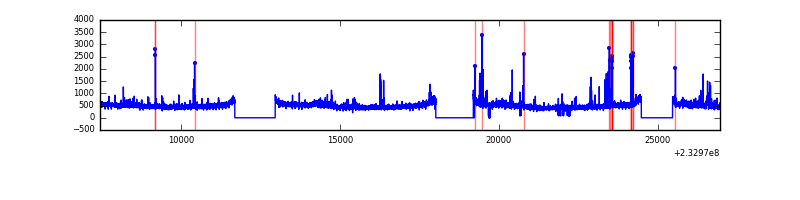 |
| C | 19531 | 16045 | 3 | 3 | 0.02% | 0.02% | 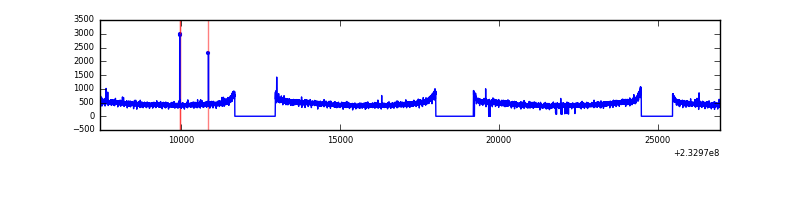 |
| D | 19531 | 16034 | 161 | 161 | 0.82% | 1.00% | 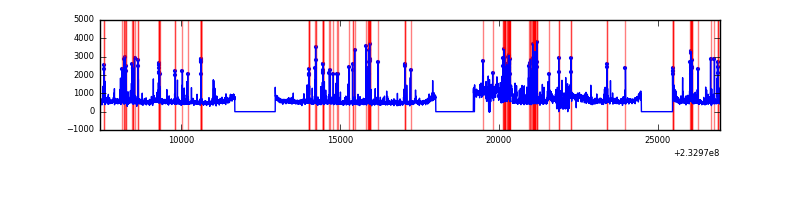 |
Top three noisy pixels from each quadrant. If the there are fewer than three noisy pixels in the level2.evt file, extra rows are filled as -1
| Pixel properties | Quadrant properties | ||||||
|---|---|---|---|---|---|---|---|
| Quadrant | DetID | PixID | Counts | Sigma | Mean | Median | Sigma |
| A | 8 | 5 | 1068780 | 2693.09 | 1962 | 1923 | 396.1 |
| A | 0 | 128 | 459634 | 1155.41 | 1962 | 1923 | 396.1 |
| A | 15 | 174 | 132805 | 330.39 | 1962 | 1923 | 396.1 |
| B | 0 | 214 | 143476 | 388.52 | 1956 | 1916 | 364.4 |
| B | 10 | 16 | 79812 | 213.79 | 1956 | 1916 | 364.4 |
| B | 0 | 213 | 47474 | 125.04 | 1956 | 1916 | 364.4 |
| C | 12 | 4 | 20680 | 43.88 | 1868 | 1873 | 428.6 |
| C | 13 | 61 | 14284 | 28.96 | 1868 | 1873 | 428.6 |
| C | 8 | 128 | 12671 | 25.19 | 1868 | 1873 | 428.6 |
| D | 1 | 52 | 1113254 | 2324.27 | 1867 | 1818 | 478.2 |
| D | 8 | 195 | 1057626 | 2207.94 | 1867 | 1818 | 478.2 |
| D | 12 | 233 | 330103 | 686.52 | 1867 | 1818 | 478.2 |
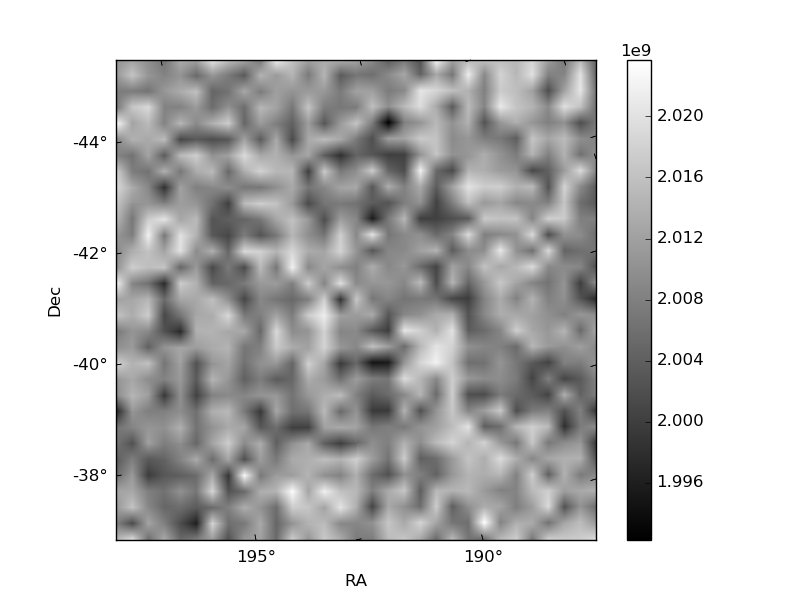
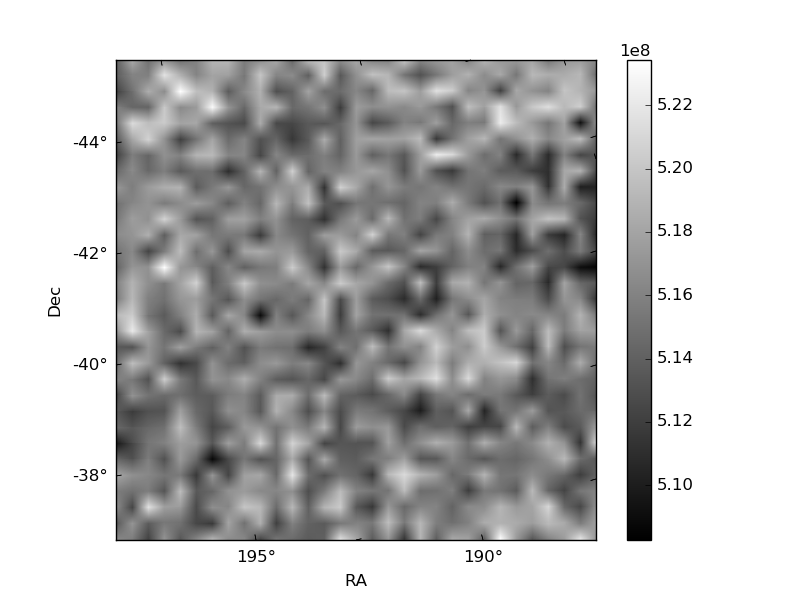
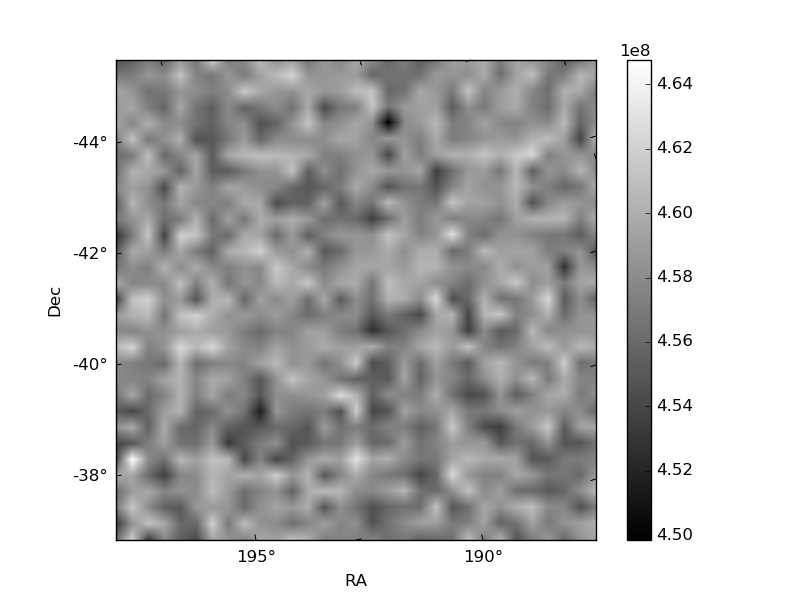
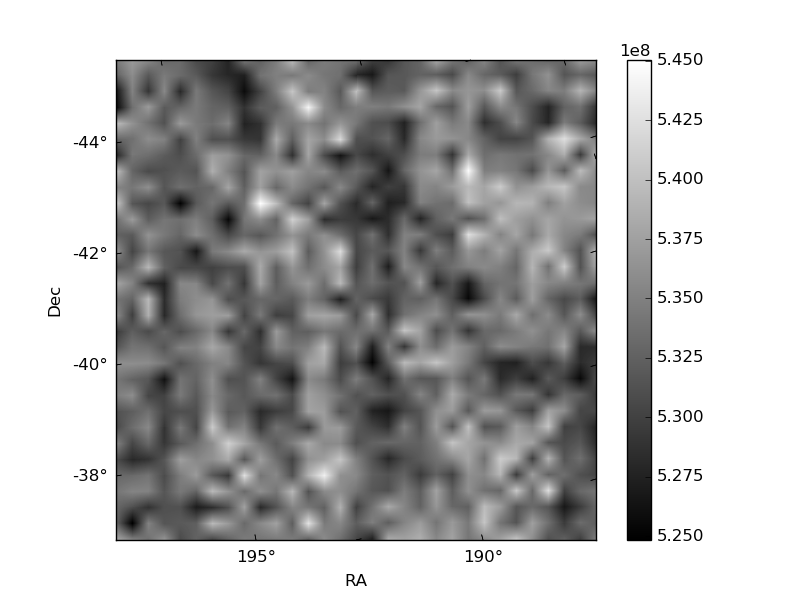
Histogram calculated using DETX and DETY for each event in the final _common_clean file
| Quadrant A | 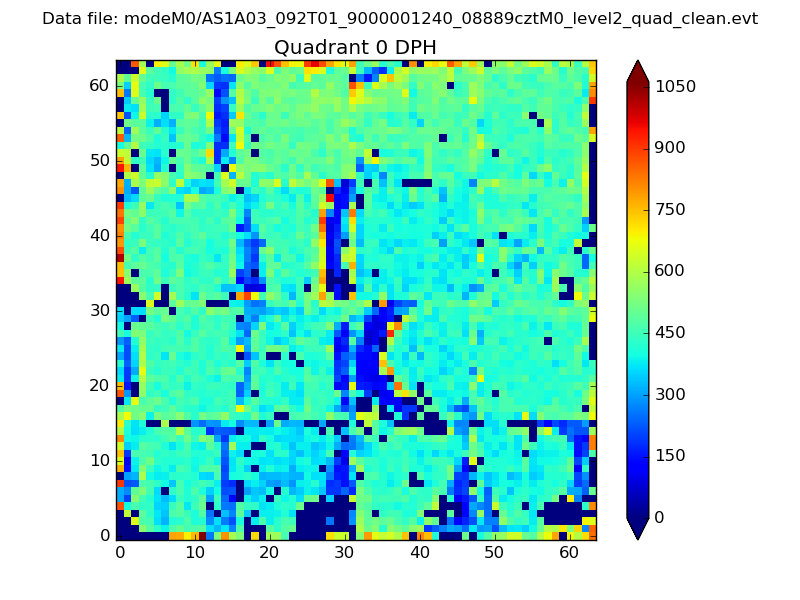 |
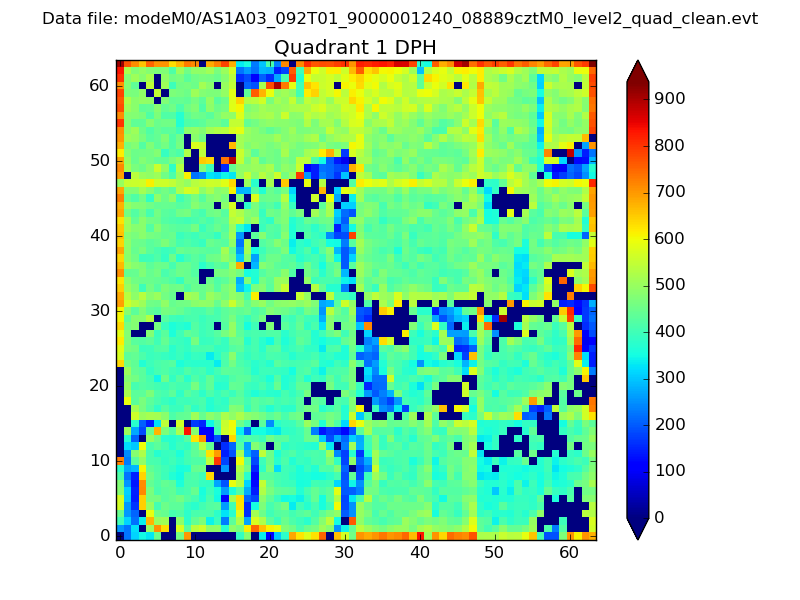 |
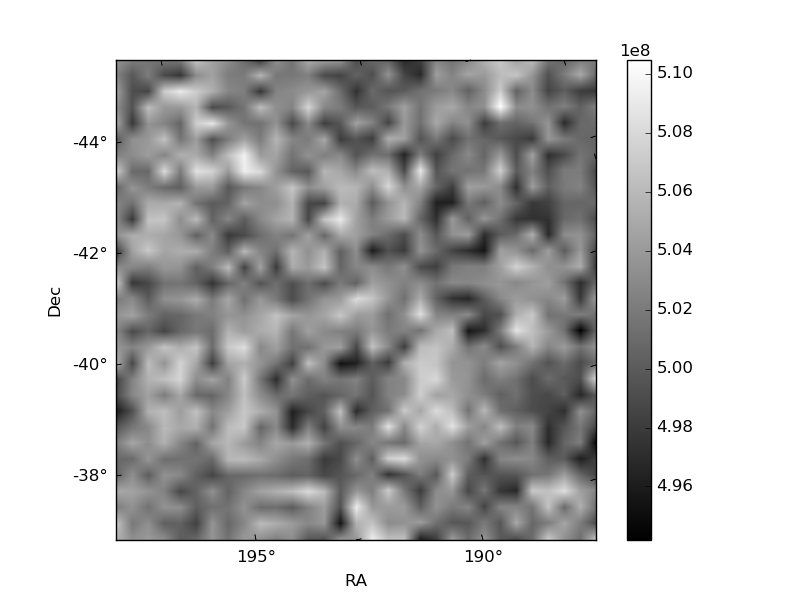
Quadrant B |
|---|---|---|---|
| Quadrant D | 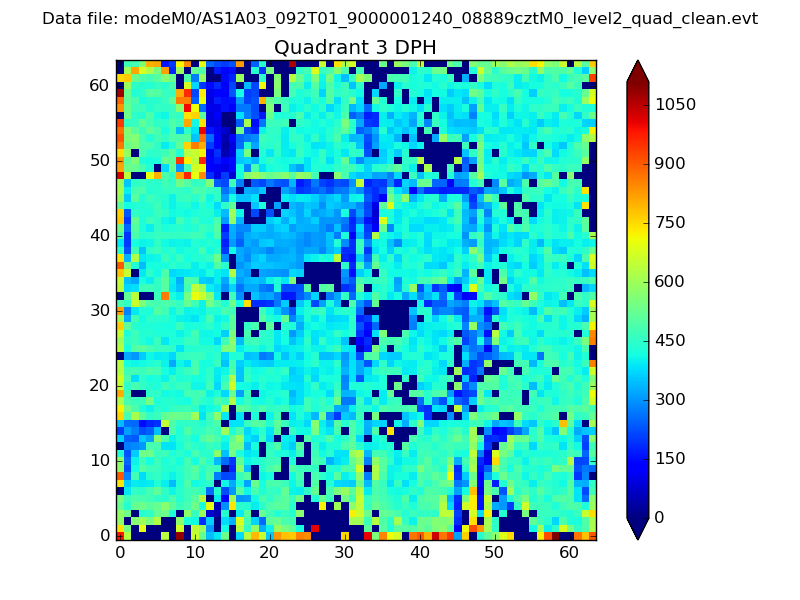 |
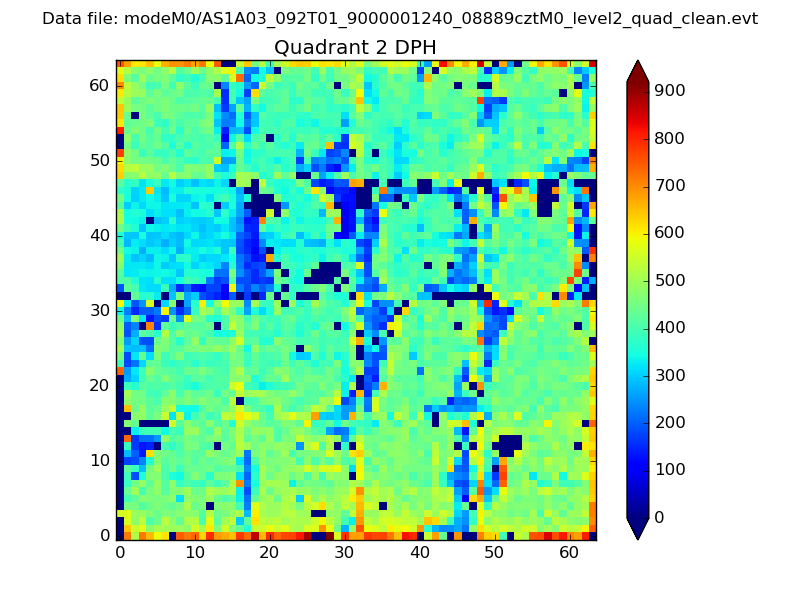 |
Quadrant C |
| Plot type | Count rate plots | Images |
|---|---|---|
| Comparison with Poisson distribution Blue bars denote a histogram of data divided into 1 sec bins. Red curve is a Poisson curve with rate = median count rate of data. |
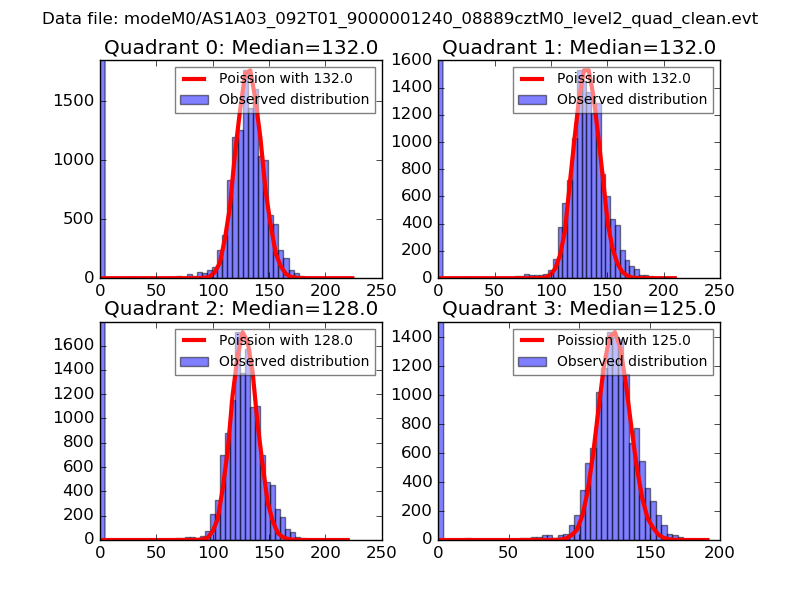 |
 |
| Quadrant-wise count rates Data is divided into 100 sec bins |
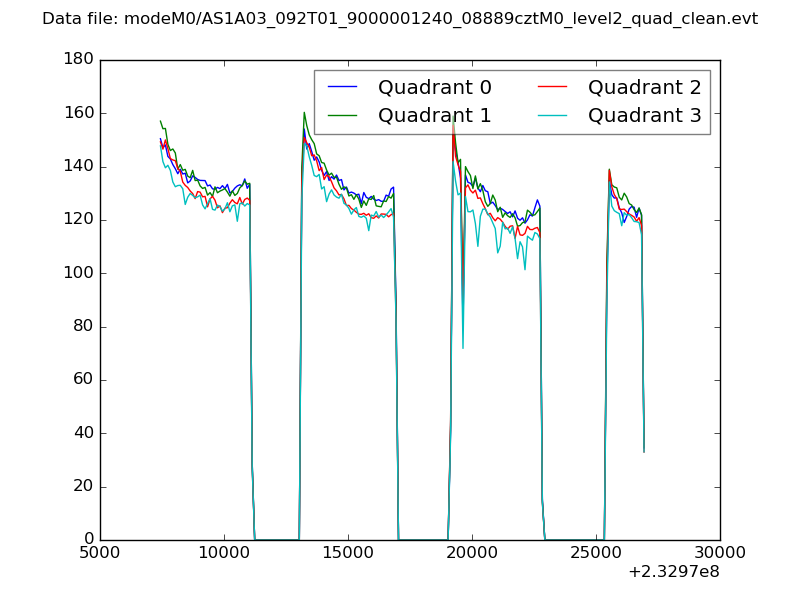 |
|
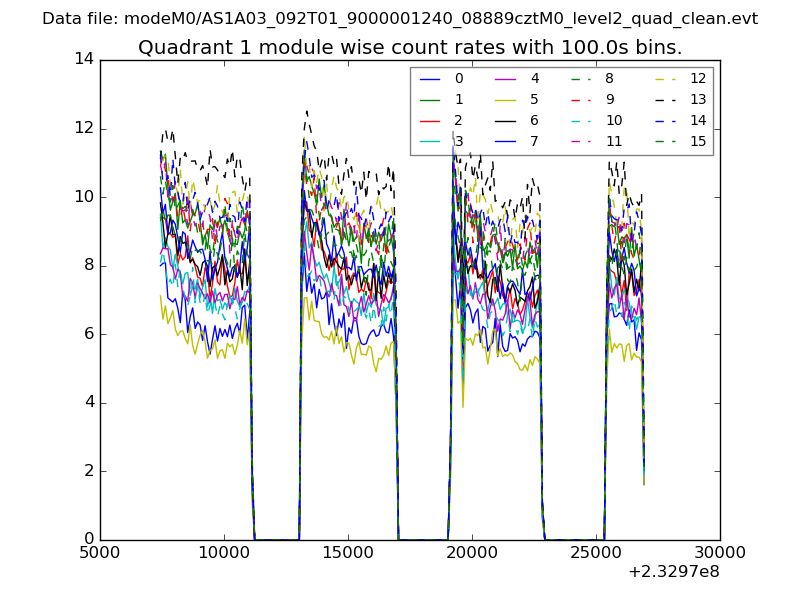
| Module-wise count rates for Quadrant A Data is divided into 100 sec bins |
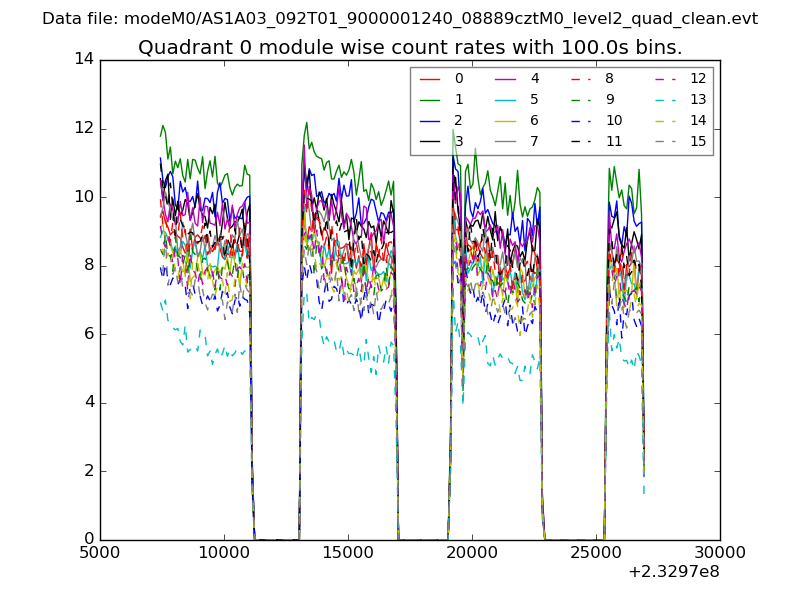 |
 |
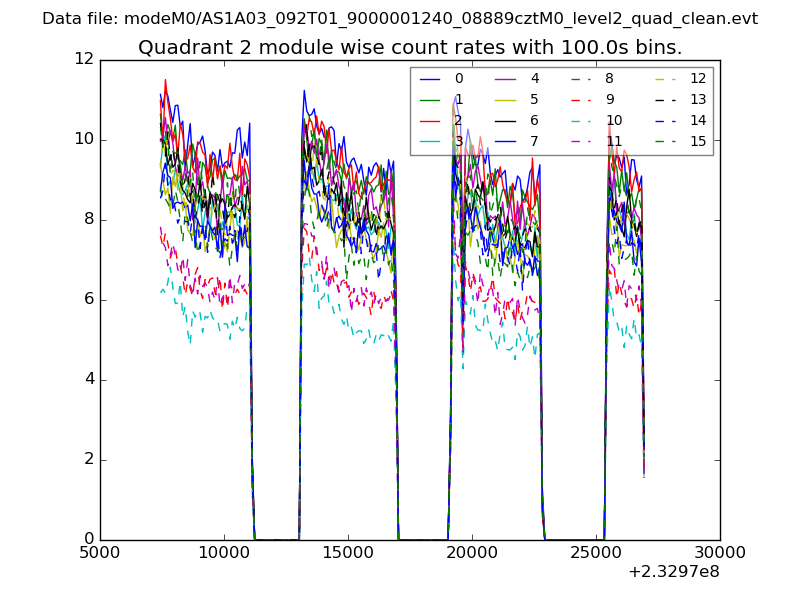
| Module-wise count rates for Quadrant B Data is divided into 100 sec bins |
 |
 |
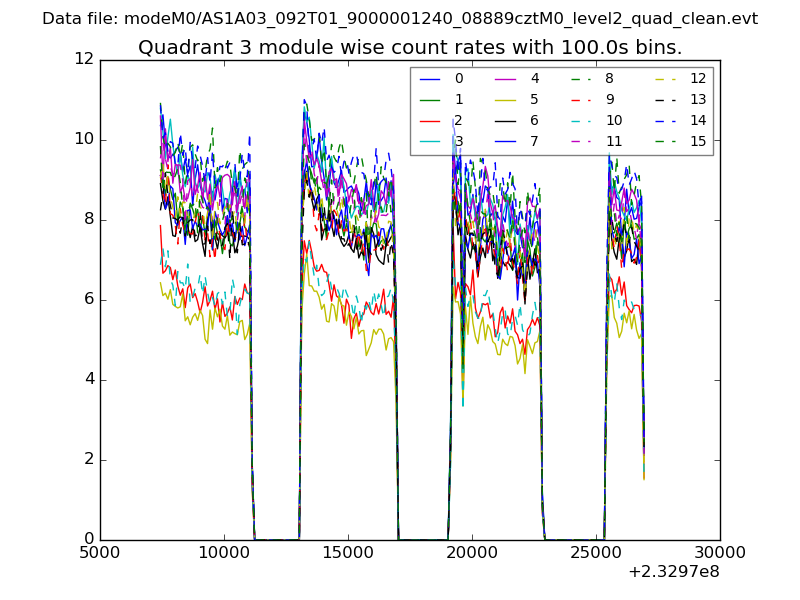
| Module-wise count rates for Quadrant C Data is divided into 100 sec bins |
 |
 |
| Module-wise count rates for Quadrant D Data is divided into 100 sec bins |
 |
 |
| Parameter | Plot |
|---|---|
| CZT HV Monitor | 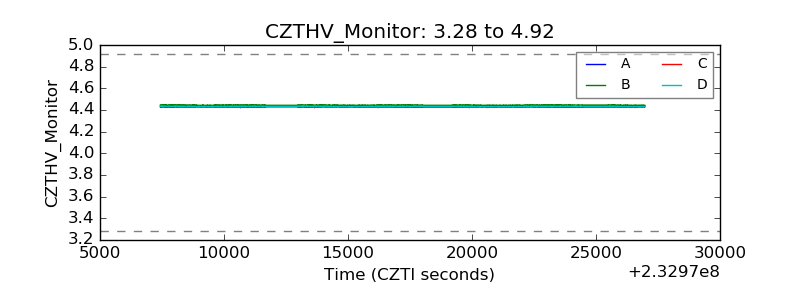 |
| D_VDD | 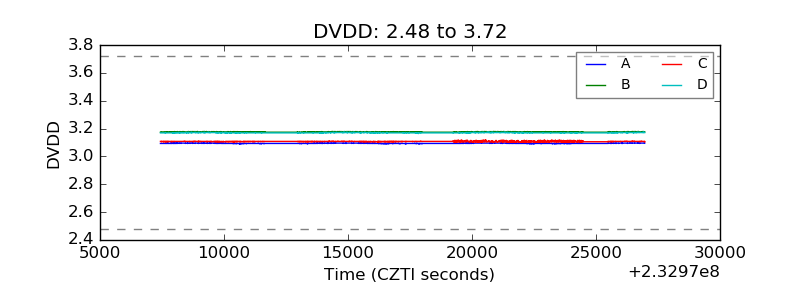 |
| Temperature 1 |  |
| Veto HV Monitor | 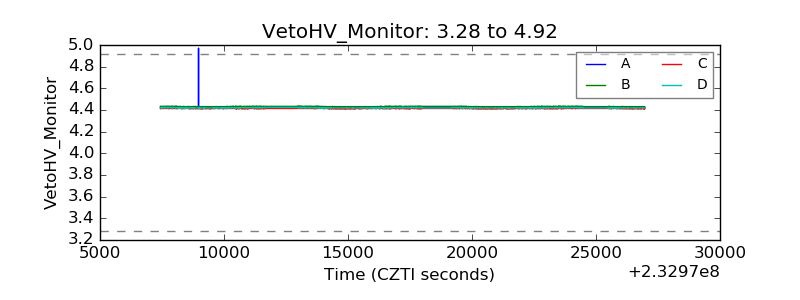 |
| Veto LLD | 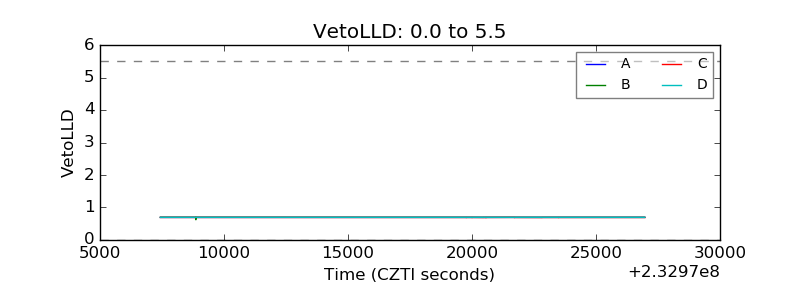 |
| Alpha Counter | 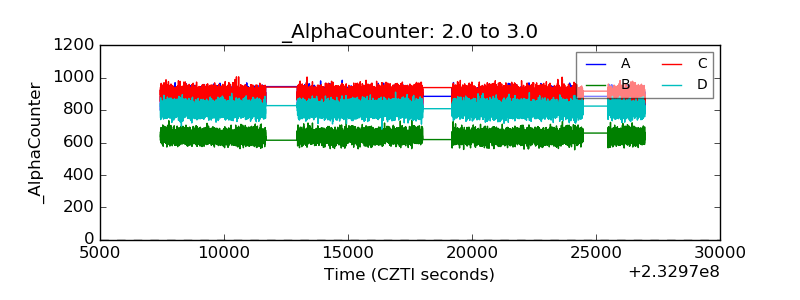 |
| _CPM_Rate | 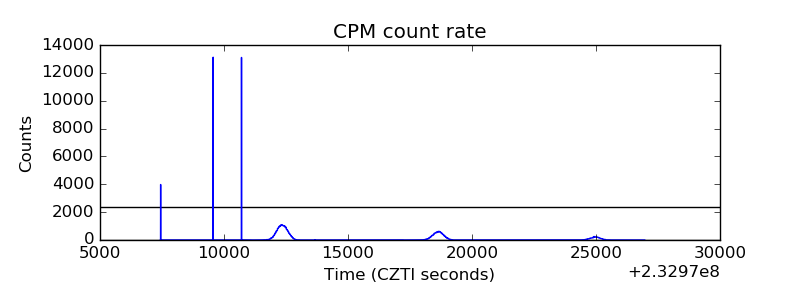 |
| CZT Counter | 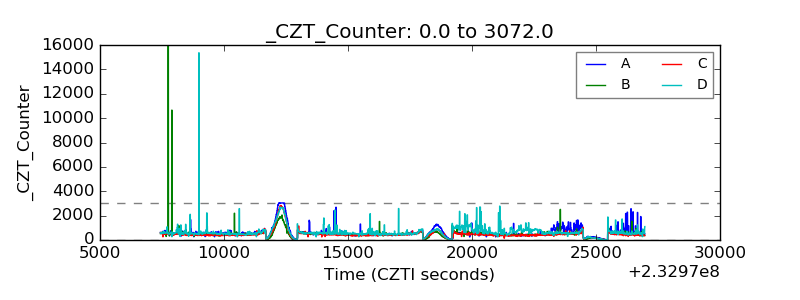 |
| +2.5 Volts monitor |  |
| +5 Volts monitor |  |
| _ROLL_ROT | 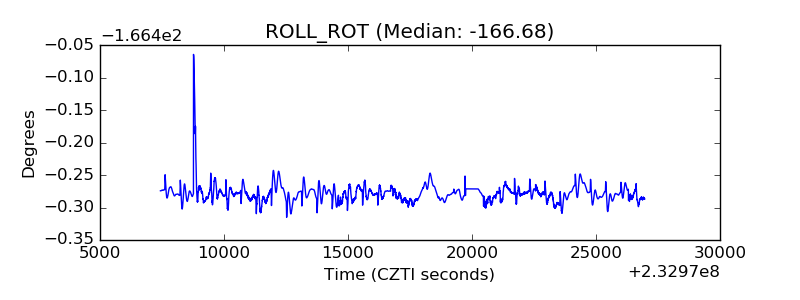 |
| _Roll_DEC |  |
| _Roll_RA | 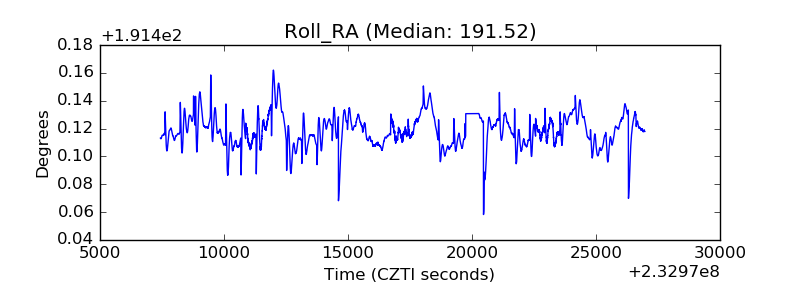 |
| Veto Counter | 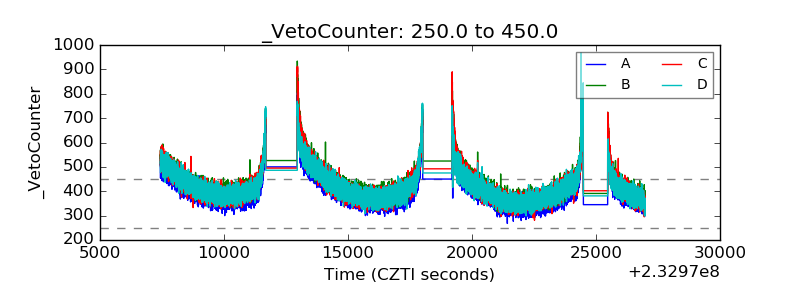 |