| Param | Original file | Final file |
|---|---|---|
| Filename | modeM0/AS1A03_092T01_9000001240_08891cztM0_level2.evt | modeM0/AS1A03_092T01_9000001240_08891cztM0_level2_quad_clean.evt |
| Size (bytes) | 542,450,880 | 102,600,000 |
| Size | 517.3 MB | 97.8 MB |
| Events in quadrant A | 3,771,514 | 664,283 |
| Events in quadrant B | 3,579,186 | 665,385 |
| Events in quadrant C | 3,465,966 | 647,158 |
| Events in quadrant D | 5,111,932 | 617,991 |
| Mode M9 | |||
|---|---|---|---|
| Quadrant | BADHDUFLAG | Total packets | Discarded packets |
| A | 0 | 3 | 0 |
| B | 0 | 3 | 0 |
| C | 0 | 3 | 0 |
| D | 0 | 4 | 0 |
| Mode SS | |||
|---|---|---|---|
| Quadrant | BADHDUFLAG | Total packets | Discarded packets |
| A | 0 | 152 | 2 |
| B | 0 | 152 | 2 |
| C | 0 | 152 | 0 |
| D | 0 | 152 | 0 |
| Mode M0 | |||
|---|---|---|---|
| Quadrant | BADHDUFLAG | Total packets | Discarded packets |
| A | 0 | 16202 | 156 |
| B | 0 | 15812 | 243 |
| C | 0 | 15786 | 131 |
| D | 0 | 20169 | 261 |
| Quadrant | Total seconds | Saturated seconds | Saturation percentage |
|---|---|---|---|
| A | 7368 | 68 | 0.922910% |
| B | 7347 | 76 | 1.034436% |
| C | 7377 | 34 | 0.460892% |
| D | 7347 | 386 | 5.253845% |
Noise dominated data is calculated using 1-second bins in cleaned event files. If a bin has >2000 counts, and if more than 50% of those come from <1% of pixels, then it is considered to be noise-dominated and hence unusable.
| Quadrant | # 1 sec bins | Bins with >0 counts | Bins with >2000 counts | High rate bins dominated by noise | Noise dominated (total time) | Noise dominated (detector-on time) | Marked lightcurve |
|---|---|---|---|---|---|---|---|
| A | 7687 | 7431 | 6 | 6 | 0.08% | 0.08% | 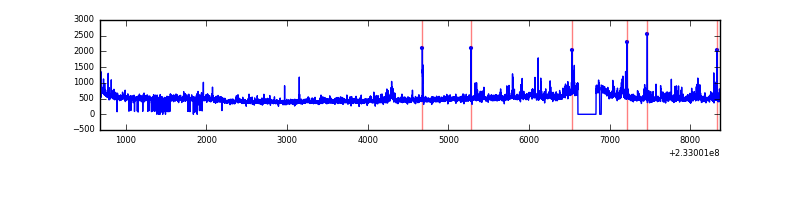 |
| B | 7687 | 7425 | 3 | 3 | 0.04% | 0.04% | 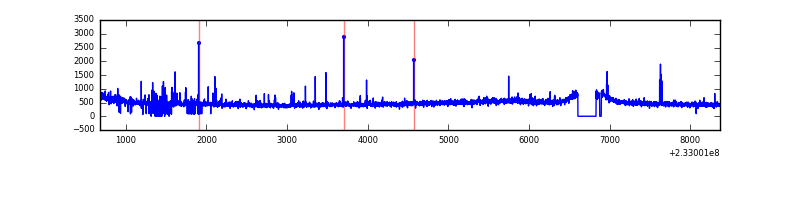 |
| C | 7687 | 7436 | 0 | 0 | 0.00% | 0.00% |  |
| D | 7687 | 7423 | 274 | 274 | 3.56% | 3.69% | 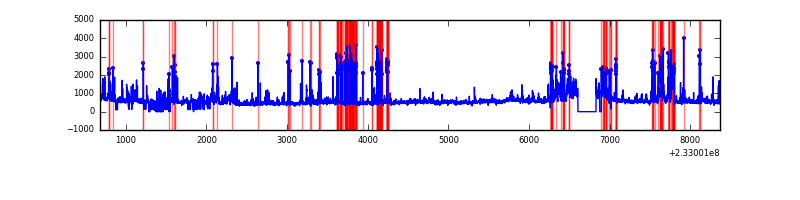 |
Top three noisy pixels from each quadrant. If the there are fewer than three noisy pixels in the level2.evt file, extra rows are filled as -1
| Pixel properties | Quadrant properties | ||||||
|---|---|---|---|---|---|---|---|
| Quadrant | DetID | PixID | Counts | Sigma | Mean | Median | Sigma |
| A | 8 | 5 | 339937 | 1888.75 | 873 | 855 | 179.5 |
| A | 15 | 174 | 22526 | 120.71 | 873 | 855 | 179.5 |
| A | 13 | 164 | 18680 | 99.29 | 873 | 855 | 179.5 |
| B | 0 | 214 | 36503 | 212.4 | 871 | 850 | 167.9 |
| B | 0 | 213 | 30575 | 177.09 | 871 | 850 | 167.9 |
| B | 0 | 219 | 24781 | 142.57 | 871 | 850 | 167.9 |
| C | 9 | 68 | 185435 | 954.89 | 834 | 837 | 193.3 |
| C | 8 | 128 | 12389 | 59.76 | 834 | 837 | 193.3 |
| C | 8 | 112 | 6828 | 30.99 | 834 | 837 | 193.3 |
| D | 1 | 52 | 693708 | 3195.73 | 817 | 798 | 216.8 |
| D | 8 | 195 | 592142 | 2727.3 | 817 | 798 | 216.8 |
| D | 7 | 71 | 408598 | 1880.79 | 817 | 798 | 216.8 |
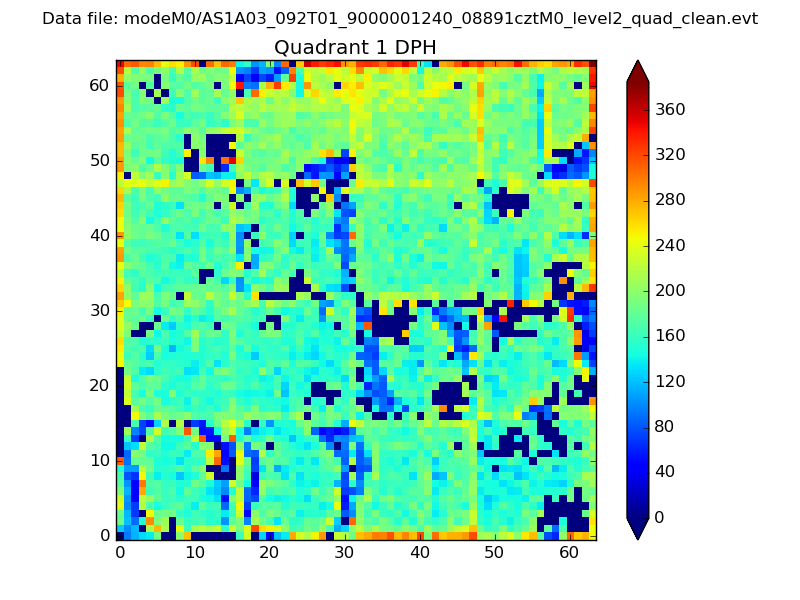
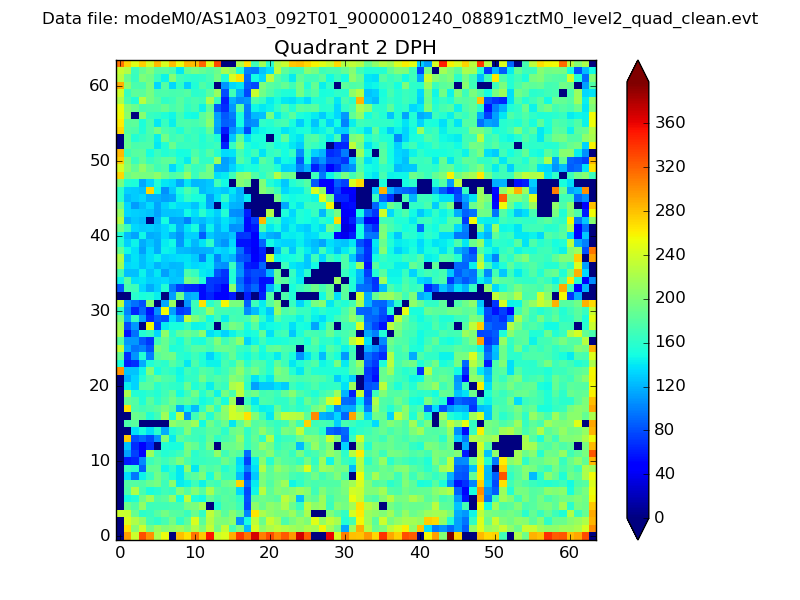
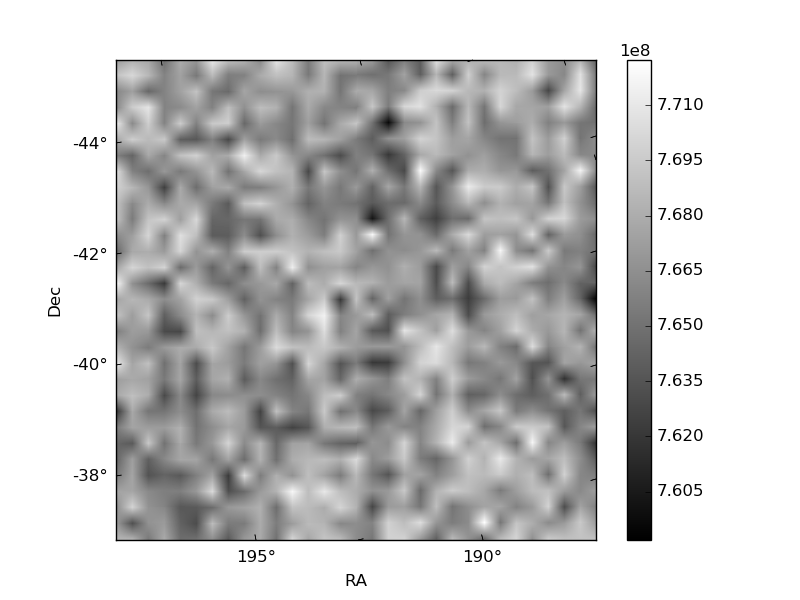
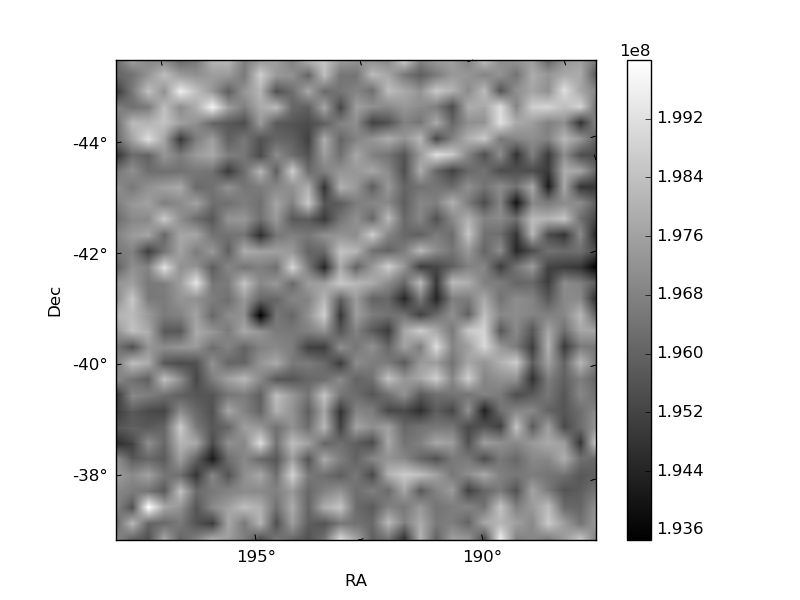
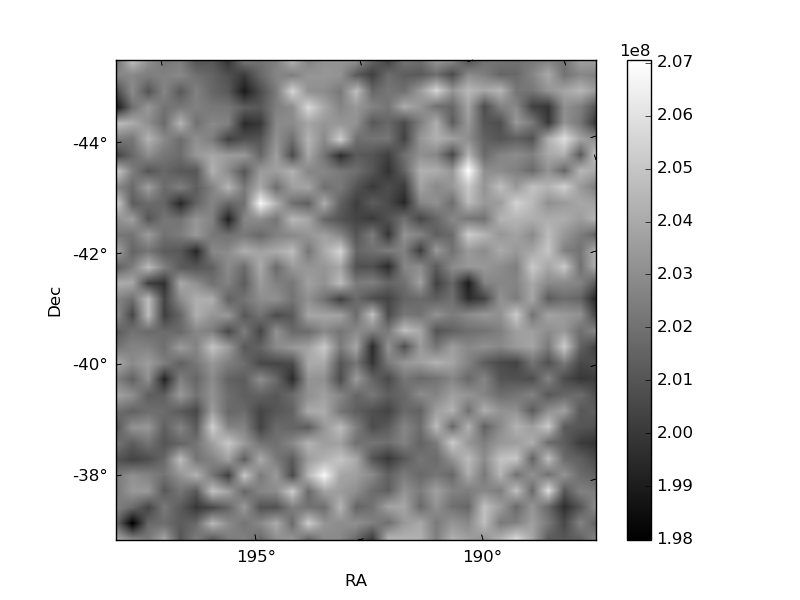
Histogram calculated using DETX and DETY for each event in the final _common_clean file
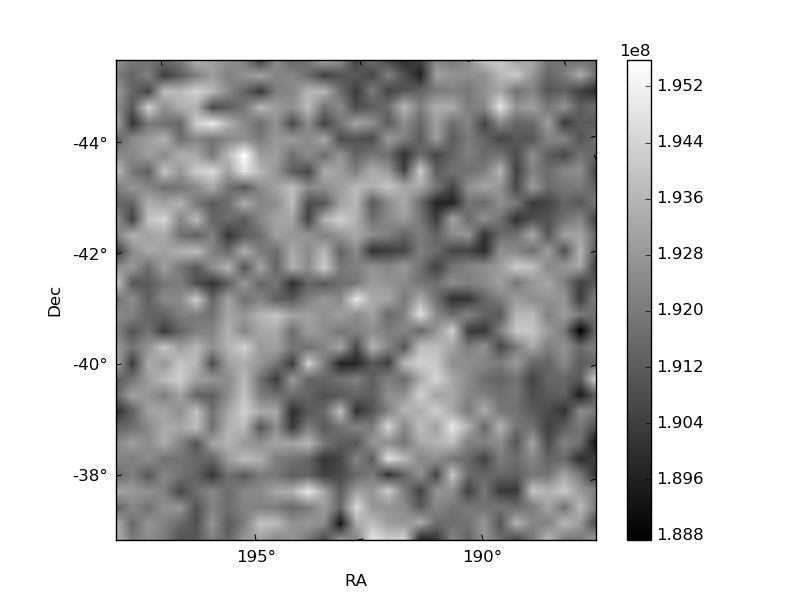
| Quadrant A | 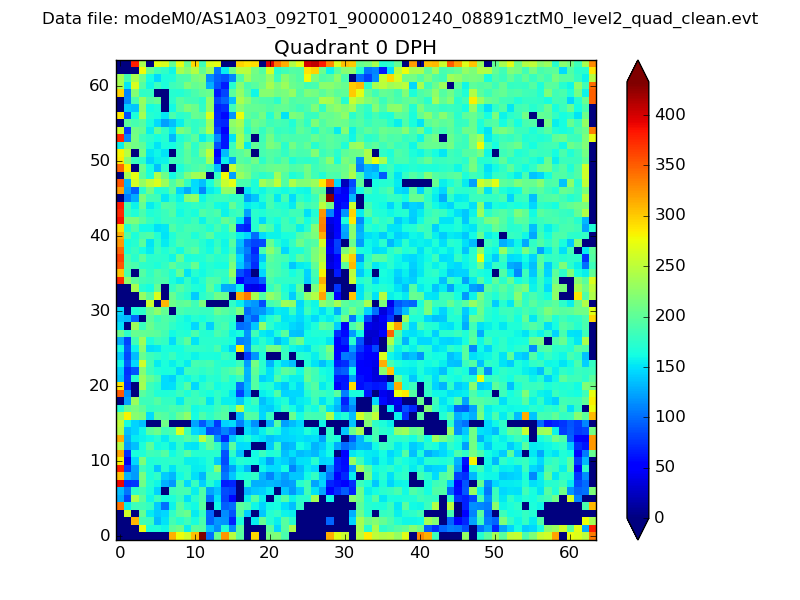 |
 |
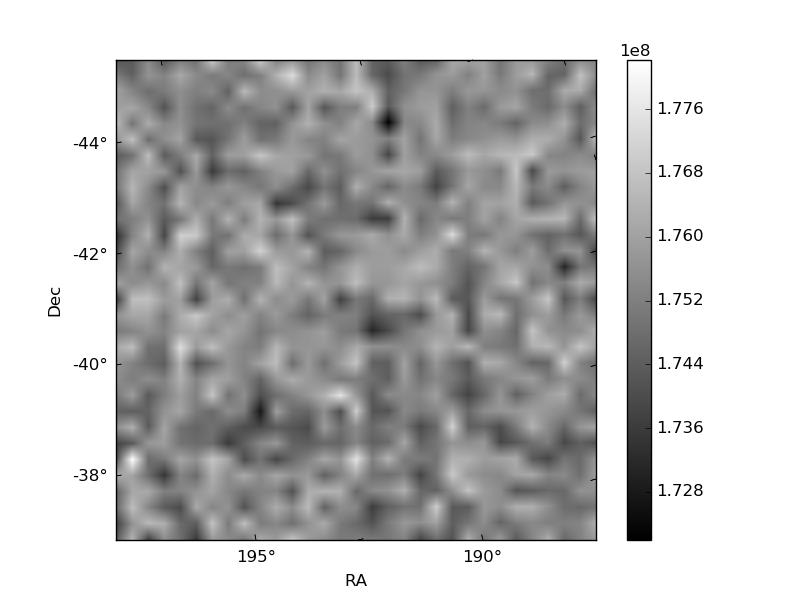
Quadrant B |
|---|---|---|---|
| Quadrant D | 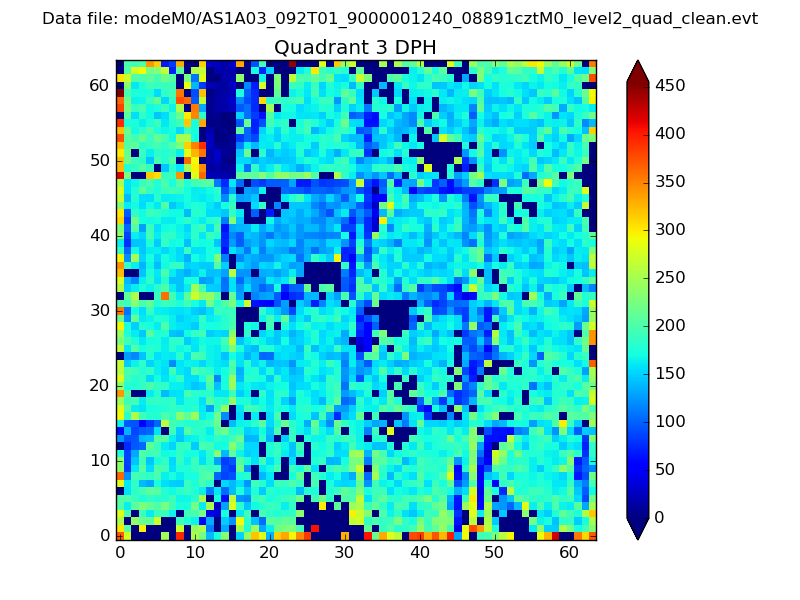 |
 |
Quadrant C |
| Plot type | Count rate plots | Images |
|---|---|---|
| Comparison with Poisson distribution Blue bars denote a histogram of data divided into 1 sec bins. Red curve is a Poisson curve with rate = median count rate of data. |
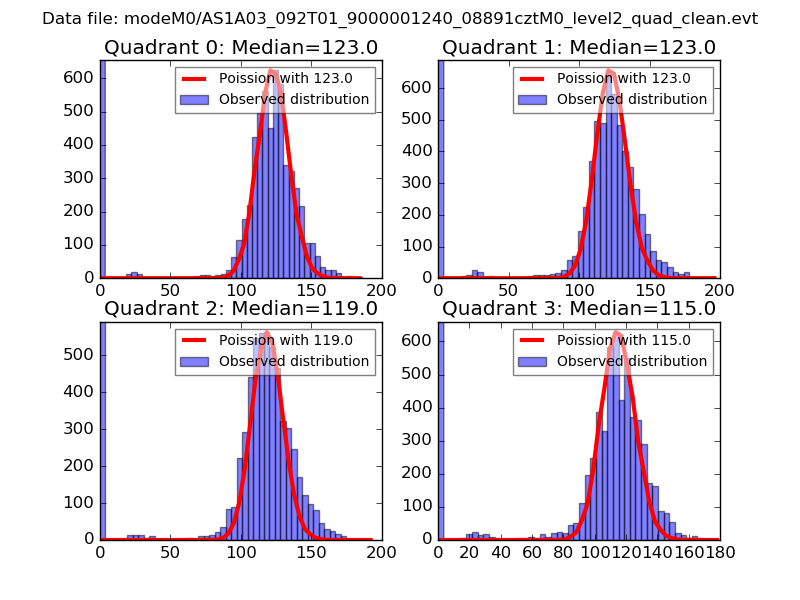 |
 |
| Quadrant-wise count rates Data is divided into 100 sec bins |
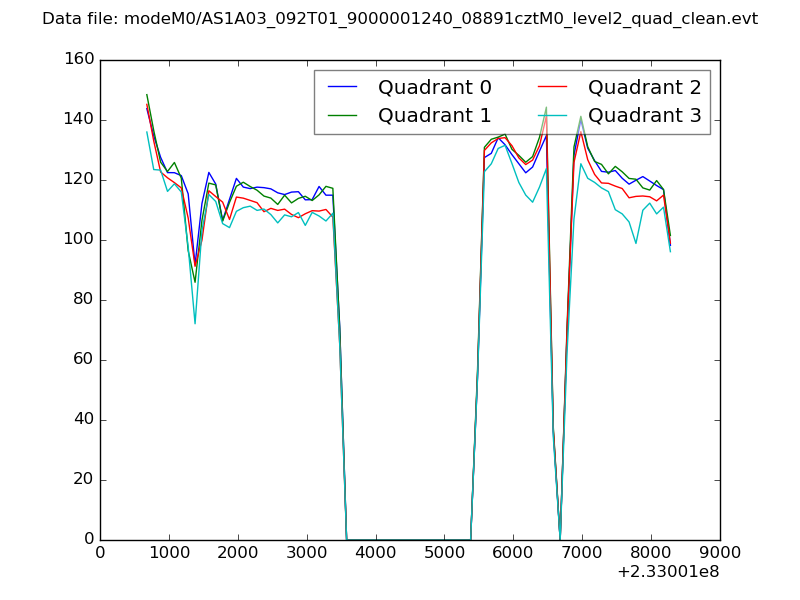 |
|
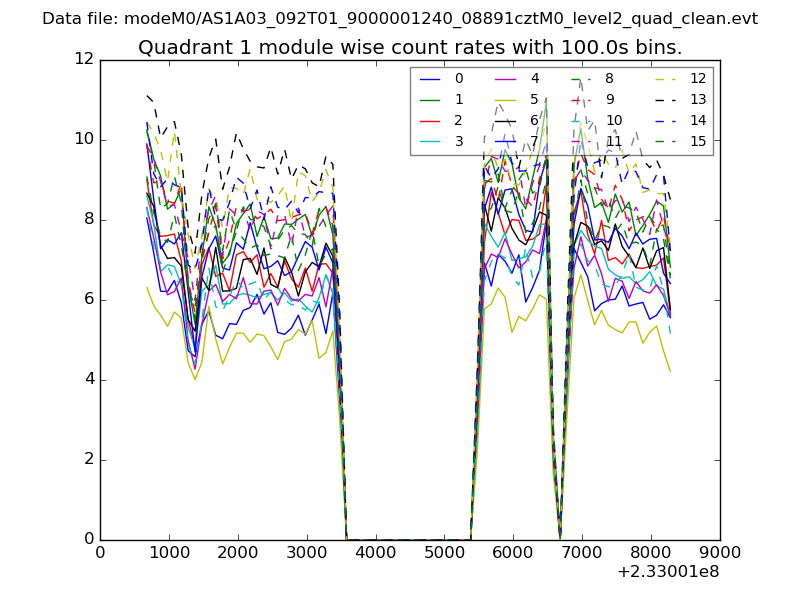
| Module-wise count rates for Quadrant A Data is divided into 100 sec bins |
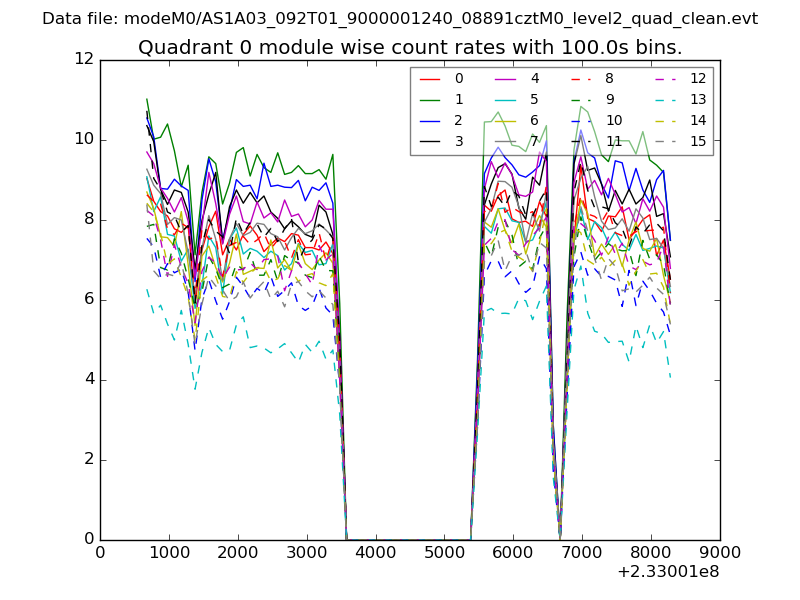 |
 |
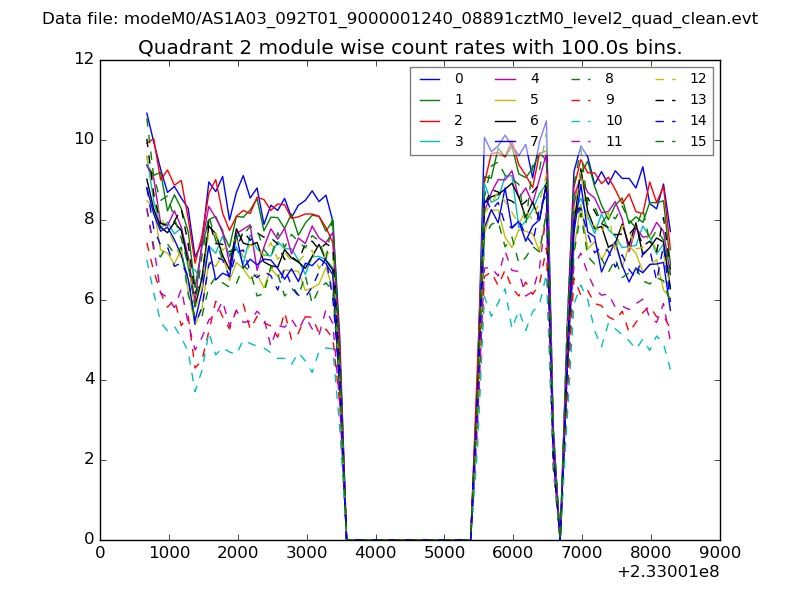
| Module-wise count rates for Quadrant B Data is divided into 100 sec bins |
 |
 |
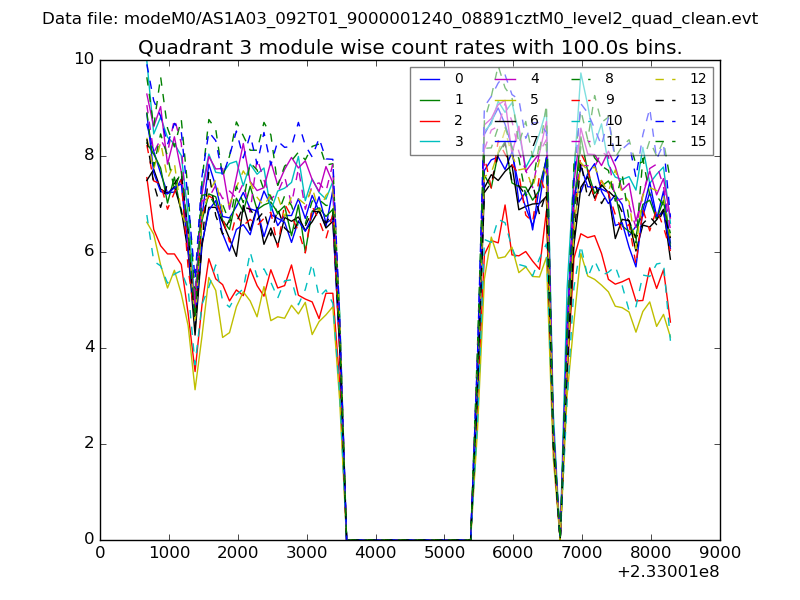
| Module-wise count rates for Quadrant C Data is divided into 100 sec bins |
 |
 |
| Module-wise count rates for Quadrant D Data is divided into 100 sec bins |
 |
 |
| Parameter | Plot |
|---|---|
| CZT HV Monitor | 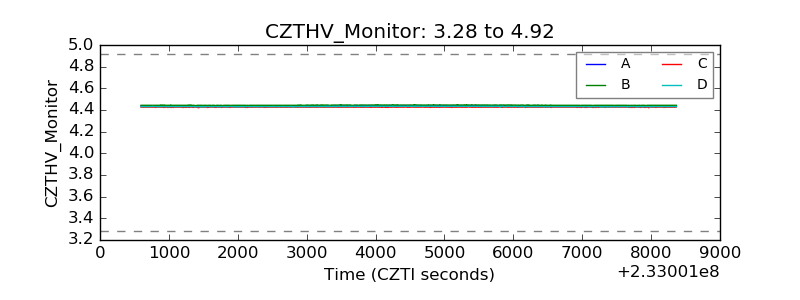 |
| D_VDD | 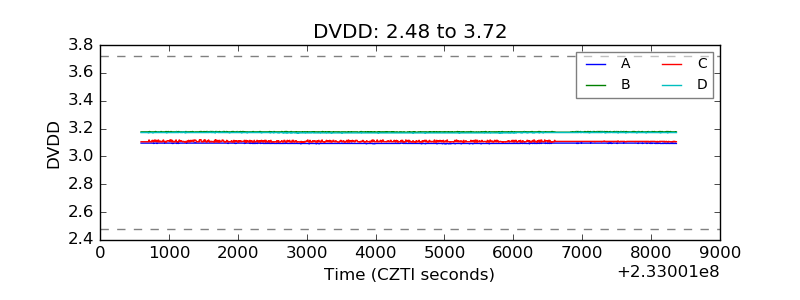 |
| Temperature 1 | 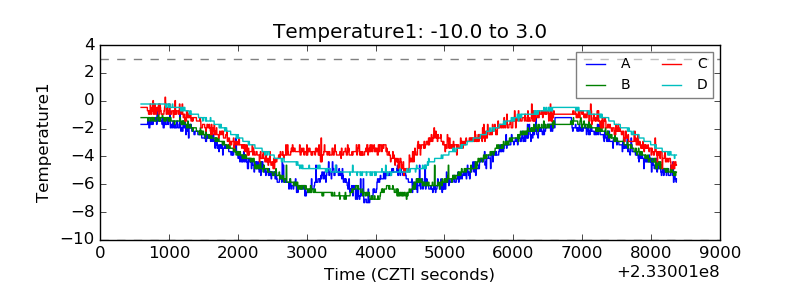 |
| Veto HV Monitor | 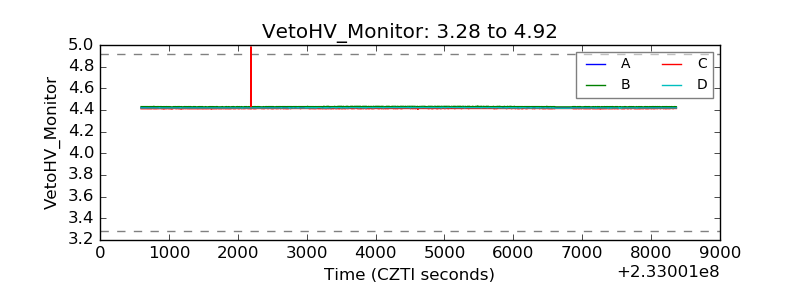 |
| Veto LLD | 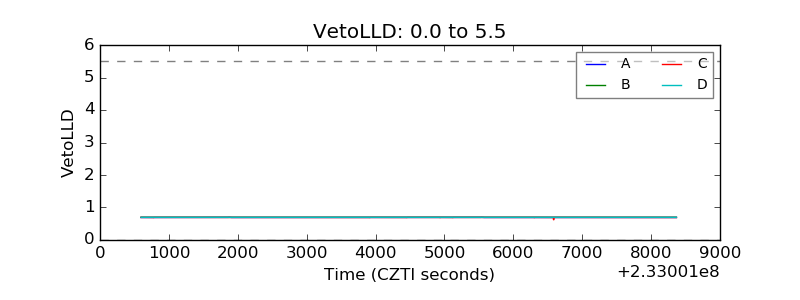 |
| Alpha Counter | 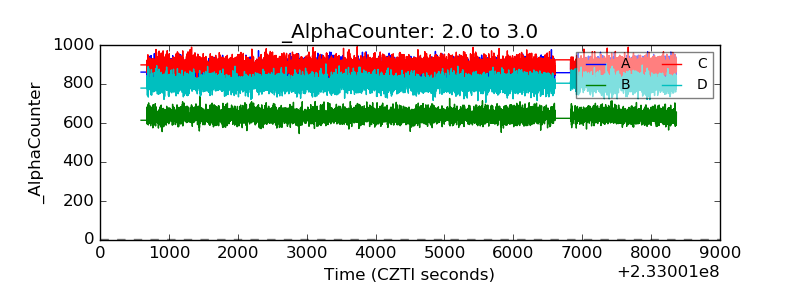 |
| _CPM_Rate | 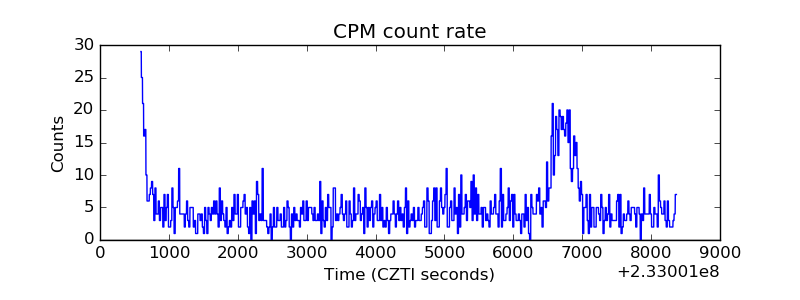 |
| CZT Counter | 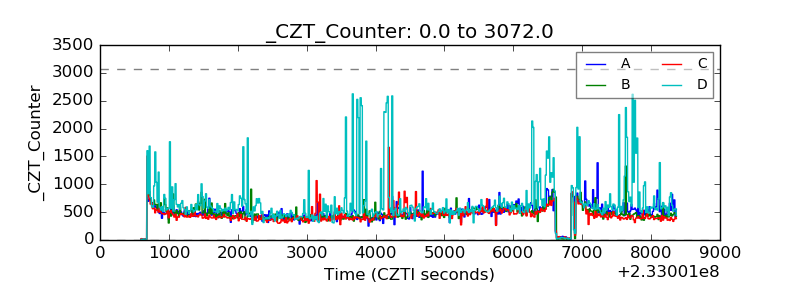 |
| +2.5 Volts monitor |  |
| +5 Volts monitor | 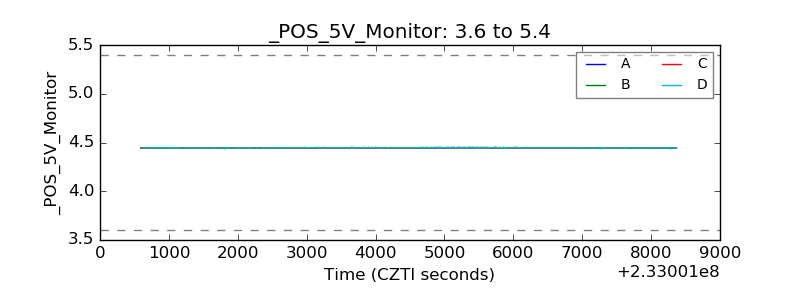 |
| _ROLL_ROT | 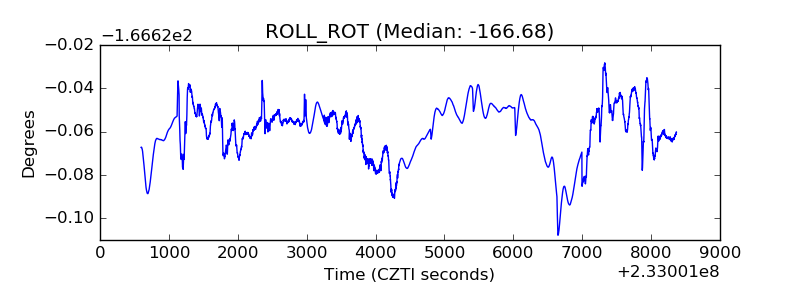 |
| _Roll_DEC | 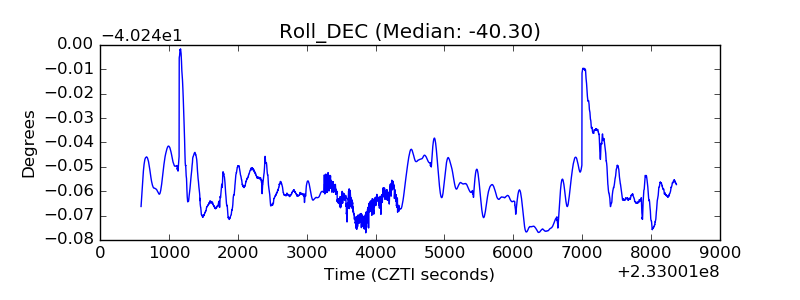 |
| _Roll_RA | 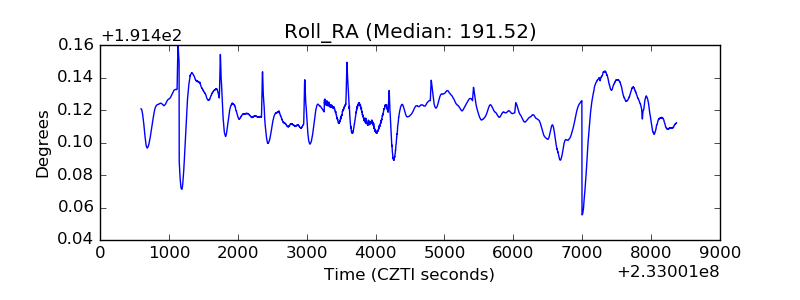 |
| Veto Counter | 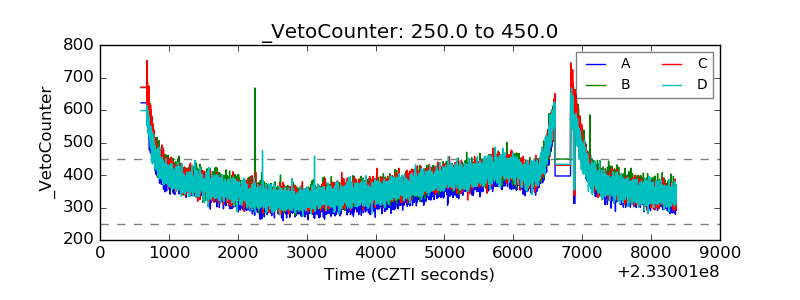 |