| Param | Original file | Final file |
|---|---|---|
| Filename | modeM0/AS1A03_092T01_9000001240_08892cztM0_level2.evt | modeM0/AS1A03_092T01_9000001240_08892cztM0_level2_quad_clean.evt |
| Size (bytes) | 601,853,760 | 117,812,160 |
| Size | 574.0 MB | 112.4 MB |
| Events in quadrant A | 4,724,974 | 762,038 |
| Events in quadrant B | 3,981,693 | 771,203 |
| Events in quadrant C | 3,630,665 | 746,790 |
| Events in quadrant D | 5,334,504 | 718,820 |
| Mode M9 | |||
|---|---|---|---|
| Quadrant | BADHDUFLAG | Total packets | Discarded packets |
| A | 0 | 6 | 0 |
| B | 0 | 6 | 0 |
| C | 0 | 6 | 0 |
| D | 0 | 6 | 0 |
| Mode SS | |||
|---|---|---|---|
| Quadrant | BADHDUFLAG | Total packets | Discarded packets |
| A | 0 | 170 | 0 |
| B | 0 | 170 | 0 |
| C | 0 | 170 | 0 |
| D | 0 | 170 | 0 |
| Mode M0 | |||
|---|---|---|---|
| Quadrant | BADHDUFLAG | Total packets | Discarded packets |
| A | 0 | 19422 | 3 |
| B | 0 | 17327 | 2 |
| C | 0 | 16798 | 2 |
| D | 0 | 21170 | 2 |
| Quadrant | Total seconds | Saturated seconds | Saturation percentage |
|---|---|---|---|
| A | 8191 | 110 | 1.342937% |
| B | 8191 | 82 | 1.001099% |
| C | 8191 | 34 | 0.415090% |
| D | 8191 | 249 | 3.039922% |
Noise dominated data is calculated using 1-second bins in cleaned event files. If a bin has >2000 counts, and if more than 50% of those come from <1% of pixels, then it is considered to be noise-dominated and hence unusable.
| Quadrant | # 1 sec bins | Bins with >0 counts | Bins with >2000 counts | High rate bins dominated by noise | Noise dominated (total time) | Noise dominated (detector-on time) | Marked lightcurve |
|---|---|---|---|---|---|---|---|
| A | 8741 | 8193 | 21 | 21 | 0.24% | 0.26% | 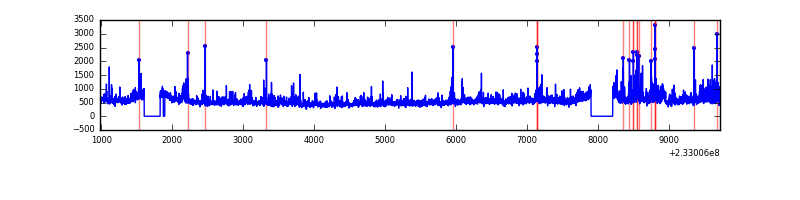 |
| B | 8741 | 8194 | 3 | 3 | 0.03% | 0.04% | 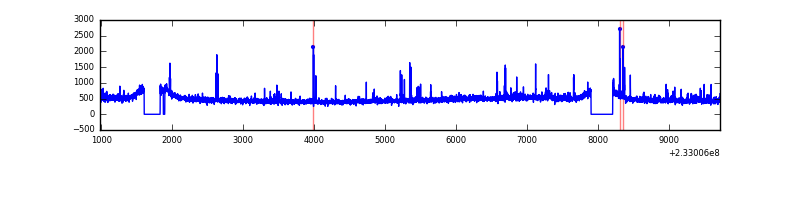 |
| C | 8741 | 8194 | 0 | 0 | 0.00% | 0.00% | 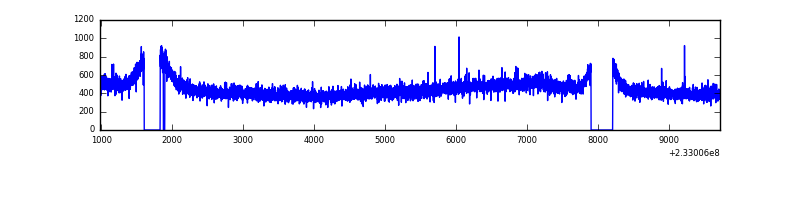 |
| D | 8741 | 8194 | 130 | 130 | 1.49% | 1.59% | 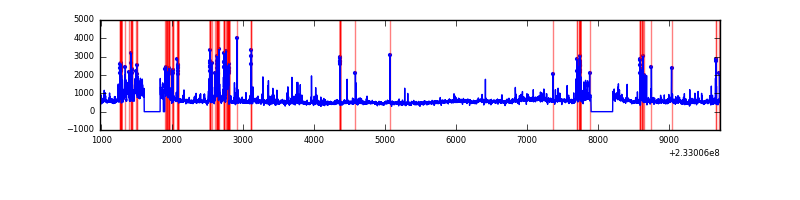 |
Top three noisy pixels from each quadrant. If the there are fewer than three noisy pixels in the level2.evt file, extra rows are filled as -1
| Pixel properties | Quadrant properties | ||||||
|---|---|---|---|---|---|---|---|
| Quadrant | DetID | PixID | Counts | Sigma | Mean | Median | Sigma |
| A | 8 | 5 | 888723 | 4455.78 | 971 | 951 | 199.2 |
| A | 13 | 164 | 29089 | 141.23 | 971 | 951 | 199.2 |
| A | 15 | 174 | 24857 | 119.99 | 971 | 951 | 199.2 |
| B | 0 | 214 | 48482 | 253.39 | 975 | 950 | 187.6 |
| B | 6 | 51 | 43922 | 229.08 | 975 | 950 | 187.6 |
| B | 10 | 16 | 40809 | 212.48 | 975 | 950 | 187.6 |
| C | 13 | 61 | 7426 | 30.19 | 927 | 929 | 215.2 |
| C | 1 | 176 | 3715 | 12.94 | 927 | 929 | 215.2 |
| C | 12 | 4 | 3365 | 11.32 | 927 | 929 | 215.2 |
| D | 8 | 195 | 833640 | 3375.12 | 918 | 895 | 246.7 |
| D | 7 | 71 | 406894 | 1645.52 | 918 | 895 | 246.7 |
| D | 1 | 52 | 280959 | 1135.1 | 918 | 895 | 246.7 |
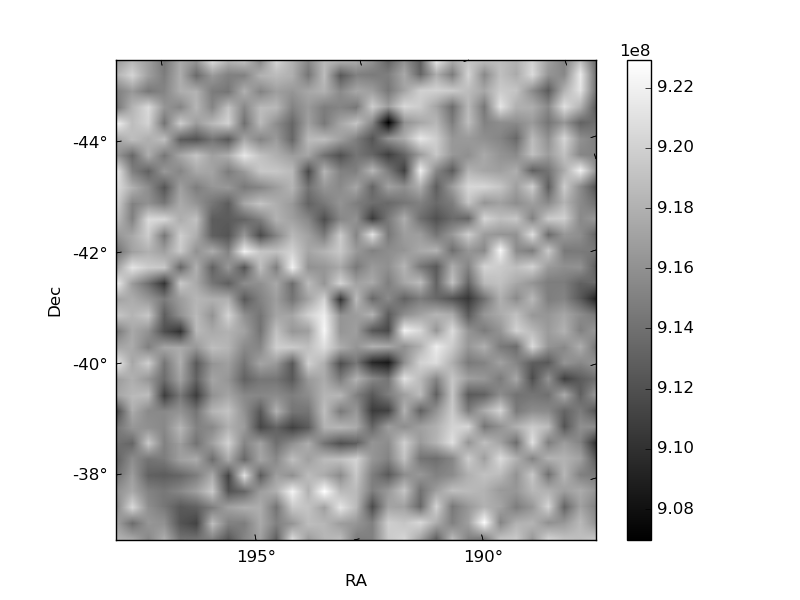
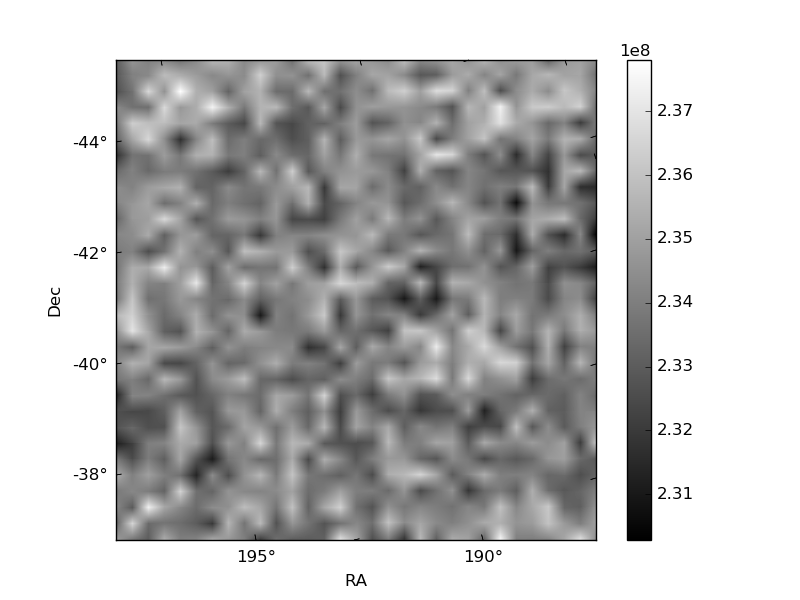
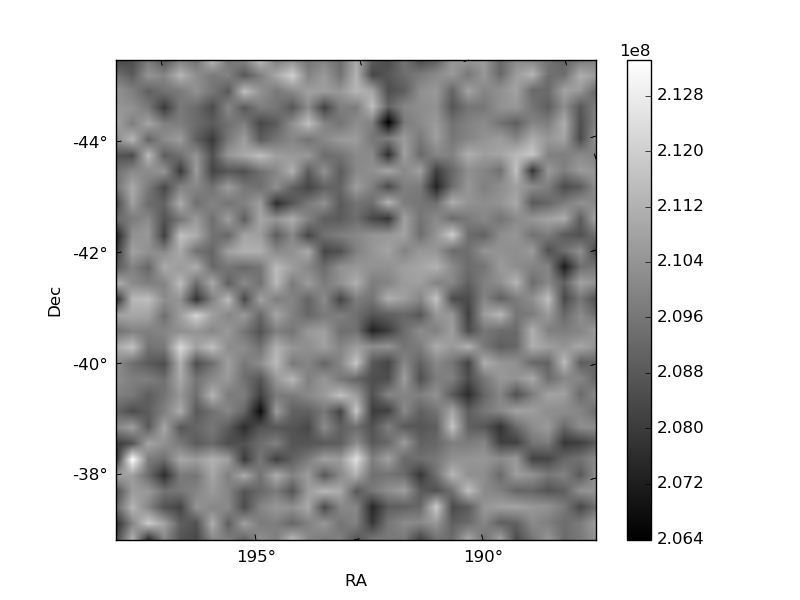
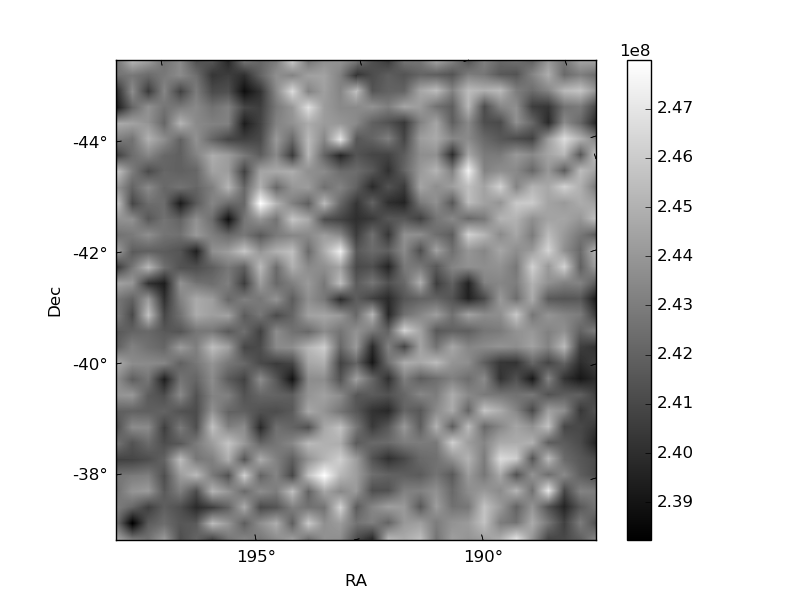
Histogram calculated using DETX and DETY for each event in the final _common_clean file
| Quadrant A | 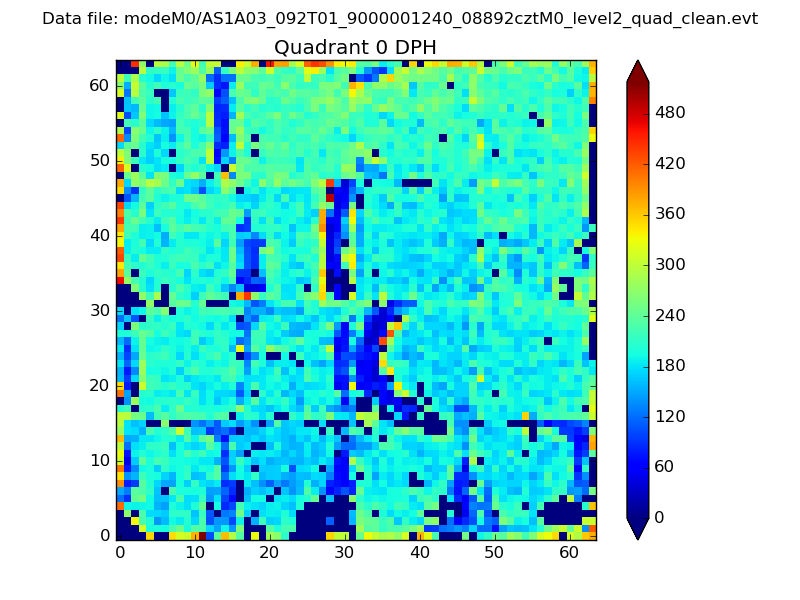 |
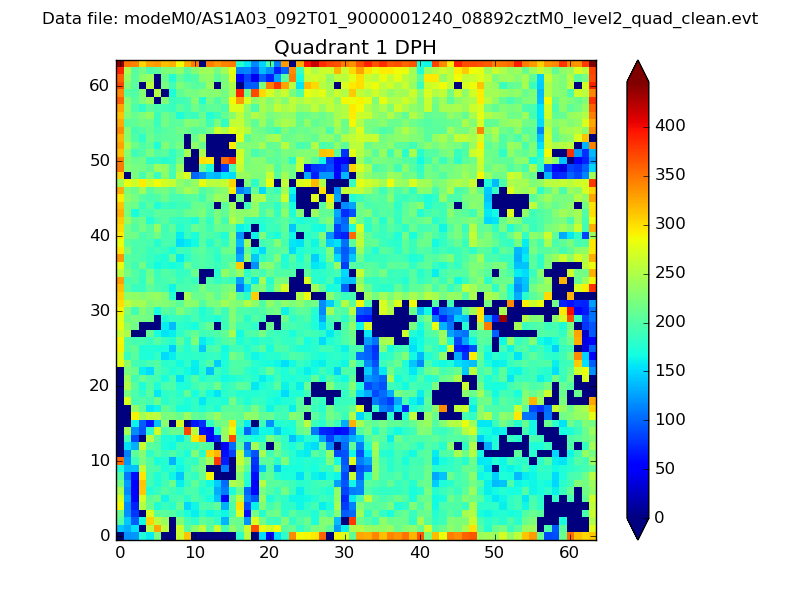 |
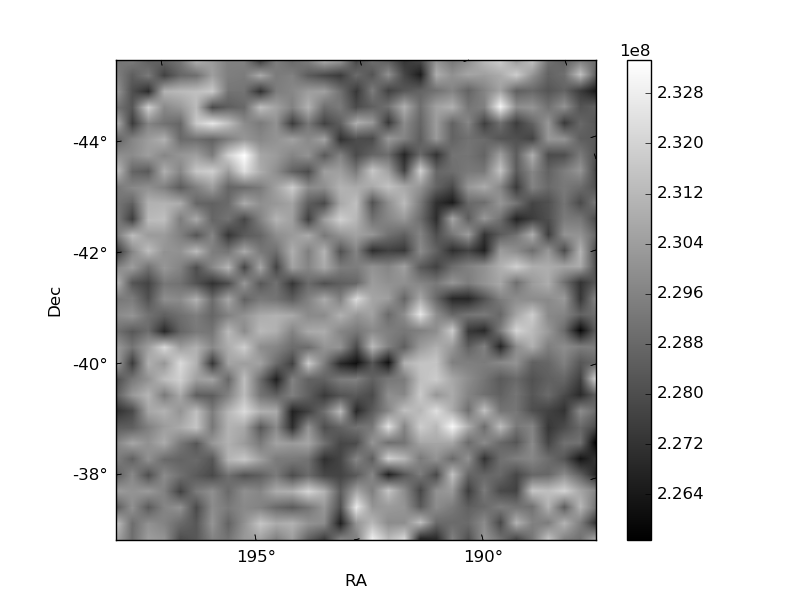
Quadrant B |
|---|---|---|---|
| Quadrant D | 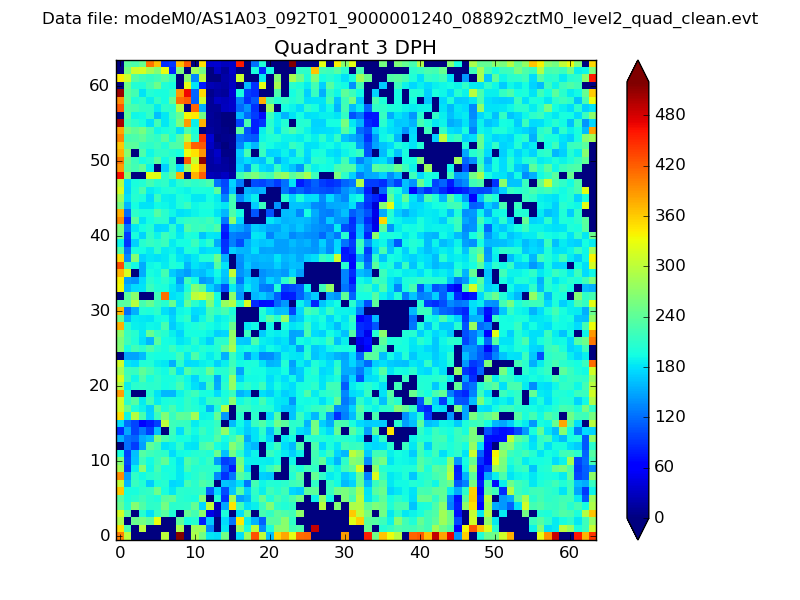 |
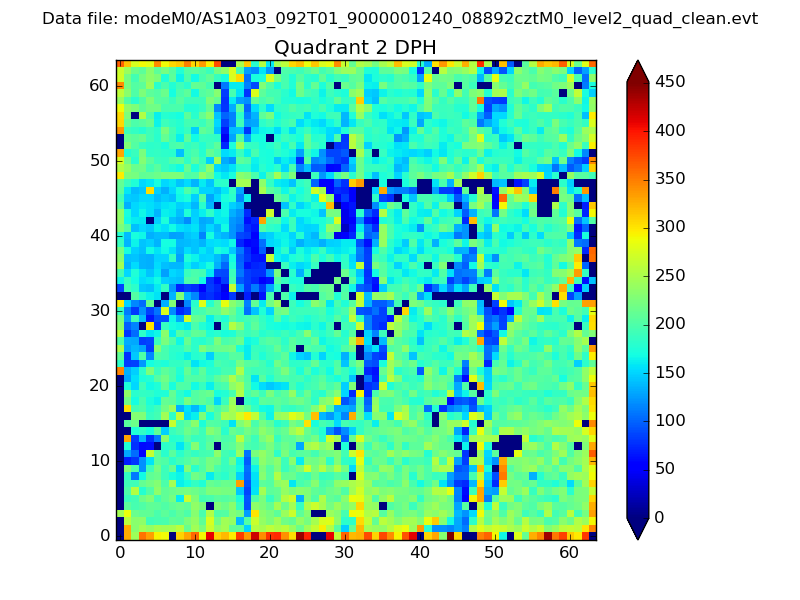 |
Quadrant C |
| Plot type | Count rate plots | Images |
|---|---|---|
| Comparison with Poisson distribution Blue bars denote a histogram of data divided into 1 sec bins. Red curve is a Poisson curve with rate = median count rate of data. |
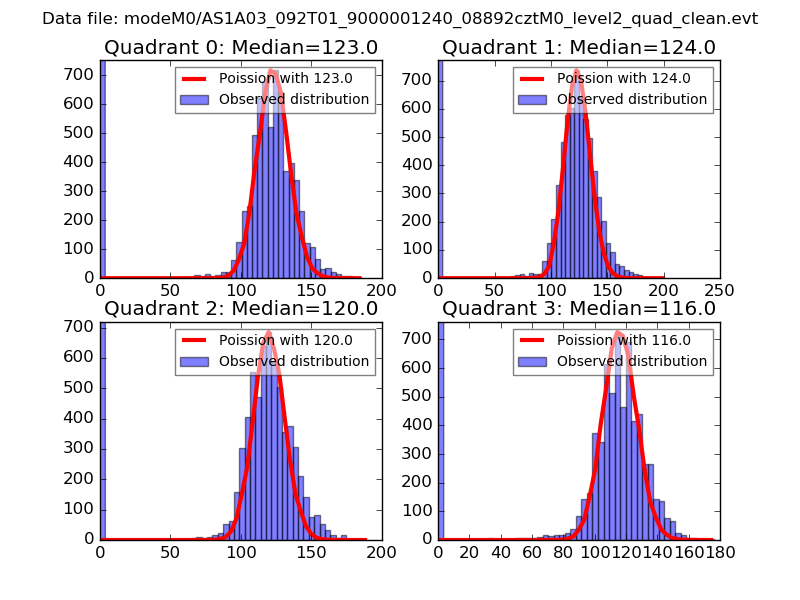 |
 |
| Quadrant-wise count rates Data is divided into 100 sec bins |
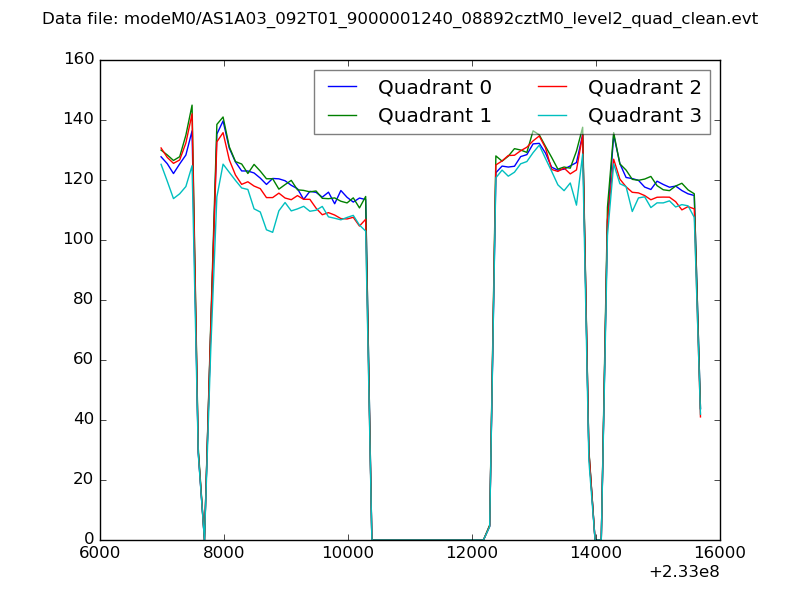 |
|
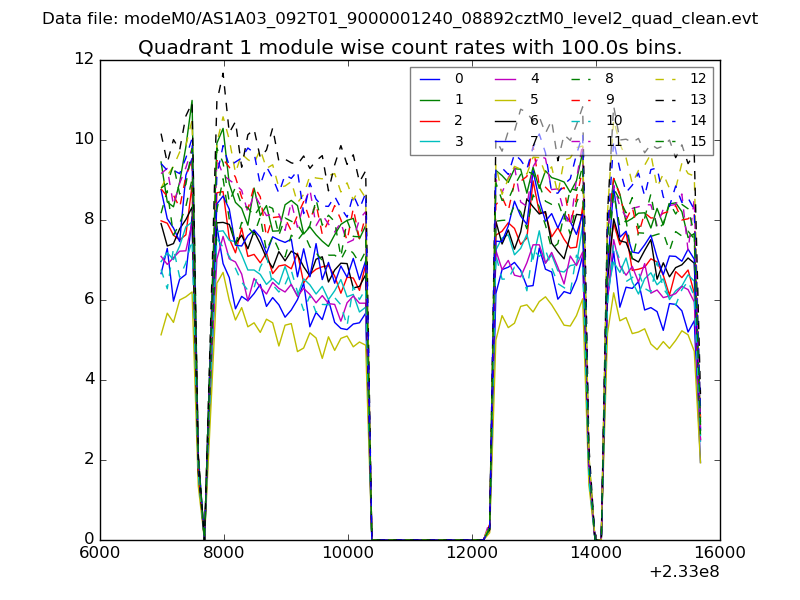
| Module-wise count rates for Quadrant A Data is divided into 100 sec bins |
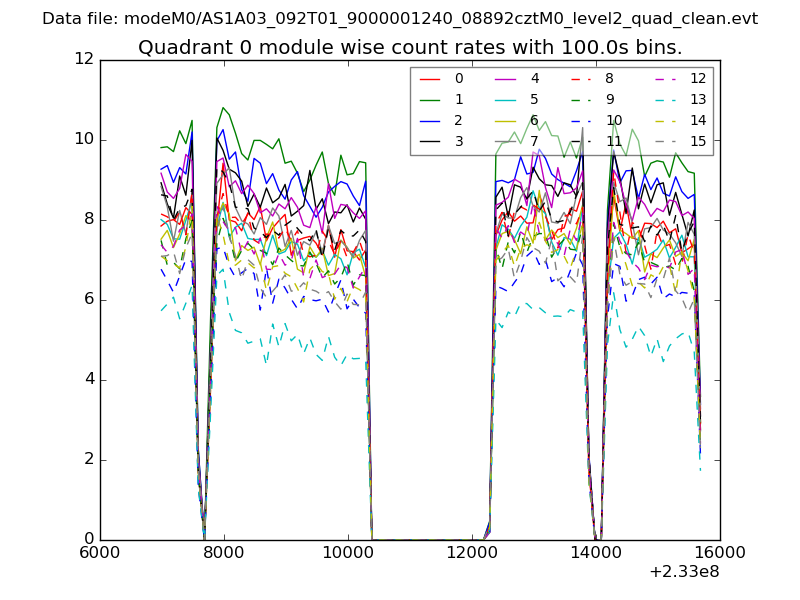 |
 |
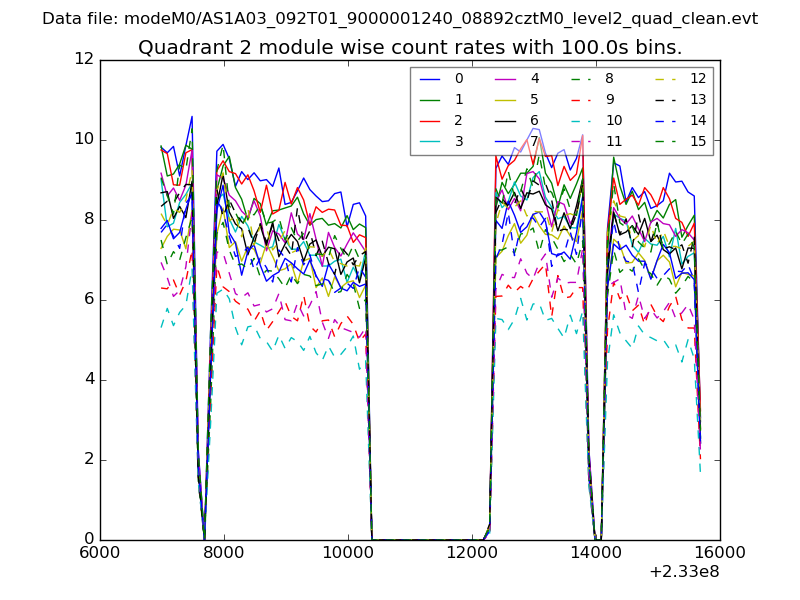
| Module-wise count rates for Quadrant B Data is divided into 100 sec bins |
 |
 |
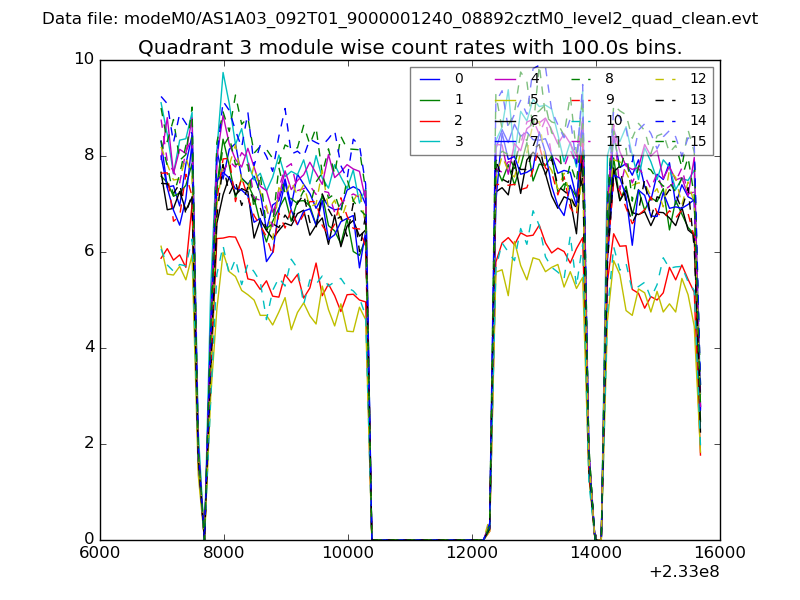
| Module-wise count rates for Quadrant C Data is divided into 100 sec bins |
 |
 |
| Module-wise count rates for Quadrant D Data is divided into 100 sec bins |
 |
 |
| Parameter | Plot |
|---|---|
| CZT HV Monitor | 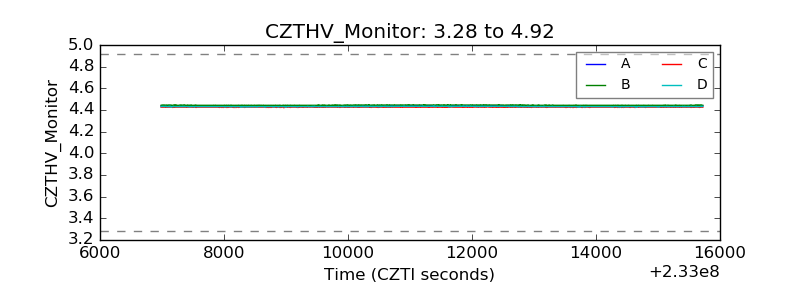 |
| D_VDD | 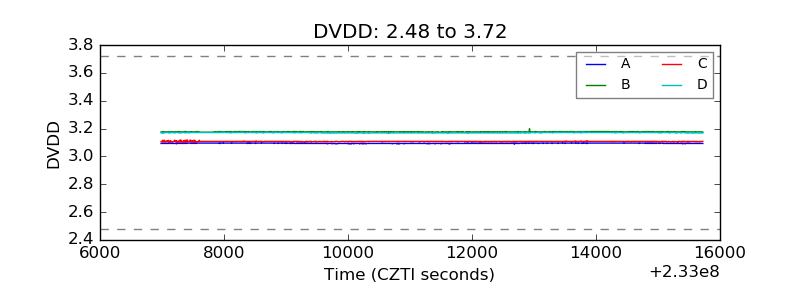 |
| Temperature 1 | 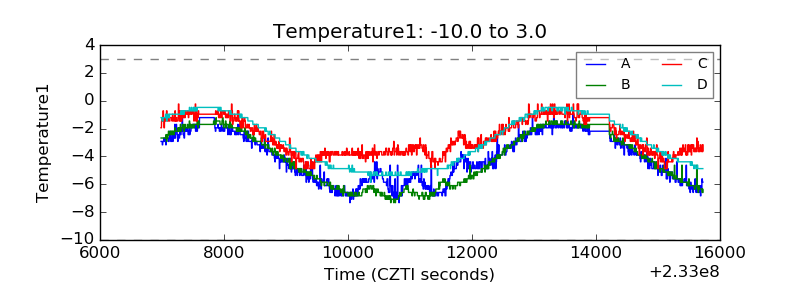 |
| Veto HV Monitor | 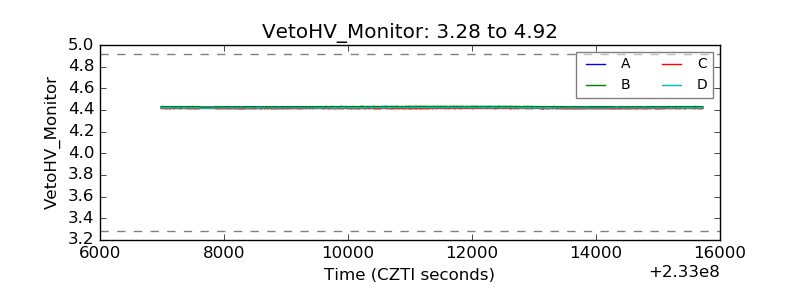 |
| Veto LLD | 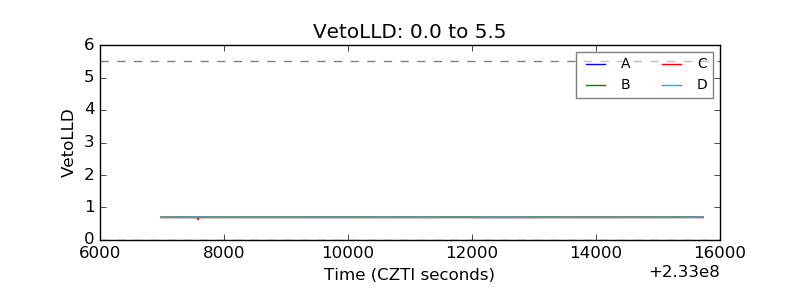 |
| Alpha Counter | 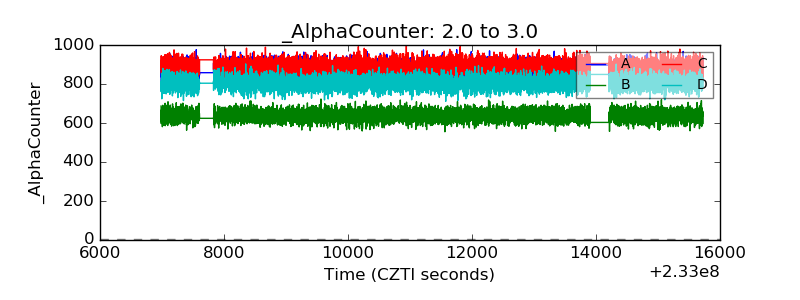 |
| _CPM_Rate | 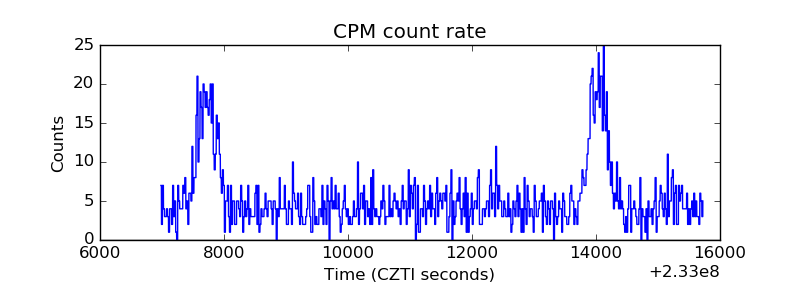 |
| CZT Counter | 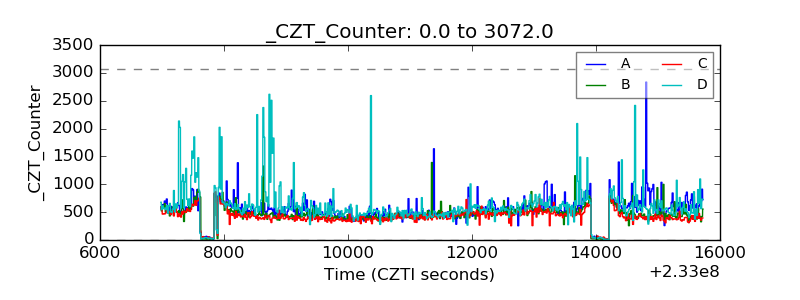 |
| +2.5 Volts monitor |  |
| +5 Volts monitor |  |
| _ROLL_ROT | 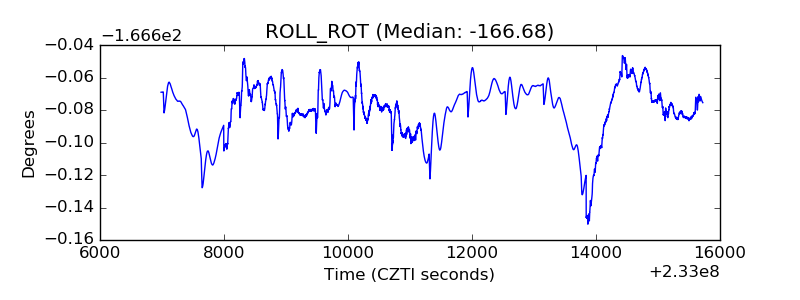 |
| _Roll_DEC | 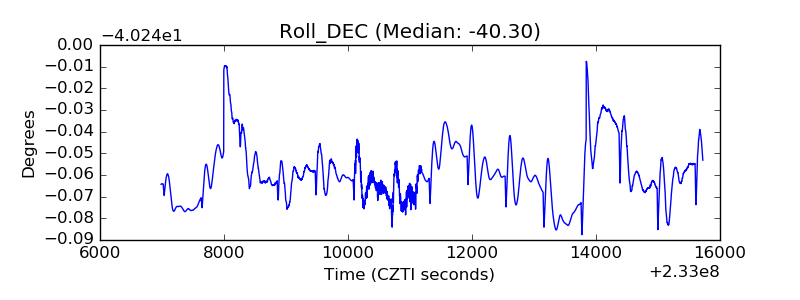 |
| _Roll_RA | 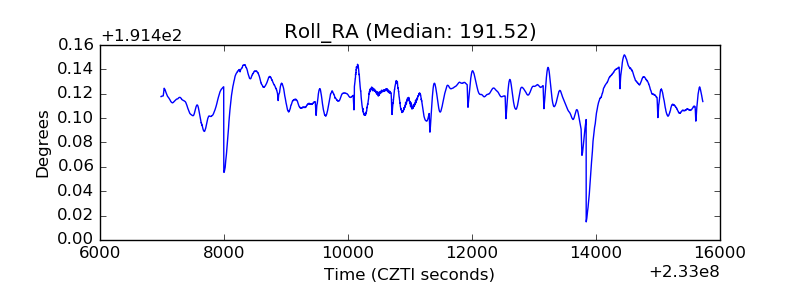 |
| Veto Counter | 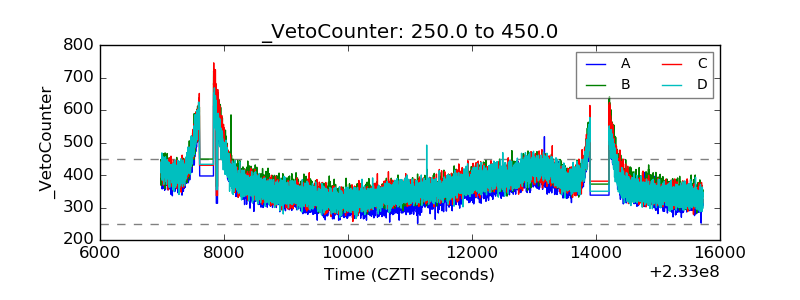 |