| Param | Original file | Final file |
|---|---|---|
| Filename | modeM0/AS1A03_092T01_9000001240_08896cztM0_level2.evt | modeM0/AS1A03_092T01_9000001240_08896cztM0_level2_quad_clean.evt |
| Size (bytes) | 441,161,280 | 72,051,840 |
| Size | 420.7 MB | 68.7 MB |
| Events in quadrant A | 3,199,841 | 434,077 |
| Events in quadrant B | 3,160,243 | 437,444 |
| Events in quadrant C | 2,983,941 | 428,014 |
| Events in quadrant D | 3,559,033 | 412,961 |
| Mode M9 | |||
|---|---|---|---|
| Quadrant | BADHDUFLAG | Total packets | Discarded packets |
| A | 0 | 9 | 0 |
| B | 0 | 9 | 0 |
| C | 0 | 9 | 0 |
| D | 0 | 9 | 0 |
| Mode SS | |||
|---|---|---|---|
| Quadrant | BADHDUFLAG | Total packets | Discarded packets |
| A | 0 | 136 | 0 |
| B | 0 | 136 | 0 |
| C | 0 | 136 | 0 |
| D | 0 | 136 | 0 |
| Mode M0 | |||
|---|---|---|---|
| Quadrant | BADHDUFLAG | Total packets | Discarded packets |
| A | 0 | 13809 | 2 |
| B | 0 | 13832 | 1 |
| C | 0 | 13640 | 1 |
| D | 0 | 14702 | 1 |
| Quadrant | Total seconds | Saturated seconds | Saturation percentage |
|---|---|---|---|
| A | 6733 | 39 | 0.579237% |
| B | 6733 | 52 | 0.772315% |
| C | 6733 | 34 | 0.504975% |
| D | 6733 | 84 | 1.247587% |
Noise dominated data is calculated using 1-second bins in cleaned event files. If a bin has >2000 counts, and if more than 50% of those come from <1% of pixels, then it is considered to be noise-dominated and hence unusable.
| Quadrant | # 1 sec bins | Bins with >0 counts | Bins with >2000 counts | High rate bins dominated by noise | Noise dominated (total time) | Noise dominated (detector-on time) | Marked lightcurve |
|---|---|---|---|---|---|---|---|
| A | 7638 | 6733 | 0 | 0 | 0.00% | 0.00% | 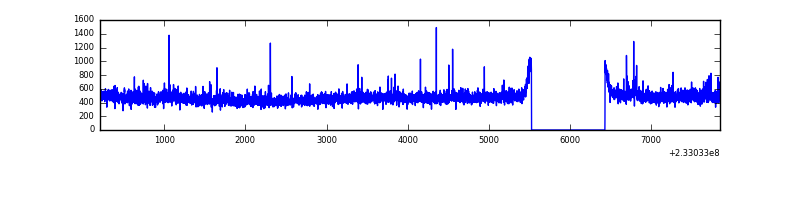 |
| B | 7638 | 6733 | 6 | 6 | 0.08% | 0.09% | 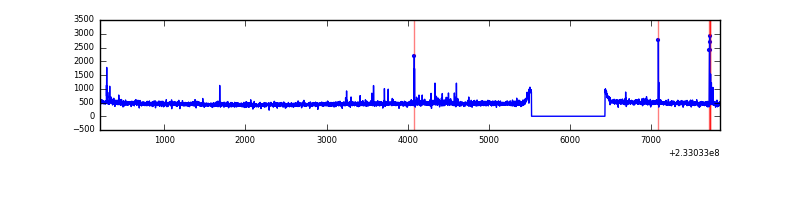 |
| C | 7638 | 6733 | 0 | 0 | 0.00% | 0.00% | 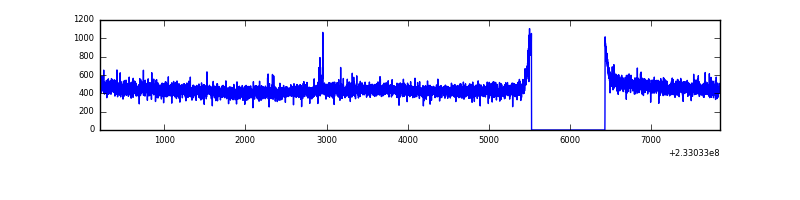 |
| D | 7638 | 6733 | 46 | 46 | 0.60% | 0.68% | 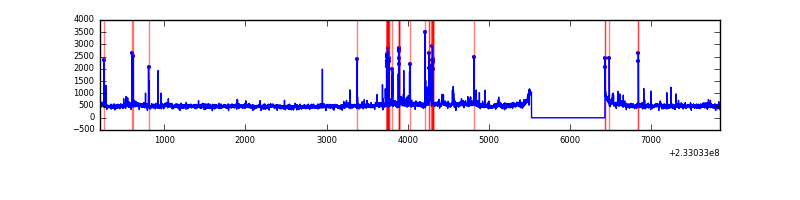 |
Top three noisy pixels from each quadrant. If the there are fewer than three noisy pixels in the level2.evt file, extra rows are filled as -1
| Pixel properties | Quadrant properties | ||||||
|---|---|---|---|---|---|---|---|
| Quadrant | DetID | PixID | Counts | Sigma | Mean | Median | Sigma |
| A | 8 | 5 | 148709 | 924.84 | 787 | 769 | 160.0 |
| A | 5 | 16 | 14202 | 83.98 | 787 | 769 | 160.0 |
| A | 0 | 226 | 7317 | 40.93 | 787 | 769 | 160.0 |
| B | 10 | 16 | 39377 | 255.2 | 792 | 770 | 151.3 |
| B | 0 | 214 | 24107 | 154.26 | 792 | 770 | 151.3 |
| B | 12 | 111 | 16443 | 103.6 | 792 | 770 | 151.3 |
| C | 13 | 61 | 5741 | 28.1 | 763 | 766 | 177.1 |
| C | 14 | 234 | 5036 | 24.12 | 763 | 766 | 177.1 |
| C | 12 | 4 | 3625 | 16.15 | 763 | 766 | 177.1 |
| D | 8 | 195 | 401462 | 2054.78 | 751 | 730 | 195.0 |
| D | 7 | 71 | 176031 | 898.87 | 751 | 730 | 195.0 |
| D | 1 | 52 | 59382 | 300.74 | 751 | 730 | 195.0 |
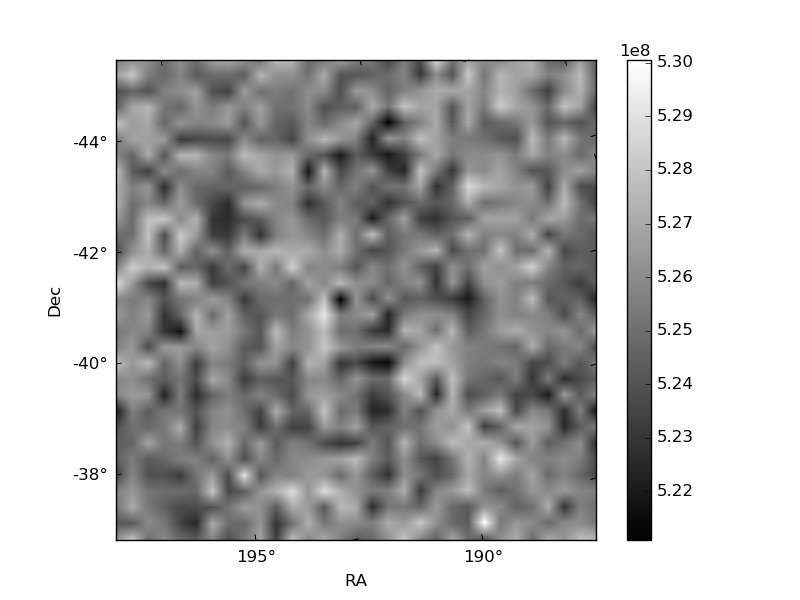
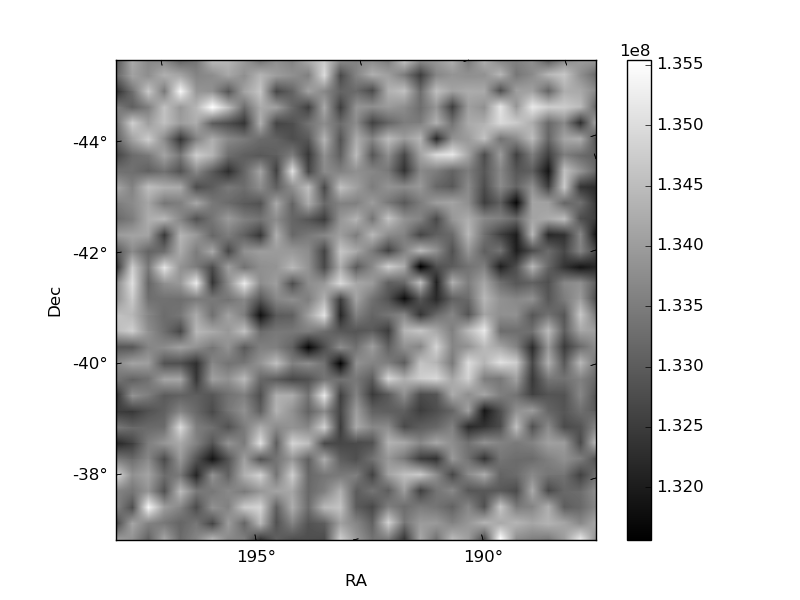
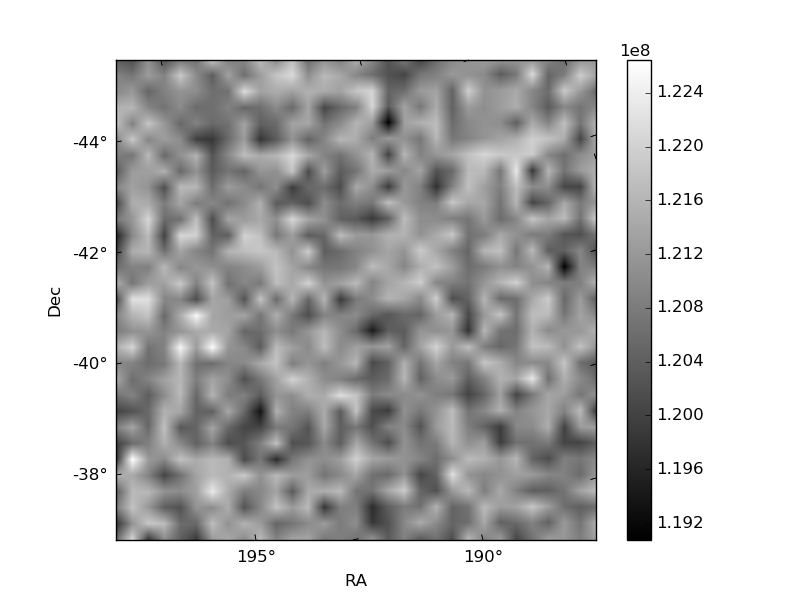
Histogram calculated using DETX and DETY for each event in the final _common_clean file
| Quadrant A | 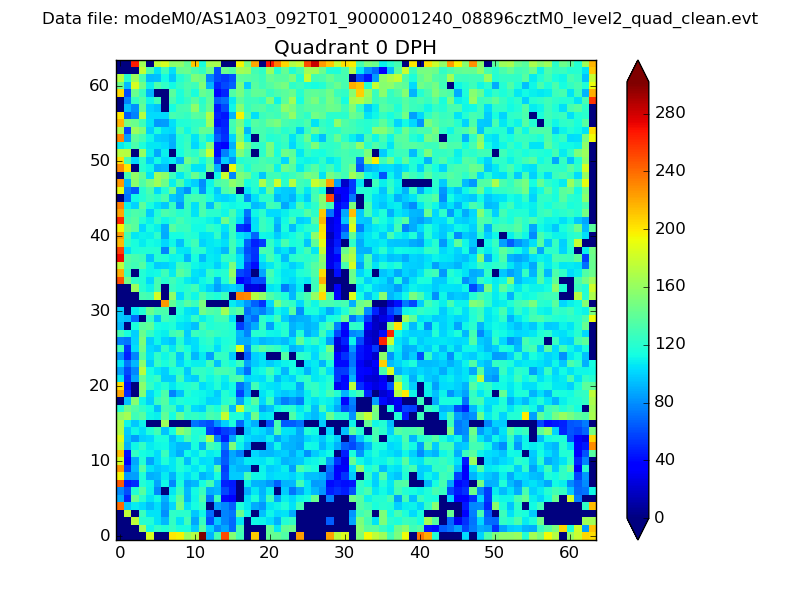 |
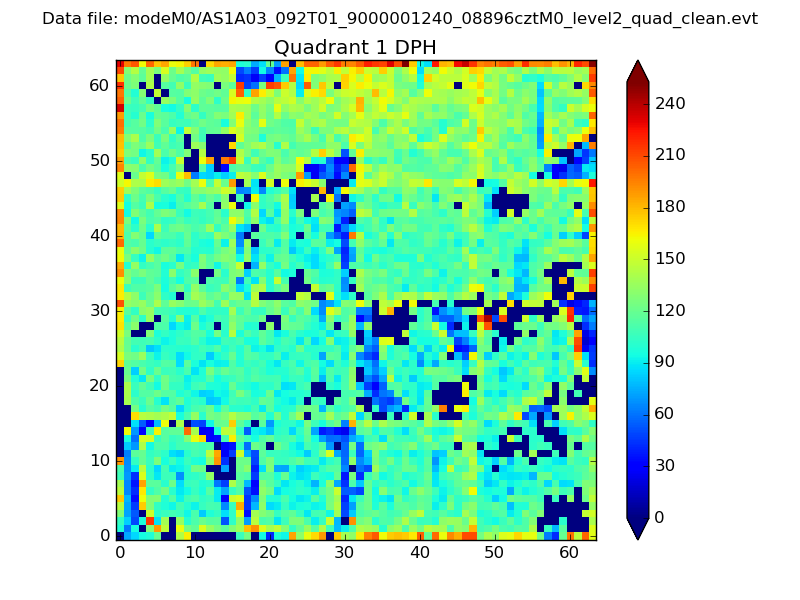 |
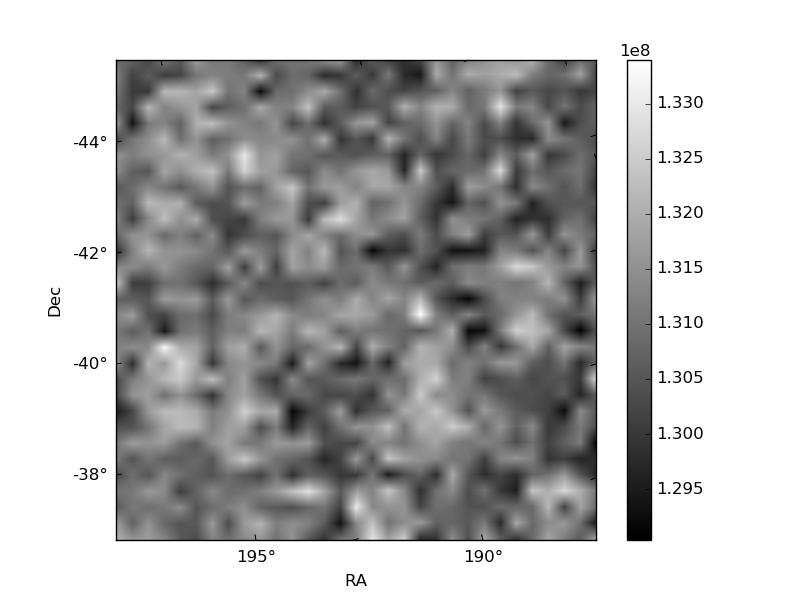
Quadrant B |
|---|---|---|---|
| Quadrant D | 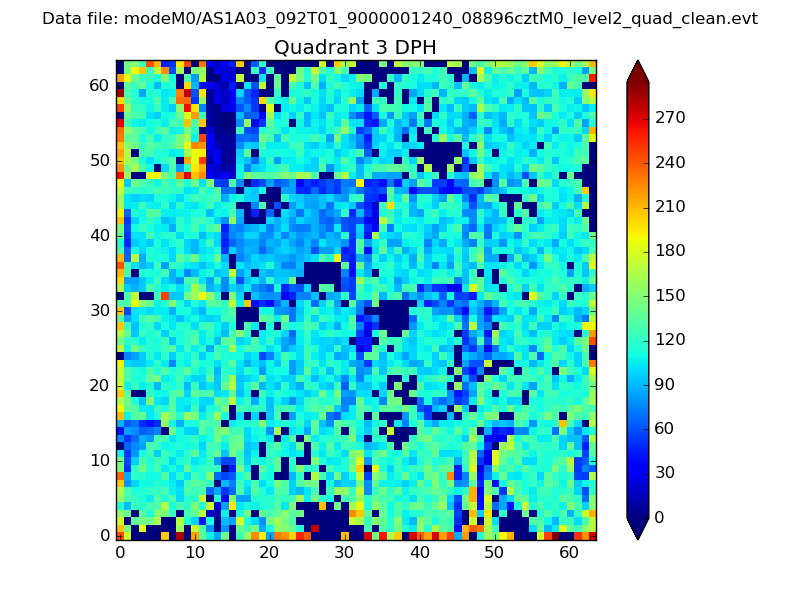 |
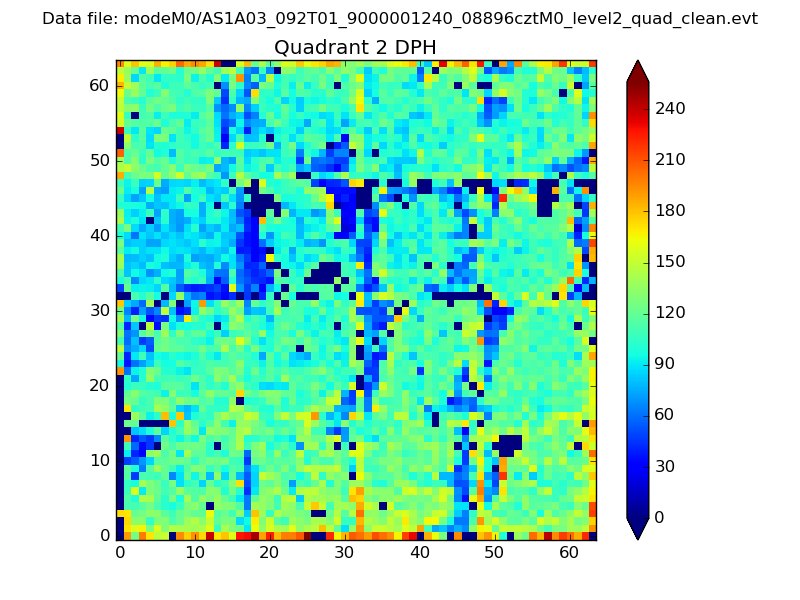 |
Quadrant C |
| Plot type | Count rate plots | Images |
|---|---|---|
| Comparison with Poisson distribution Blue bars denote a histogram of data divided into 1 sec bins. Red curve is a Poisson curve with rate = median count rate of data. |
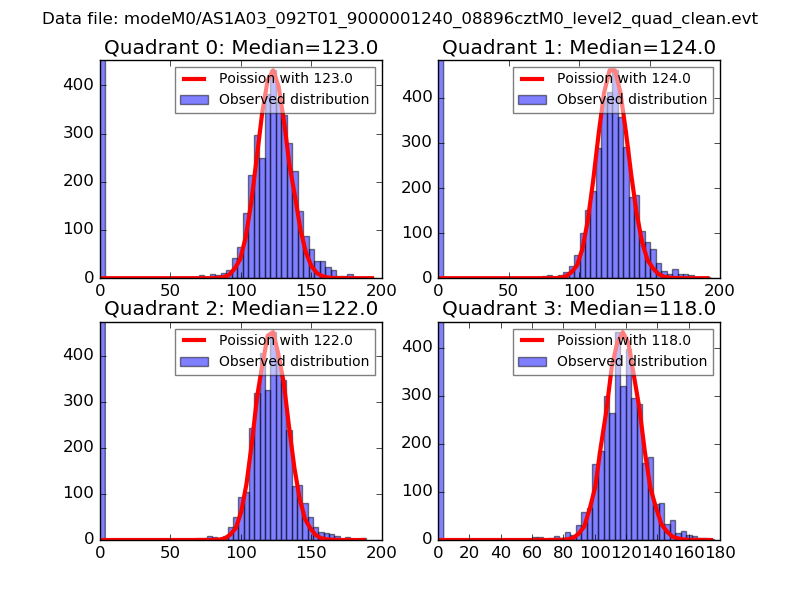 |
 |
| Quadrant-wise count rates Data is divided into 100 sec bins |
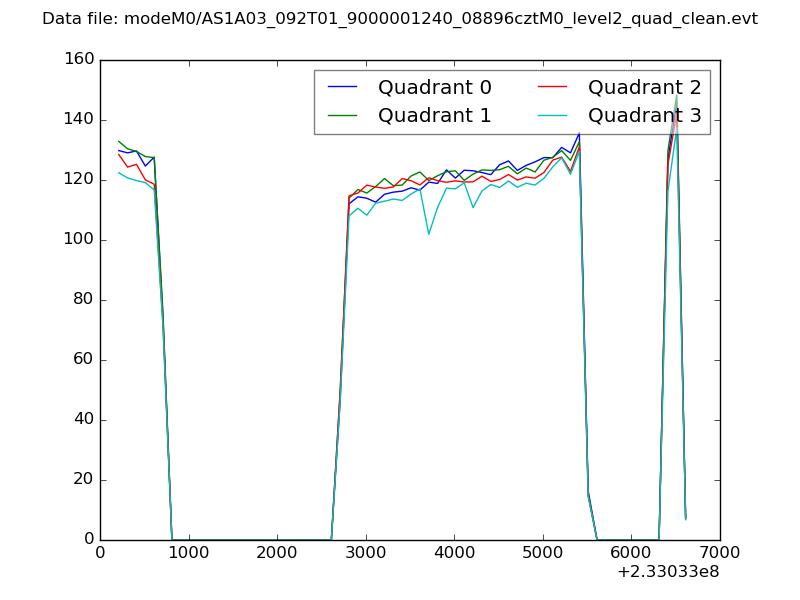 |
|
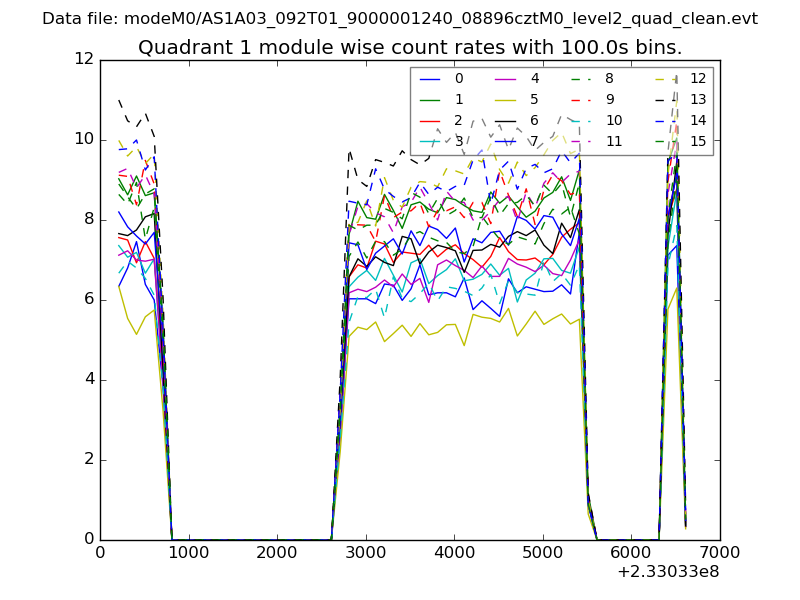
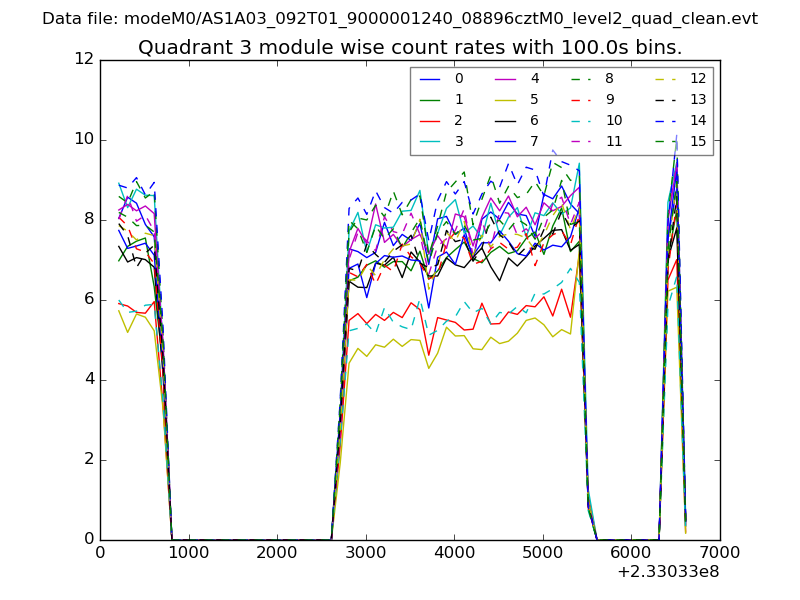
| Module-wise count rates for Quadrant A Data is divided into 100 sec bins |
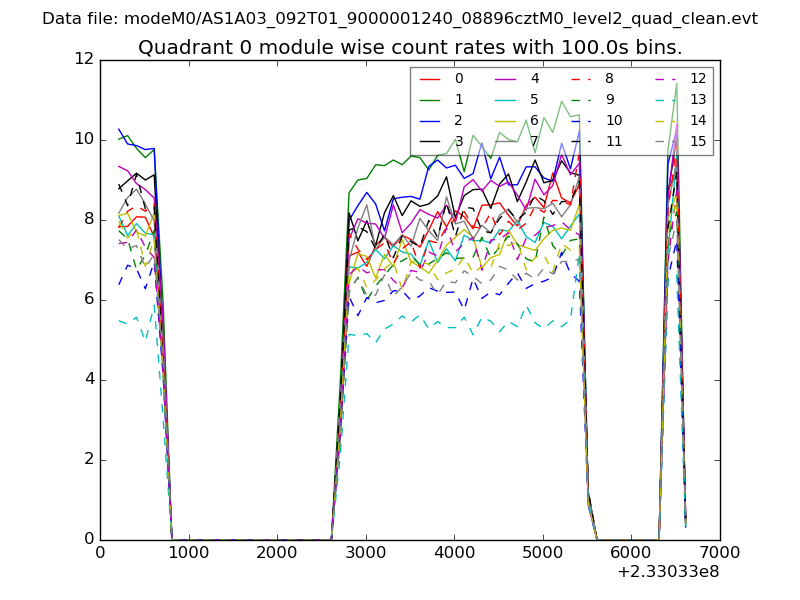 |
 |
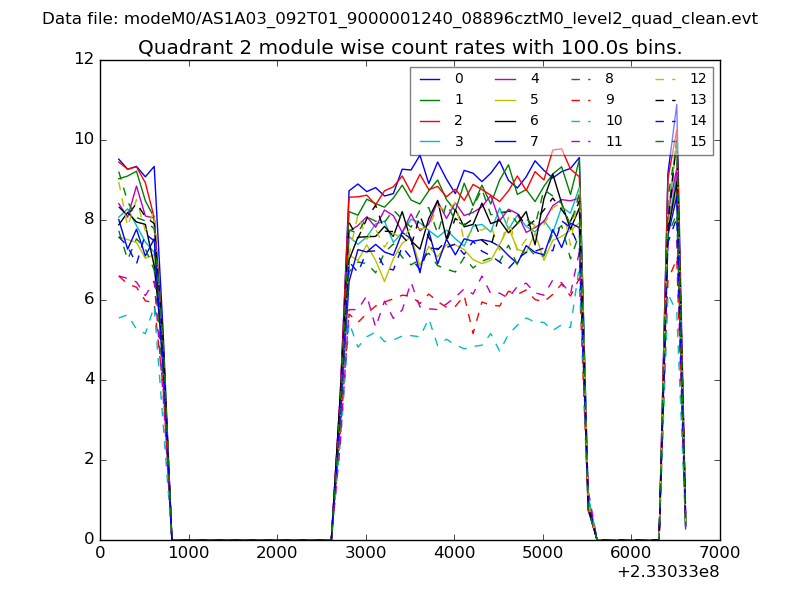
| Module-wise count rates for Quadrant B Data is divided into 100 sec bins |
 |
 |
| Module-wise count rates for Quadrant C Data is divided into 100 sec bins |
 |
 |
| Module-wise count rates for Quadrant D Data is divided into 100 sec bins |
 |
 |
| Parameter | Plot |
|---|---|
| CZT HV Monitor | 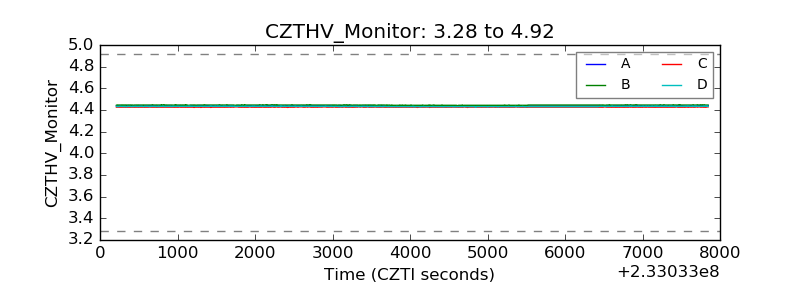 |
| D_VDD |  |
| Temperature 1 | 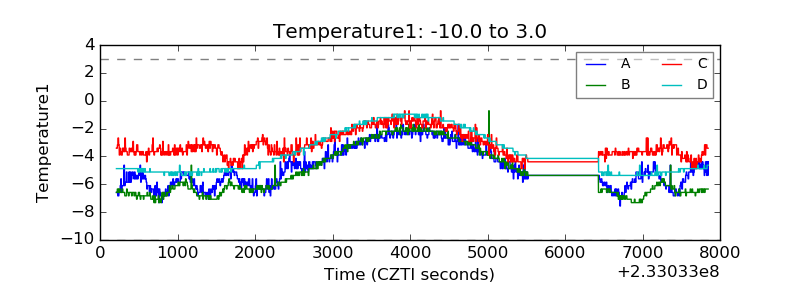 |
| Veto HV Monitor |  |
| Veto LLD | 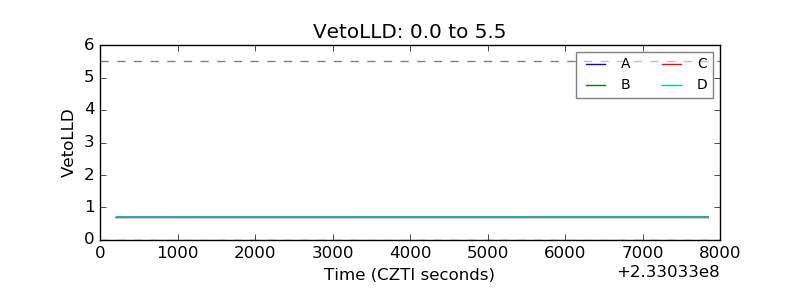 |
| Alpha Counter | 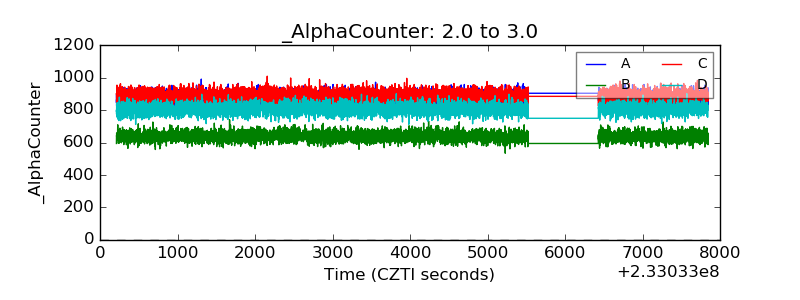 |
| _CPM_Rate | 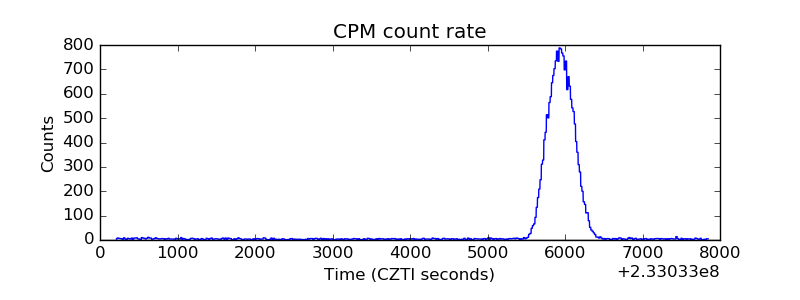 |
| CZT Counter | 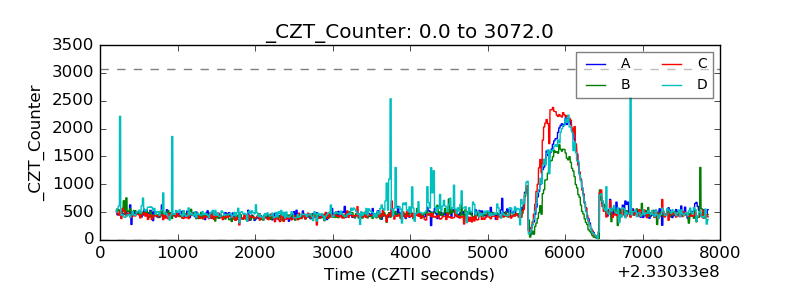 |
| +2.5 Volts monitor |  |
| +5 Volts monitor |  |
| _ROLL_ROT | 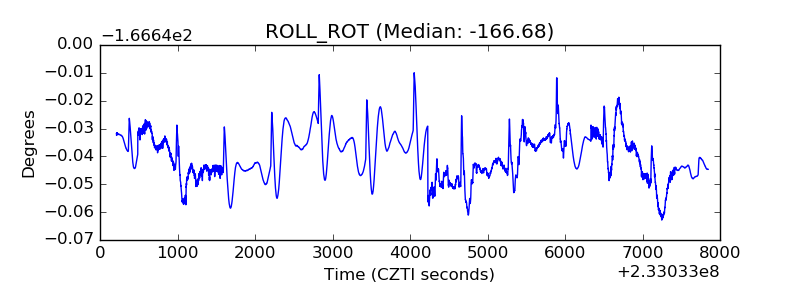 |
| _Roll_DEC | 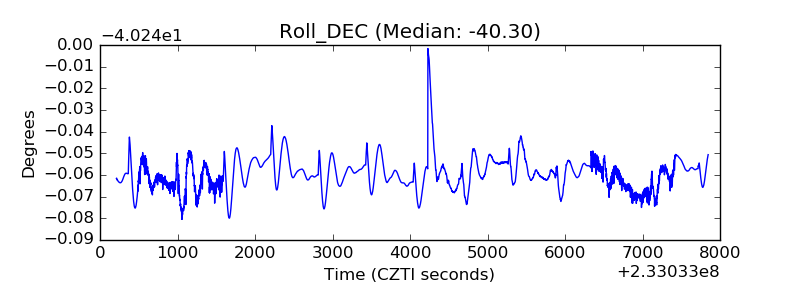 |
| _Roll_RA |  |
| Veto Counter | 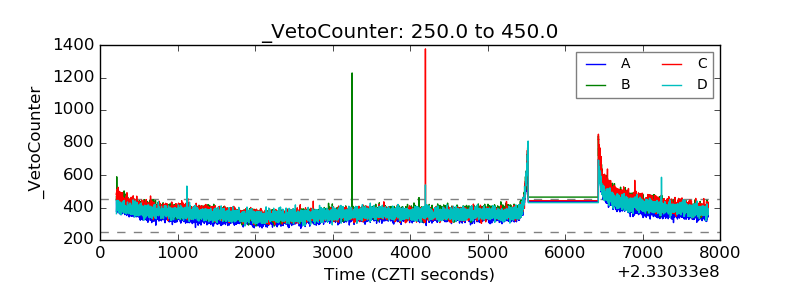 |