| Param | Original file | Final file |
|---|---|---|
| Filename | modeM0/AS1A03_092T01_9000001240_08898cztM0_level2.evt | modeM0/AS1A03_092T01_9000001240_08898cztM0_level2_quad_clean.evt |
| Size (bytes) | 445,973,760 | 77,811,840 |
| Size | 425.3 MB | 74.2 MB |
| Events in quadrant A | 3,377,162 | 482,232 |
| Events in quadrant B | 3,134,437 | 484,898 |
| Events in quadrant C | 2,930,605 | 477,849 |
| Events in quadrant D | 3,628,445 | 463,950 |
| Mode M9 | |||
|---|---|---|---|
| Quadrant | BADHDUFLAG | Total packets | Discarded packets |
| A | 0 | 21 | 0 |
| B | 0 | 20 | 0 |
| C | 0 | 20 | 0 |
| D | 0 | 21 | 1 |
| Mode SS | |||
|---|---|---|---|
| Quadrant | BADHDUFLAG | Total packets | Discarded packets |
| A | 0 | 134 | 4 |
| B | 0 | 134 | 2 |
| C | 0 | 134 | 4 |
| D | 0 | 134 | 4 |
| Mode M0 | |||
|---|---|---|---|
| Quadrant | BADHDUFLAG | Total packets | Discarded packets |
| A | 0 | 14152 | 255 |
| B | 0 | 13777 | 268 |
| C | 0 | 13455 | 228 |
| D | 0 | 15043 | 253 |
| Quadrant | Total seconds | Saturated seconds | Saturation percentage |
|---|---|---|---|
| A | 6413 | 97 | 1.512553% |
| B | 6414 | 113 | 1.761771% |
| C | 6418 | 81 | 1.262075% |
| D | 6419 | 126 | 1.962923% |
Noise dominated data is calculated using 1-second bins in cleaned event files. If a bin has >2000 counts, and if more than 50% of those come from <1% of pixels, then it is considered to be noise-dominated and hence unusable.
| Quadrant | # 1 sec bins | Bins with >0 counts | Bins with >2000 counts | High rate bins dominated by noise | Noise dominated (total time) | Noise dominated (detector-on time) | Marked lightcurve |
|---|---|---|---|---|---|---|---|
| A | 9007 | 6430 | 6 | 6 | 0.07% | 0.09% |  |
| B | 9007 | 6429 | 18 | 18 | 0.20% | 0.28% |  |
| C | 9007 | 6435 | 0 | 0 | 0.00% | 0.00% | 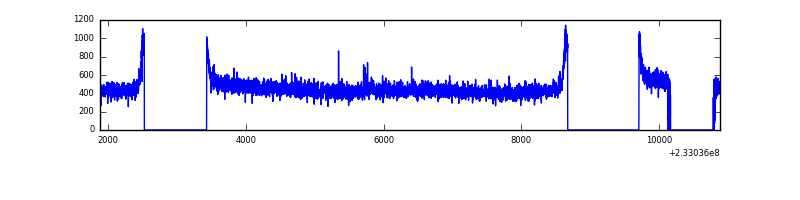 |
| D | 9007 | 6435 | 35 | 35 | 0.39% | 0.54% |  |
Top three noisy pixels from each quadrant. If the there are fewer than three noisy pixels in the level2.evt file, extra rows are filled as -1
| Pixel properties | Quadrant properties | ||||||
|---|---|---|---|---|---|---|---|
| Quadrant | DetID | PixID | Counts | Sigma | Mean | Median | Sigma |
| A | 8 | 5 | 353231 | 2213.41 | 775 | 757 | 159.2 |
| A | 5 | 16 | 32492 | 199.28 | 775 | 757 | 159.2 |
| A | 0 | 226 | 7213 | 40.54 | 775 | 757 | 159.2 |
| B | 10 | 16 | 81001 | 541.08 | 774 | 756 | 148.3 |
| B | 6 | 51 | 25627 | 167.7 | 774 | 756 | 148.3 |
| B | 12 | 111 | 15815 | 101.54 | 774 | 756 | 148.3 |
| C | 13 | 61 | 5640 | 27.93 | 750 | 753 | 175.0 |
| C | 12 | 4 | 2746 | 11.39 | 750 | 753 | 175.0 |
| C | 14 | 234 | 2651 | 10.85 | 750 | 753 | 175.0 |
| D | 8 | 195 | 390745 | 2052.44 | 745 | 726 | 190.0 |
| D | 7 | 71 | 113048 | 591.08 | 745 | 726 | 190.0 |
| D | 12 | 233 | 94543 | 493.7 | 745 | 726 | 190.0 |
Histogram calculated using DETX and DETY for each event in the final _common_clean file
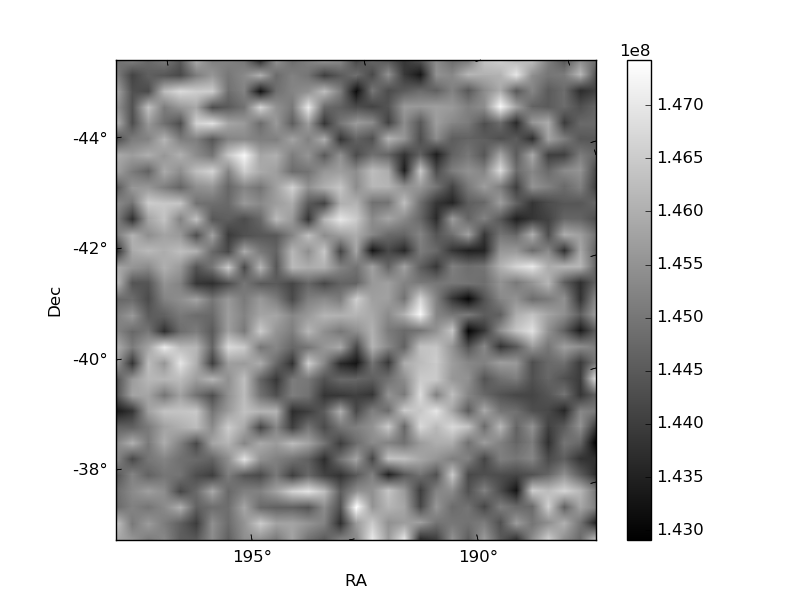
| Quadrant A | 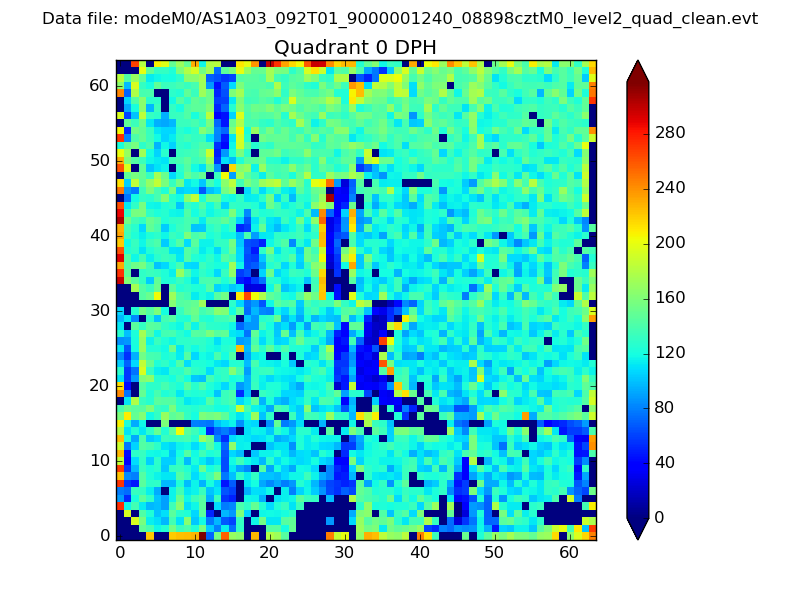 |
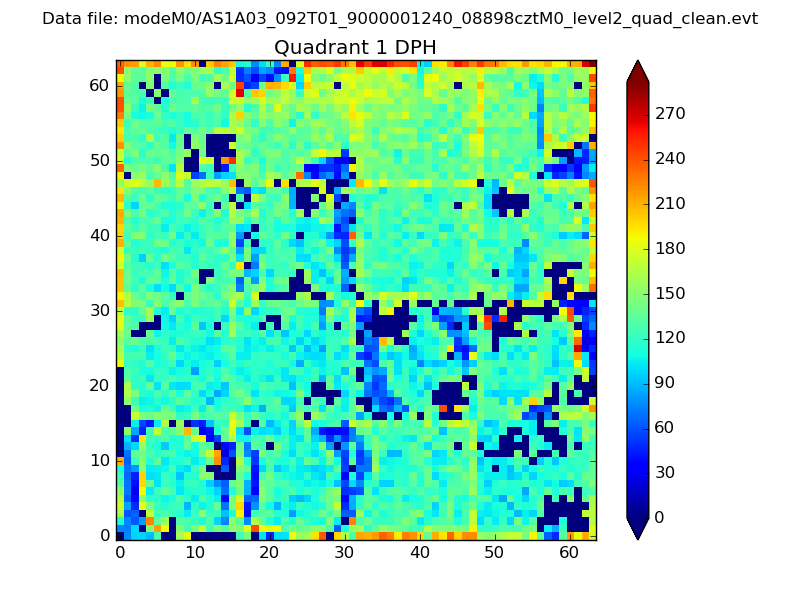 |
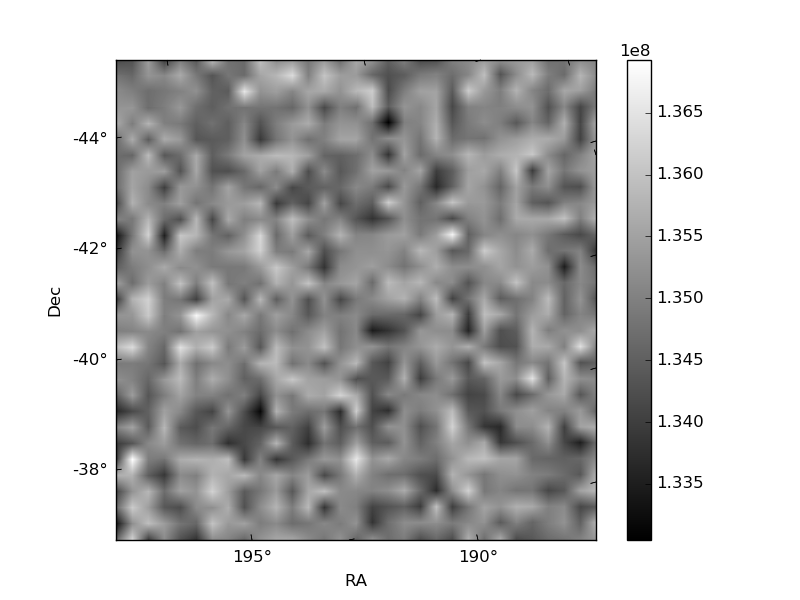
Quadrant B |
|---|---|---|---|
| Quadrant D | 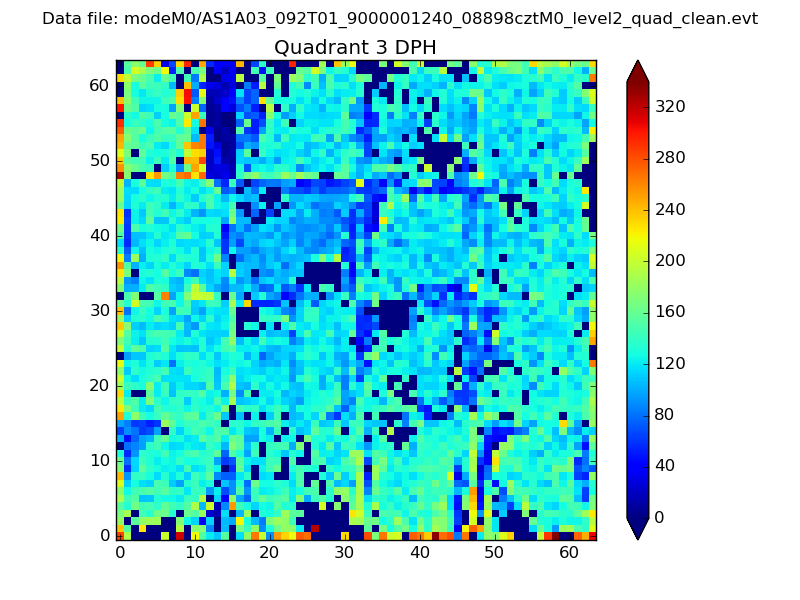 |
 |
Quadrant C |
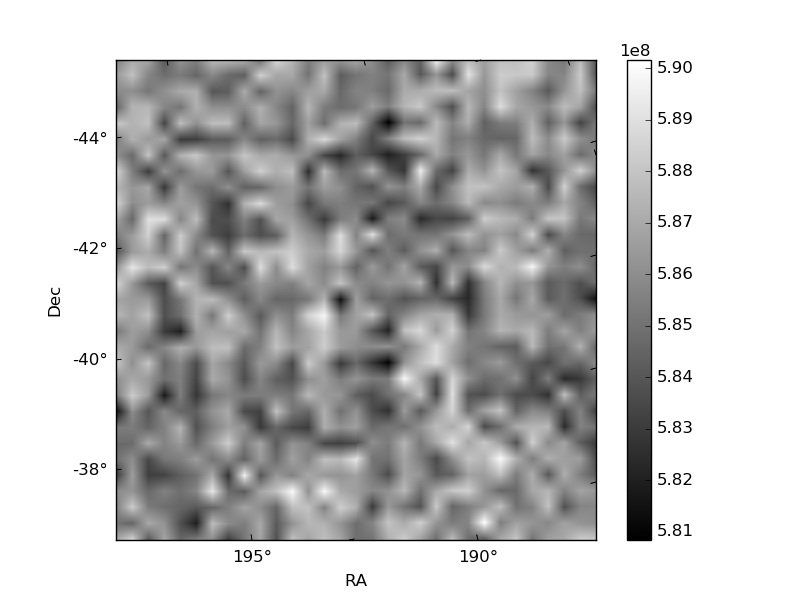
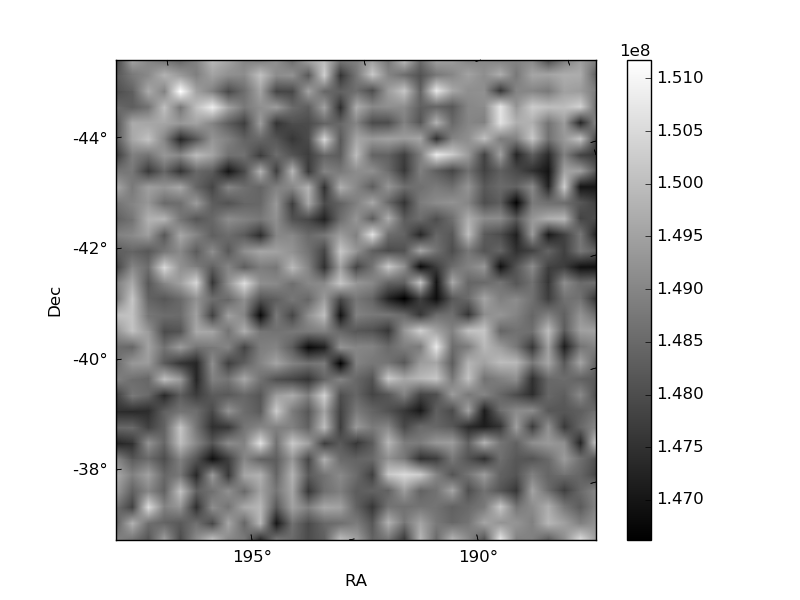
| Plot type | Count rate plots | Images |
|---|---|---|
| Comparison with Poisson distribution Blue bars denote a histogram of data divided into 1 sec bins. Red curve is a Poisson curve with rate = median count rate of data. |
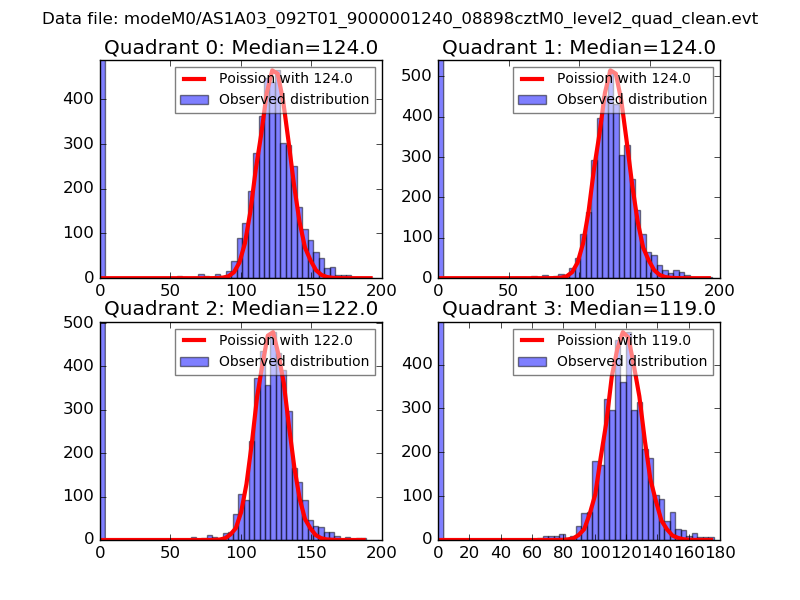 |
 |
| Quadrant-wise count rates Data is divided into 100 sec bins |
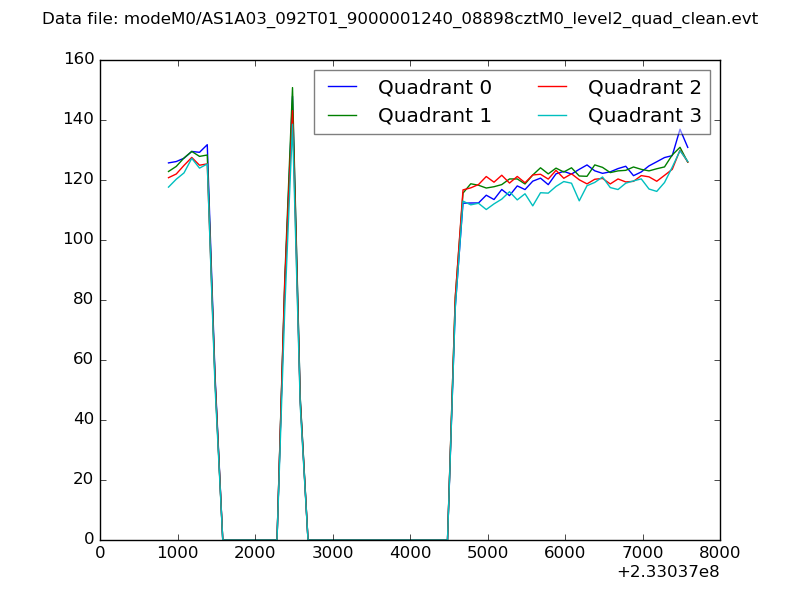 |
|
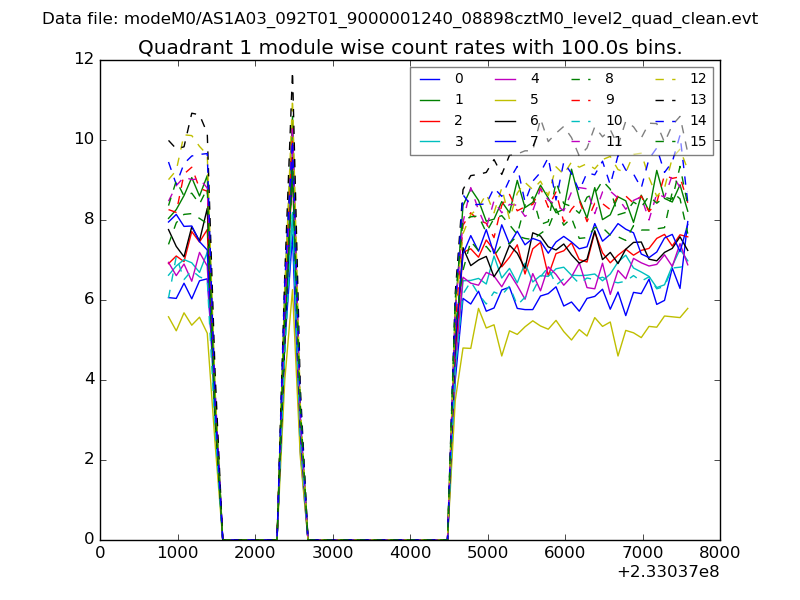
| Module-wise count rates for Quadrant A Data is divided into 100 sec bins |
 |
 |
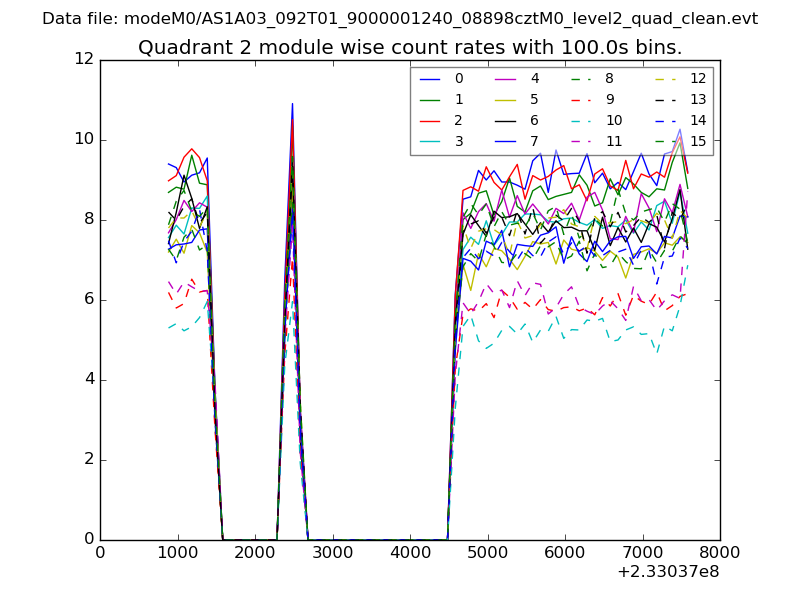
| Module-wise count rates for Quadrant B Data is divided into 100 sec bins |
 |
 |
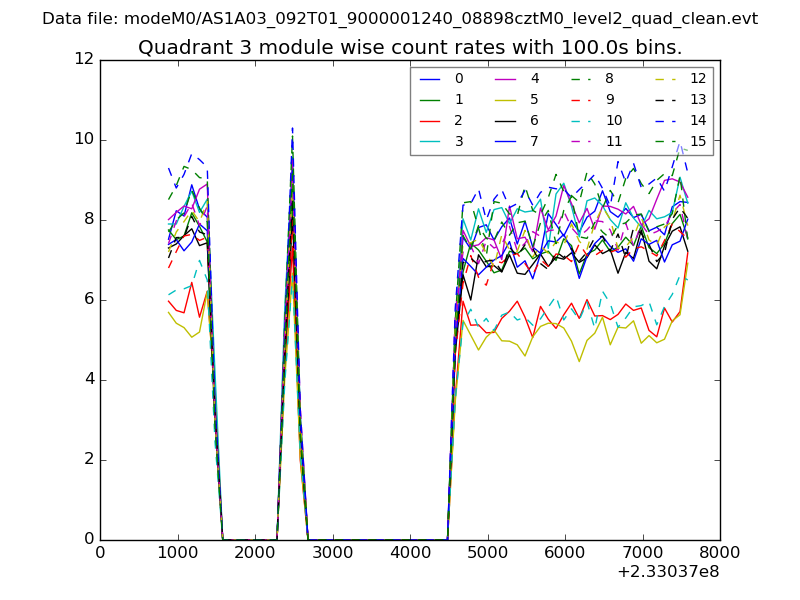
| Module-wise count rates for Quadrant C Data is divided into 100 sec bins |
 |
 |
| Module-wise count rates for Quadrant D Data is divided into 100 sec bins |
 |
 |
| Parameter | Plot |
|---|---|
| CZT HV Monitor | 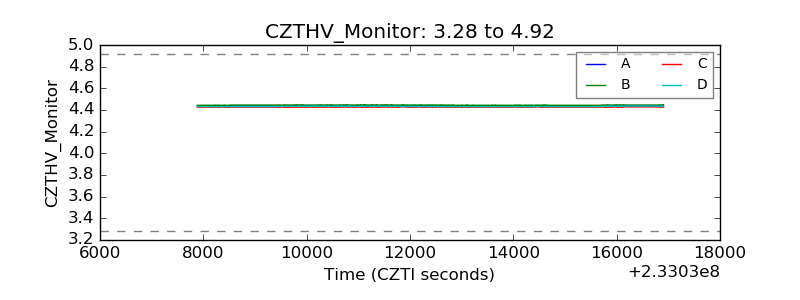 |
| D_VDD |  |
| Temperature 1 | 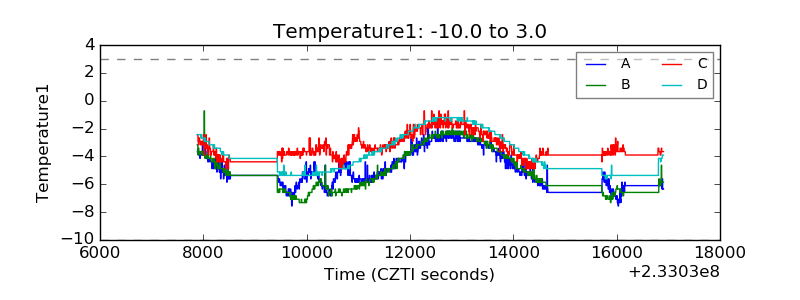 |
| Veto HV Monitor | 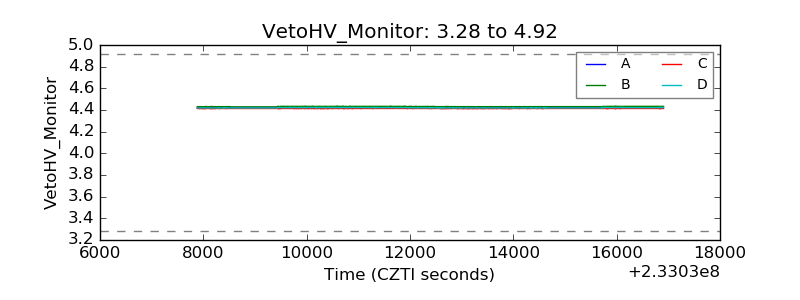 |
| Veto LLD | 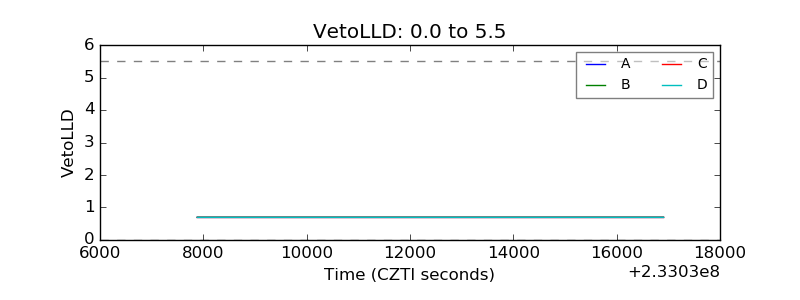 |
| Alpha Counter | 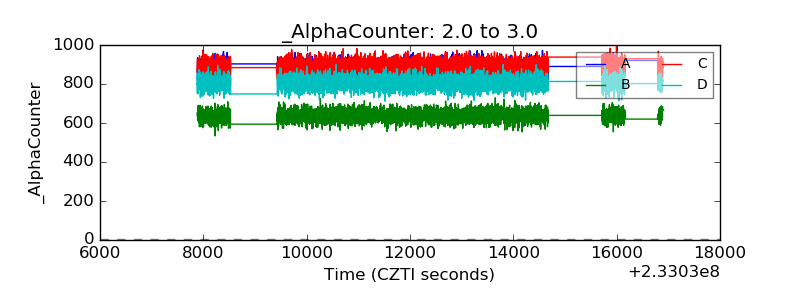 |
| _CPM_Rate | 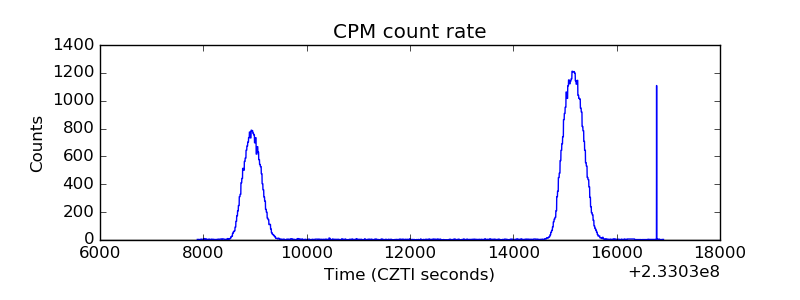 |
| CZT Counter |  |
| +2.5 Volts monitor |  |
| +5 Volts monitor |  |
| _ROLL_ROT | 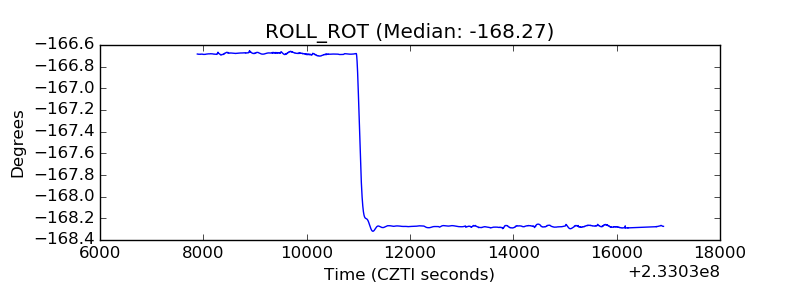 |
| _Roll_DEC | 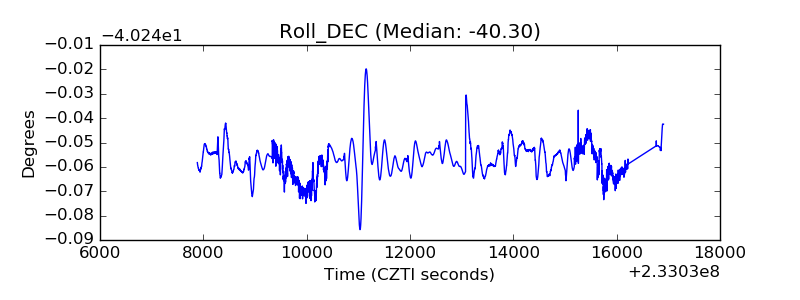 |
| _Roll_RA | 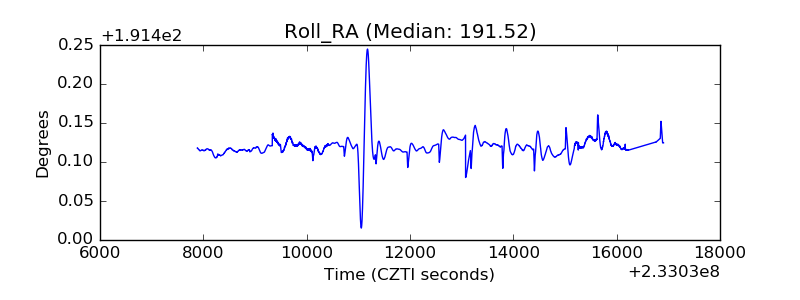 |
| Veto Counter | 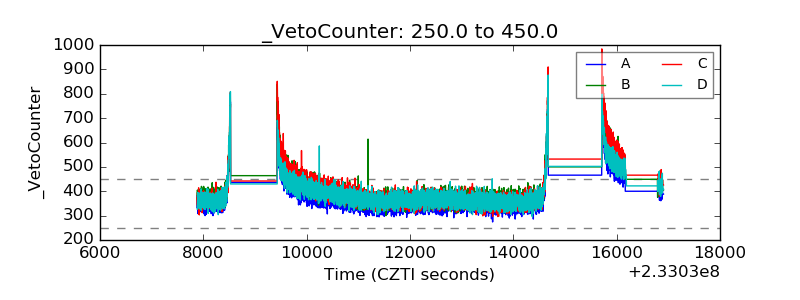 |