| Param | Original file | Final file |
|---|---|---|
| Filename | modeM0/AS1A03_092T01_9000001240_08899cztM0_level2.evt | modeM0/AS1A03_092T01_9000001240_08899cztM0_level2_quad_clean.evt |
| Size (bytes) | 795,726,720 | 129,611,520 |
| Size | 758.9 MB | 123.6 MB |
| Events in quadrant A | 5,995,474 | 789,768 |
| Events in quadrant B | 5,572,405 | 796,542 |
| Events in quadrant C | 5,231,099 | 786,584 |
| Events in quadrant D | 6,527,997 | 763,744 |
| Mode M9 | |||
|---|---|---|---|
| Quadrant | BADHDUFLAG | Total packets | Discarded packets |
| A | 0 | 22 | 0 |
| B | 0 | 22 | 0 |
| C | 0 | 22 | 0 |
| D | 0 | 22 | 0 |
| Mode SS | |||
|---|---|---|---|
| Quadrant | BADHDUFLAG | Total packets | Discarded packets |
| A | 0 | 232 | 0 |
| B | 0 | 232 | 0 |
| C | 0 | 232 | 0 |
| D | 0 | 232 | 0 |
| Mode M0 | |||
|---|---|---|---|
| Quadrant | BADHDUFLAG | Total packets | Discarded packets |
| A | 0 | 24729 | 3 |
| B | 0 | 23927 | 2 |
| C | 0 | 23401 | 2 |
| D | 0 | 26308 | 2 |
| Quadrant | Total seconds | Saturated seconds | Saturation percentage |
|---|---|---|---|
| A | 11396 | 129 | 1.131976% |
| B | 11396 | 154 | 1.351351% |
| C | 11396 | 94 | 0.824851% |
| D | 11396 | 168 | 1.474201% |
Noise dominated data is calculated using 1-second bins in cleaned event files. If a bin has >2000 counts, and if more than 50% of those come from <1% of pixels, then it is considered to be noise-dominated and hence unusable.
| Quadrant | # 1 sec bins | Bins with >0 counts | Bins with >2000 counts | High rate bins dominated by noise | Noise dominated (total time) | Noise dominated (detector-on time) | Marked lightcurve |
|---|---|---|---|---|---|---|---|
| A | 13586 | 11396 | 13 | 13 | 0.10% | 0.11% | 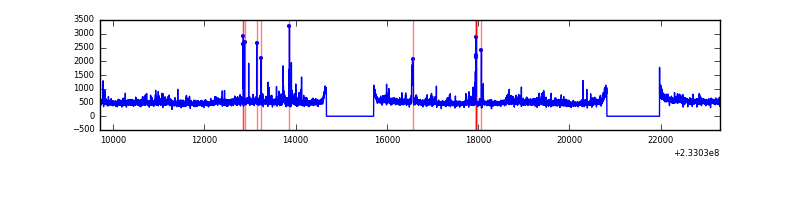 |
| B | 13586 | 11396 | 30 | 30 | 0.22% | 0.26% | 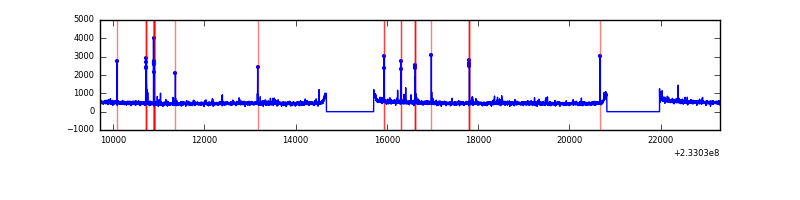 |
| C | 13586 | 11396 | 0 | 0 | 0.00% | 0.00% | 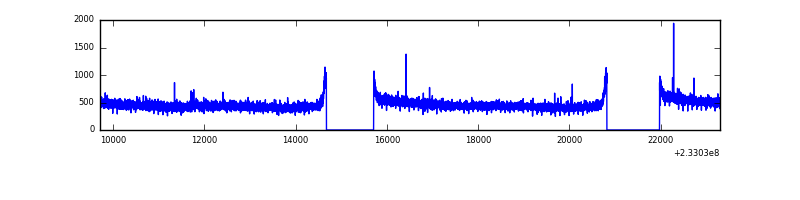 |
| D | 13586 | 11396 | 56 | 56 | 0.41% | 0.49% | 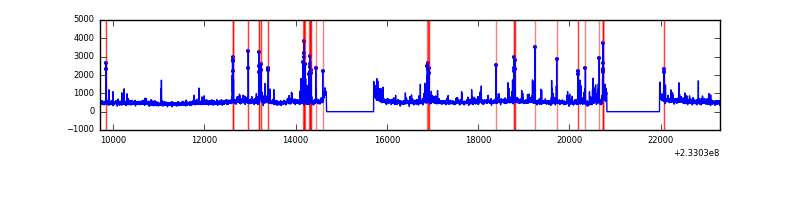 |
Top three noisy pixels from each quadrant. If the there are fewer than three noisy pixels in the level2.evt file, extra rows are filled as -1
| Pixel properties | Quadrant properties | ||||||
|---|---|---|---|---|---|---|---|
| Quadrant | DetID | PixID | Counts | Sigma | Mean | Median | Sigma |
| A | 8 | 5 | 557659 | 1992.03 | 1379 | 1351 | 279.3 |
| A | 15 | 174 | 79549 | 280.01 | 1379 | 1351 | 279.3 |
| A | 5 | 16 | 43870 | 152.25 | 1379 | 1351 | 279.3 |
| B | 10 | 16 | 135433 | 518.7 | 1378 | 1347 | 258.5 |
| B | 6 | 51 | 49554 | 186.48 | 1378 | 1347 | 258.5 |
| B | 4 | 173 | 29683 | 109.61 | 1378 | 1347 | 258.5 |
| C | 13 | 61 | 10061 | 28.45 | 1338 | 1343 | 306.4 |
| C | 1 | 3 | 6365 | 16.39 | 1338 | 1343 | 306.4 |
| C | 3 | 254 | 4731 | 11.06 | 1338 | 1343 | 306.4 |
| D | 8 | 195 | 717642 | 2192.52 | 1330 | 1299 | 326.7 |
| D | 1 | 52 | 216668 | 659.18 | 1330 | 1299 | 326.7 |
| D | 7 | 71 | 174981 | 531.59 | 1330 | 1299 | 326.7 |
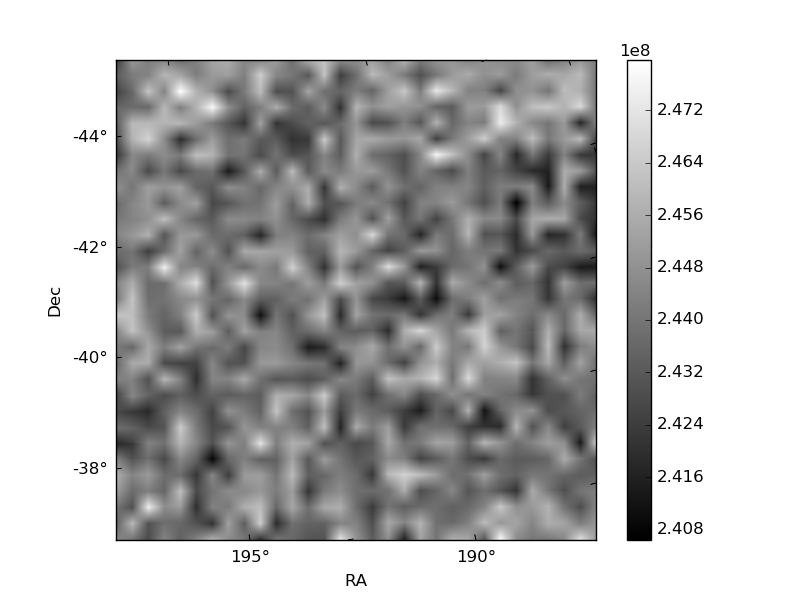
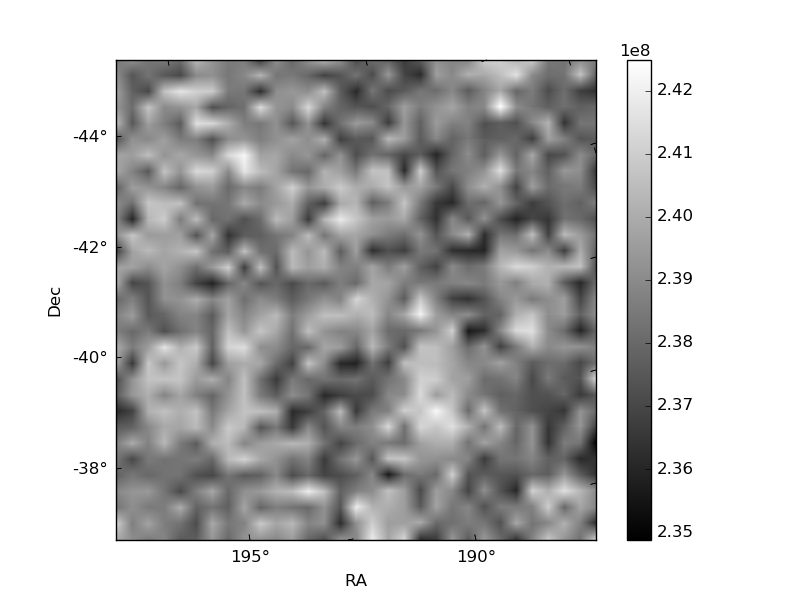
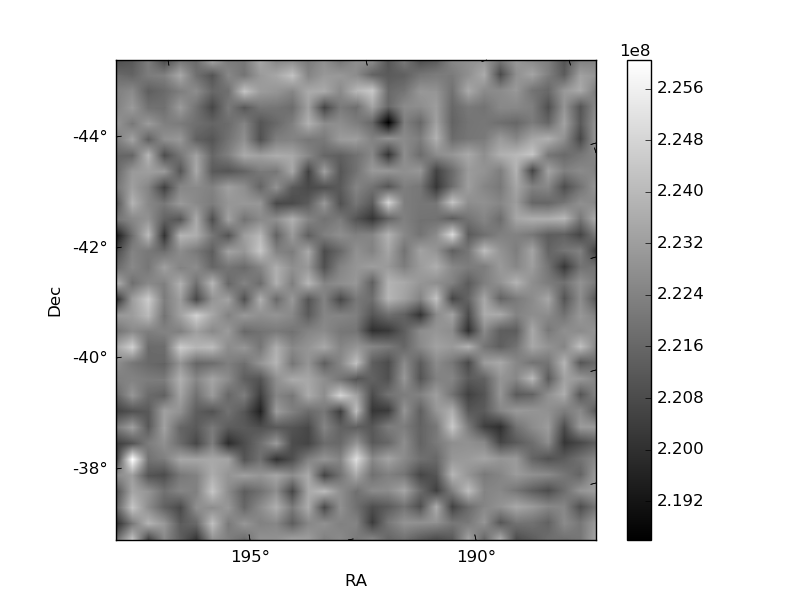
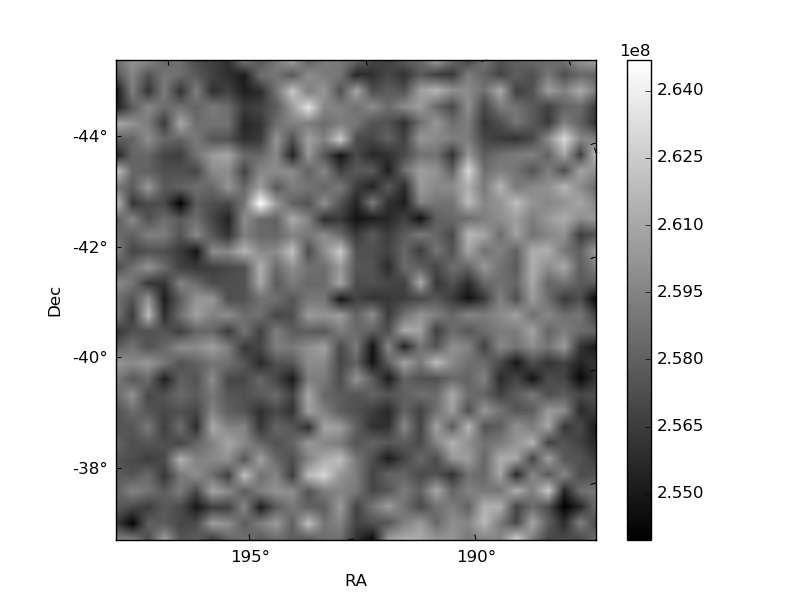
Histogram calculated using DETX and DETY for each event in the final _common_clean file
| Quadrant A | 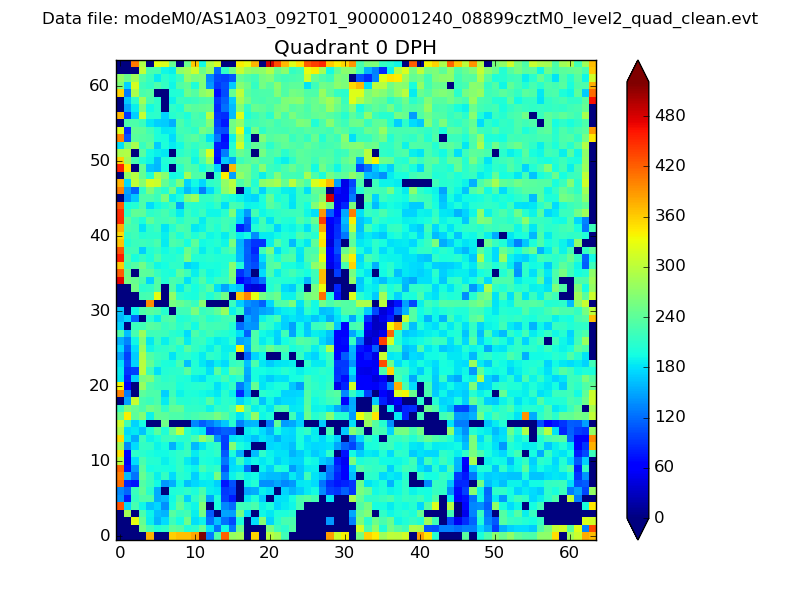 |
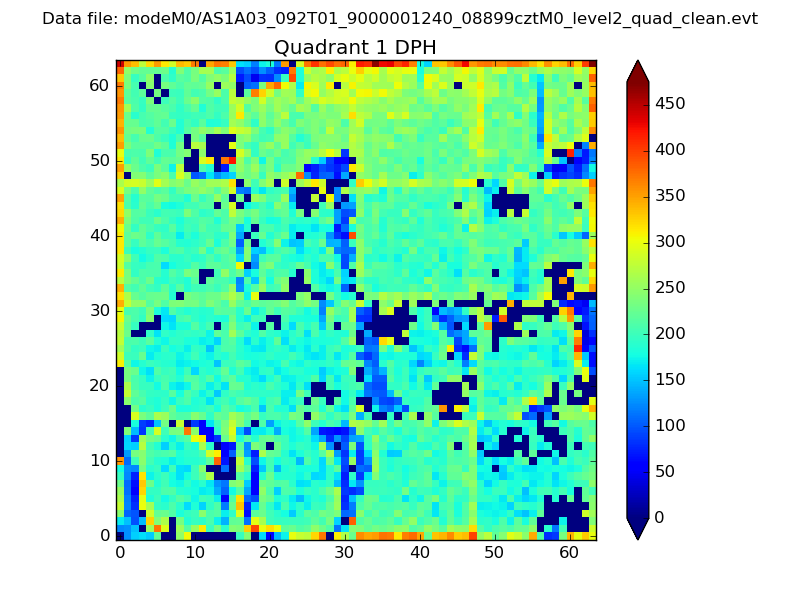 |
Quadrant B |
|---|---|---|---|
| Quadrant D | 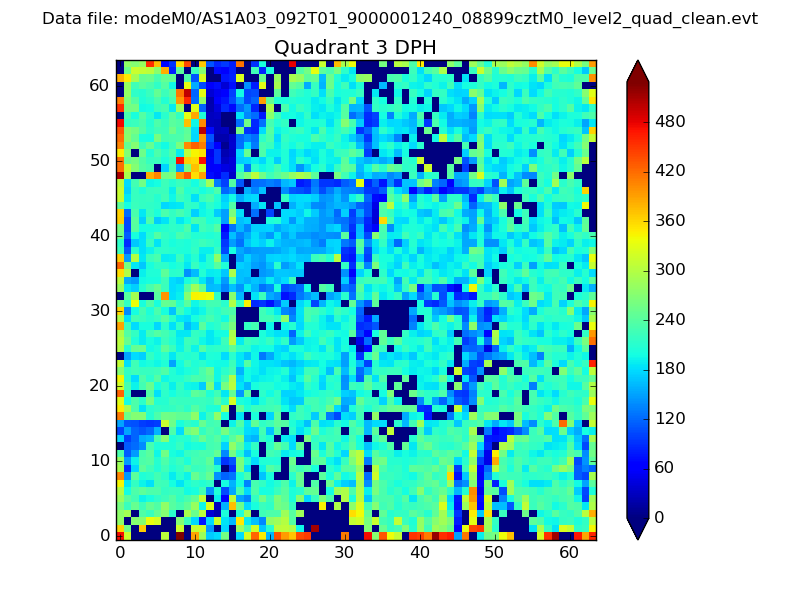 |
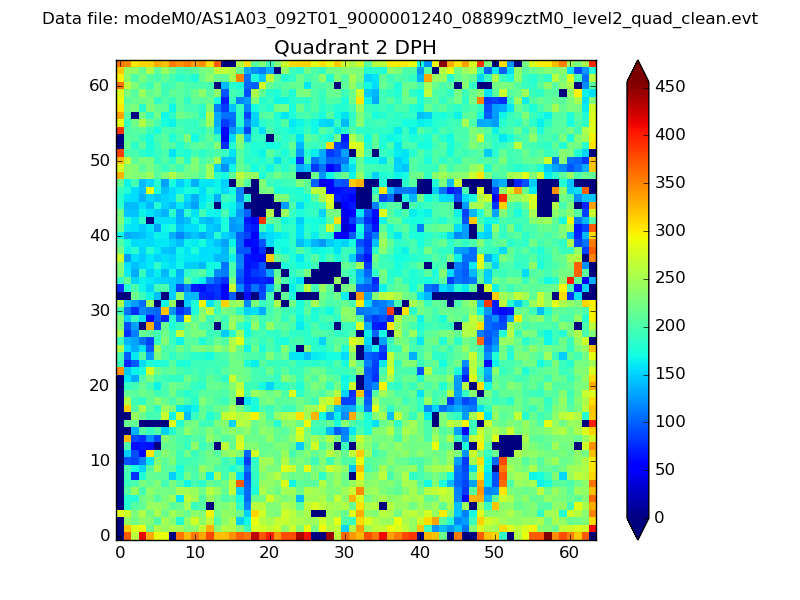 |
Quadrant C |
| Plot type | Count rate plots | Images |
|---|---|---|
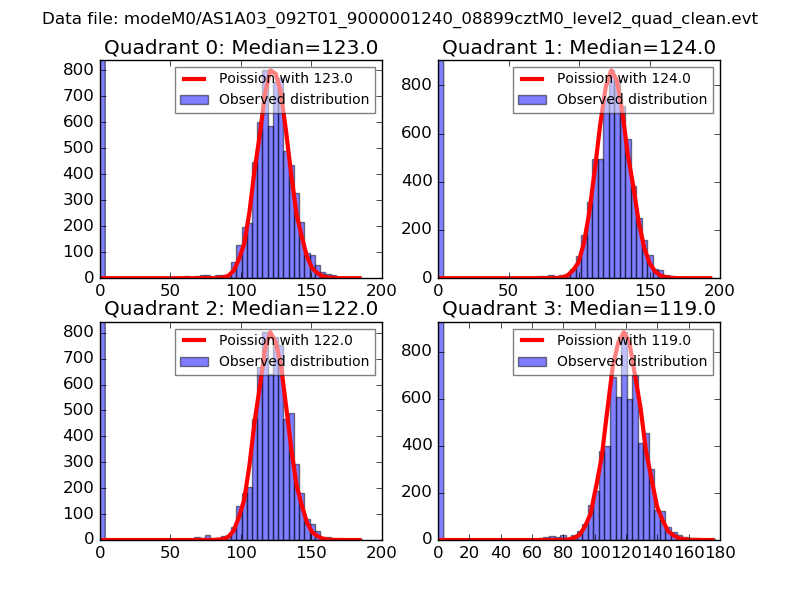
| Comparison with Poisson distribution Blue bars denote a histogram of data divided into 1 sec bins. Red curve is a Poisson curve with rate = median count rate of data. |
 |
 |
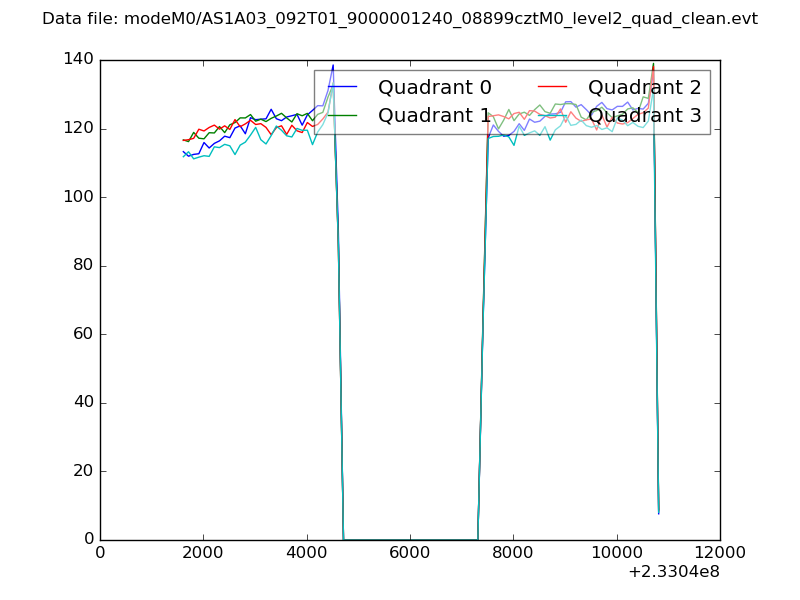
| Quadrant-wise count rates Data is divided into 100 sec bins |
 |
|
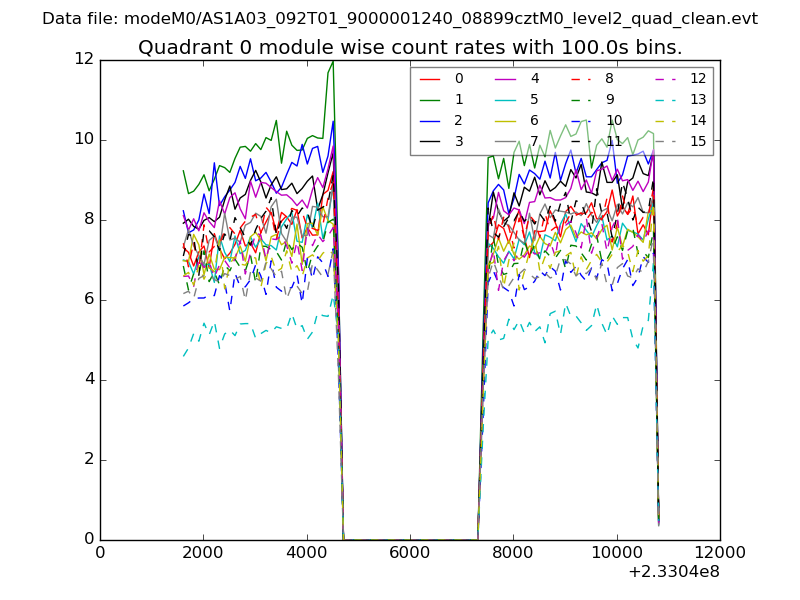
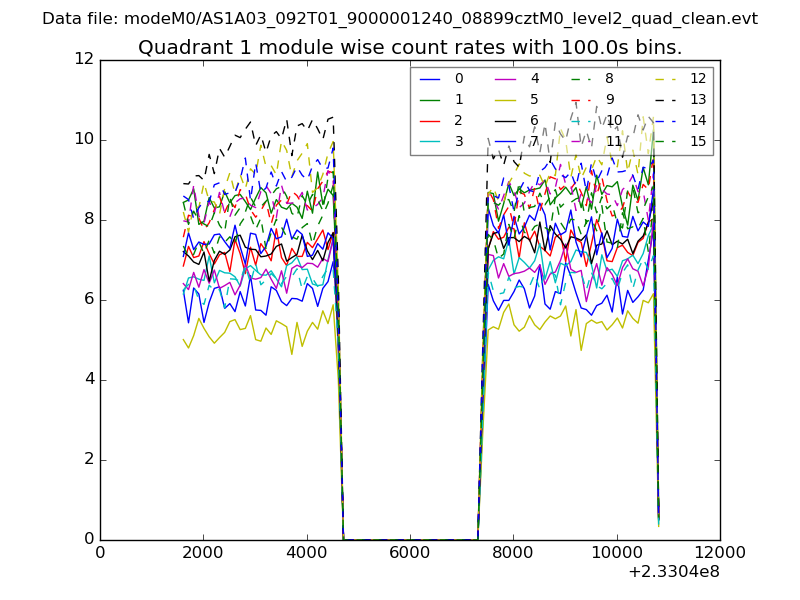
| Module-wise count rates for Quadrant A Data is divided into 100 sec bins |
 |
 |
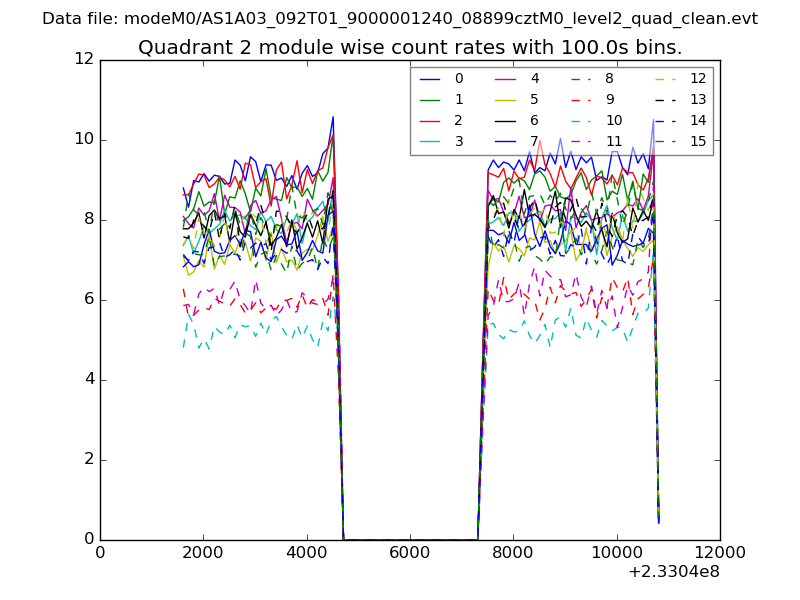
| Module-wise count rates for Quadrant B Data is divided into 100 sec bins |
 |
 |
| Module-wise count rates for Quadrant C Data is divided into 100 sec bins |
 |
 |
| Module-wise count rates for Quadrant D Data is divided into 100 sec bins |
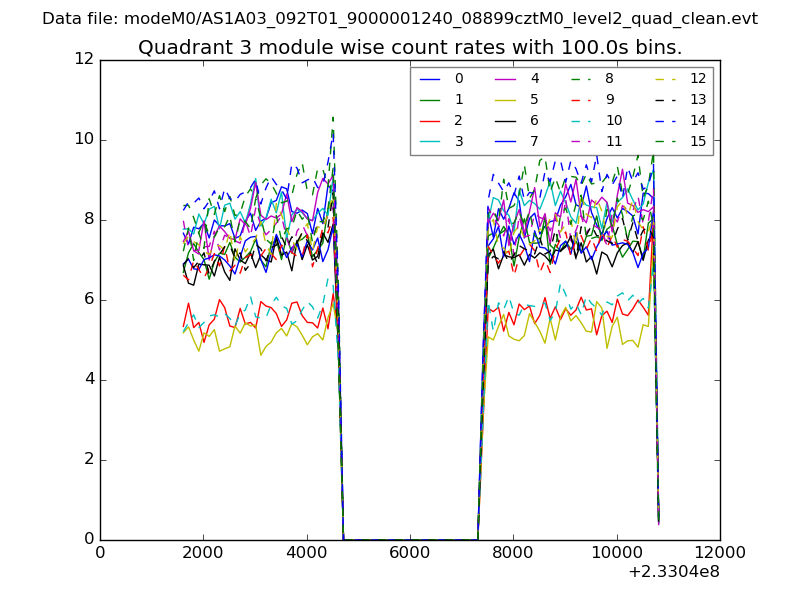 |
 |
| Parameter | Plot |
|---|---|
| CZT HV Monitor | 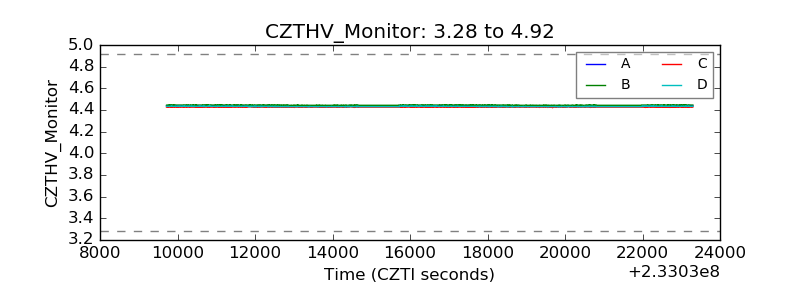 |
| D_VDD | 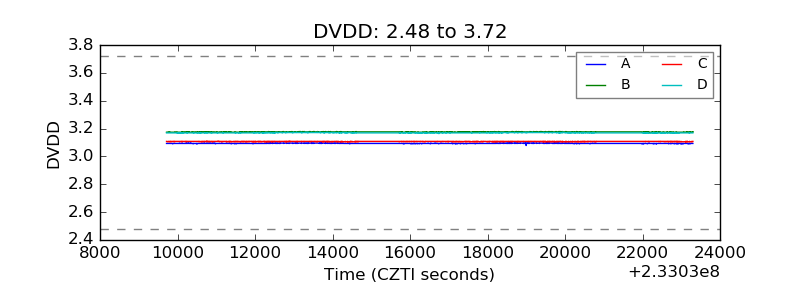 |
| Temperature 1 | 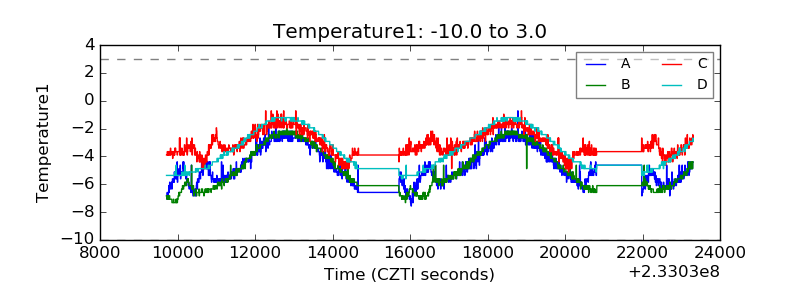 |
| Veto HV Monitor | 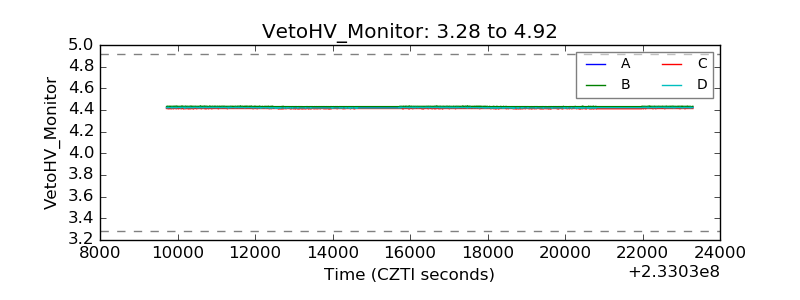 |
| Veto LLD | 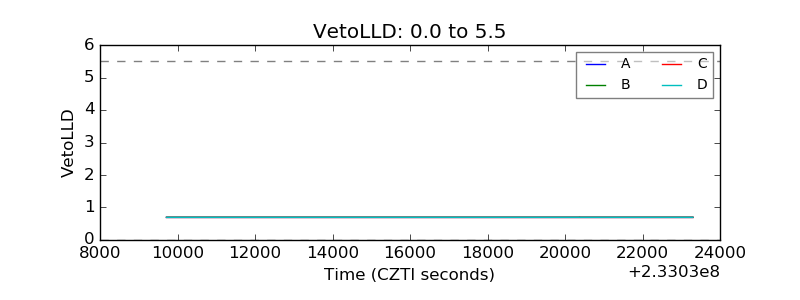 |
| Alpha Counter | 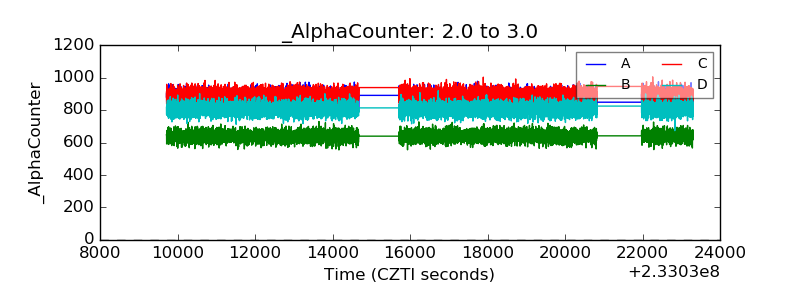 |
| _CPM_Rate |  |
| CZT Counter | 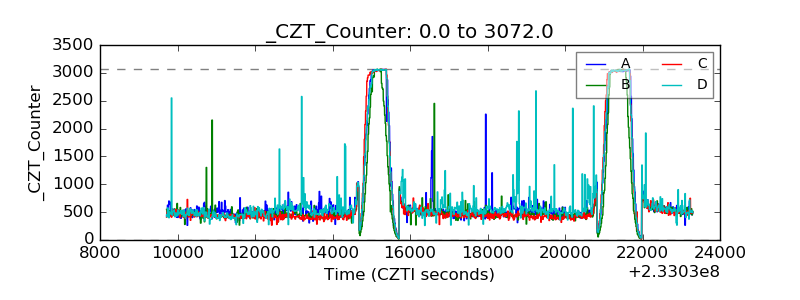 |
| +2.5 Volts monitor |  |
| +5 Volts monitor | 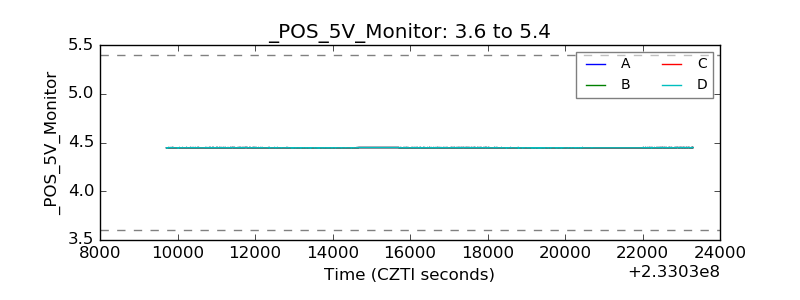 |
| _ROLL_ROT | 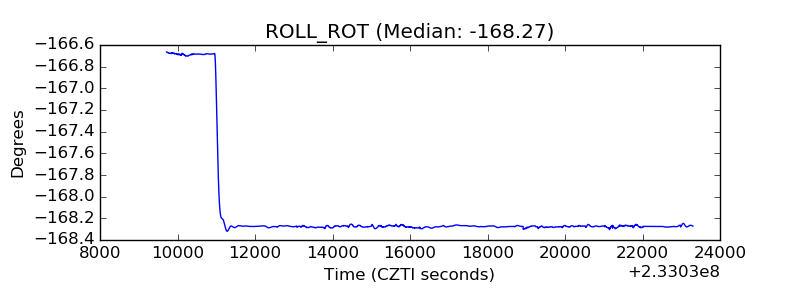 |
| _Roll_DEC | 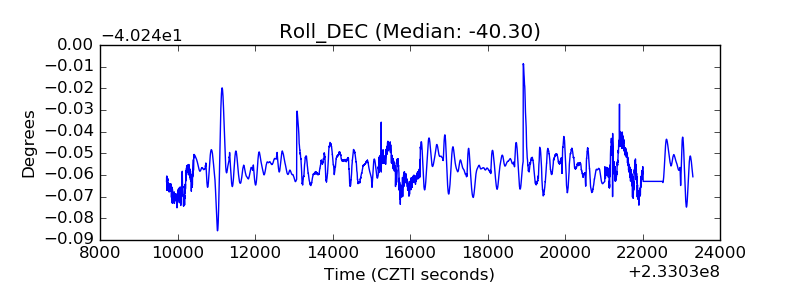 |
| _Roll_RA | 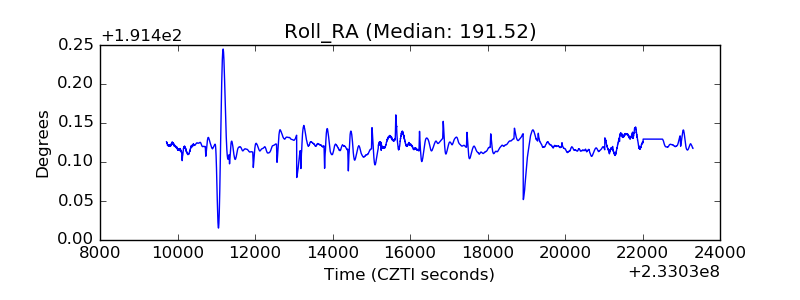 |
| Veto Counter | 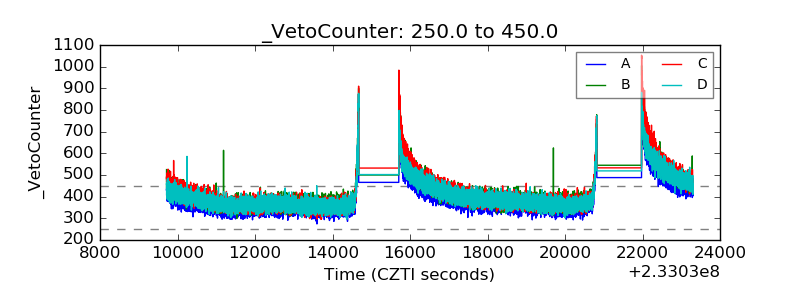 |