| Param | Original file | Final file |
|---|---|---|
| Filename | modeM0/AS1A03_092T01_9000001240_08901cztM0_level2.evt | modeM0/AS1A03_092T01_9000001240_08901cztM0_level2_quad_clean.evt |
| Size (bytes) | 528,834,240 | 96,157,440 |
| Size | 504.3 MB | 91.7 MB |
| Events in quadrant A | 4,286,640 | 624,864 |
| Events in quadrant B | 3,448,070 | 634,322 |
| Events in quadrant C | 3,099,616 | 620,067 |
| Events in quadrant D | 4,759,550 | 598,279 |
| Mode M9 | |||
|---|---|---|---|
| Quadrant | BADHDUFLAG | Total packets | Discarded packets |
| A | 0 | 18 | 0 |
| B | 0 | 18 | 0 |
| C | 0 | 18 | 0 |
| D | 0 | 19 | 0 |
| Mode SS | |||
|---|---|---|---|
| Quadrant | BADHDUFLAG | Total packets | Discarded packets |
| A | 0 | 126 | 0 |
| B | 0 | 126 | 0 |
| C | 0 | 126 | 0 |
| D | 0 | 126 | 0 |
| Mode M0 | |||
|---|---|---|---|
| Quadrant | BADHDUFLAG | Total packets | Discarded packets |
| A | 0 | 17028 | 3 |
| B | 0 | 13995 | 2 |
| C | 0 | 13228 | 2 |
| D | 0 | 18439 | 2 |
| Quadrant | Total seconds | Saturated seconds | Saturation percentage |
|---|---|---|---|
| A | 6229 | 146 | 2.343875% |
| B | 6229 | 140 | 2.247552% |
| C | 6229 | 95 | 1.525124% |
| D | 6229 | 165 | 2.648900% |
Noise dominated data is calculated using 1-second bins in cleaned event files. If a bin has >2000 counts, and if more than 50% of those come from <1% of pixels, then it is considered to be noise-dominated and hence unusable.
| Quadrant | # 1 sec bins | Bins with >0 counts | Bins with >2000 counts | High rate bins dominated by noise | Noise dominated (total time) | Noise dominated (detector-on time) | Marked lightcurve |
|---|---|---|---|---|---|---|---|
| A | 7534 | 6229 | 11 | 11 | 0.15% | 0.18% | 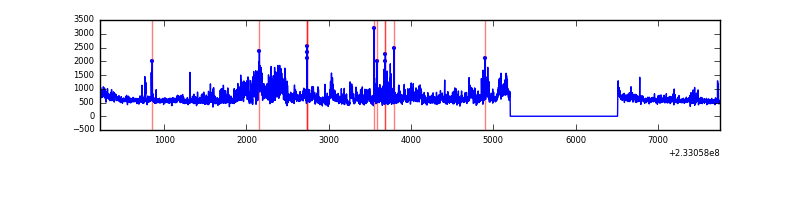 |
| B | 7534 | 6229 | 29 | 29 | 0.38% | 0.47% | 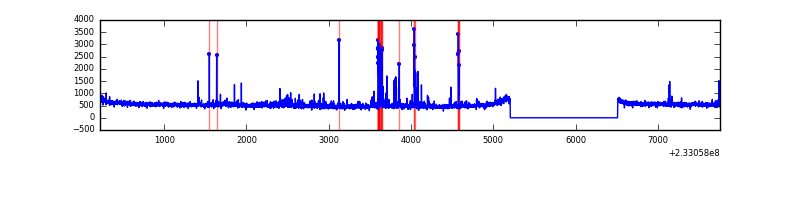 |
| C | 7534 | 6229 | 9 | 9 | 0.12% | 0.14% | 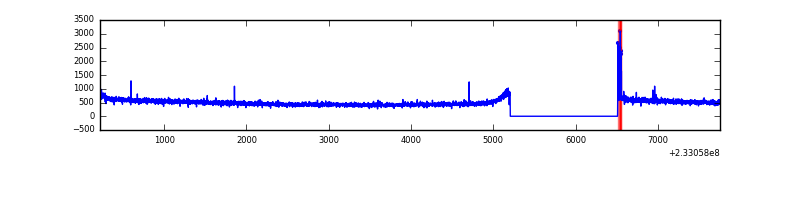 |
| D | 7534 | 6229 | 54 | 54 | 0.72% | 0.87% | 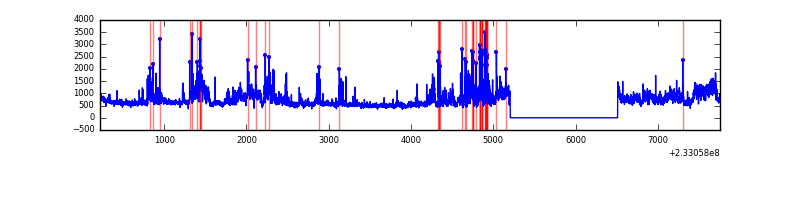 |
Top three noisy pixels from each quadrant. If the there are fewer than three noisy pixels in the level2.evt file, extra rows are filled as -1
| Pixel properties | Quadrant properties | ||||||
|---|---|---|---|---|---|---|---|
| Quadrant | DetID | PixID | Counts | Sigma | Mean | Median | Sigma |
| A | 8 | 5 | 1104031 | 6730.23 | 815 | 800 | 163.9 |
| A | 15 | 174 | 19600 | 114.69 | 815 | 800 | 163.9 |
| A | 5 | 16 | 16377 | 95.03 | 815 | 800 | 163.9 |
| B | 10 | 16 | 160386 | 1051.17 | 811 | 793 | 151.8 |
| B | 0 | 219 | 48583 | 314.77 | 811 | 793 | 151.8 |
| B | 0 | 214 | 37919 | 244.53 | 811 | 793 | 151.8 |
| C | 1 | 3 | 23334 | 126.17 | 782 | 786 | 178.7 |
| C | 12 | 4 | 11157 | 58.03 | 782 | 786 | 178.7 |
| C | 9 | 68 | 11145 | 57.96 | 782 | 786 | 178.7 |
| D | 1 | 52 | 1086373 | 5724.45 | 783 | 764 | 189.6 |
| D | 8 | 195 | 429599 | 2261.26 | 783 | 764 | 189.6 |
| D | 7 | 71 | 119341 | 625.26 | 783 | 764 | 189.6 |
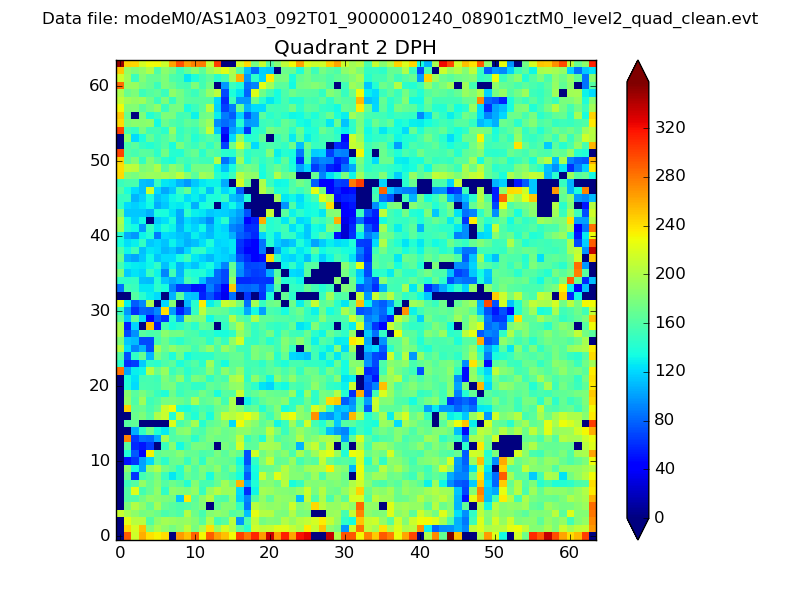
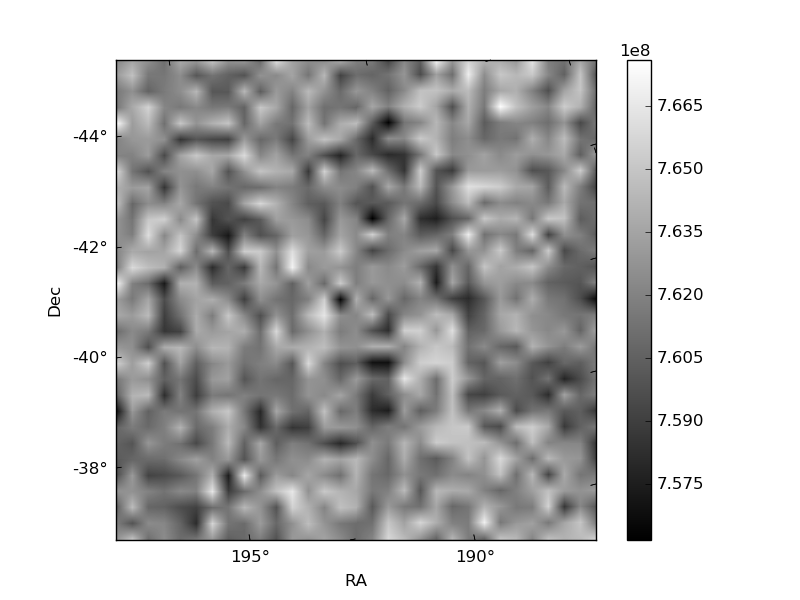
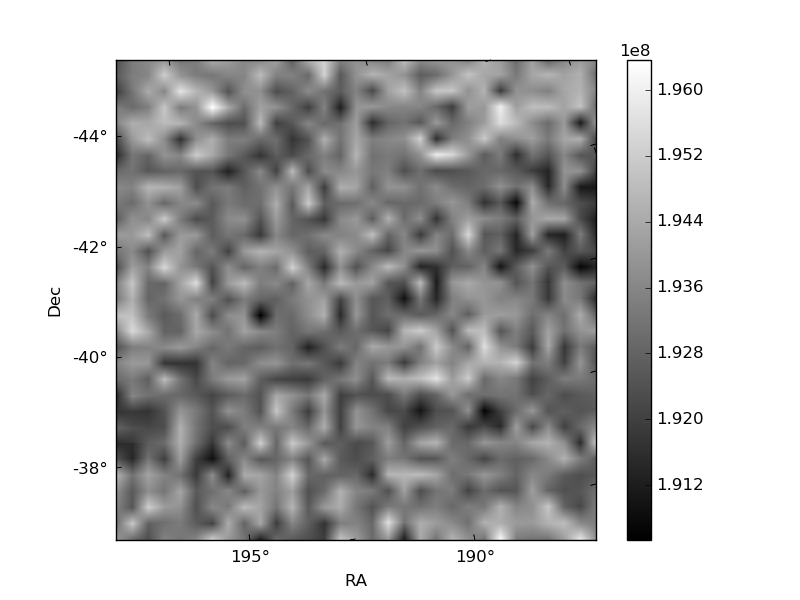
Histogram calculated using DETX and DETY for each event in the final _common_clean file
| Quadrant A | 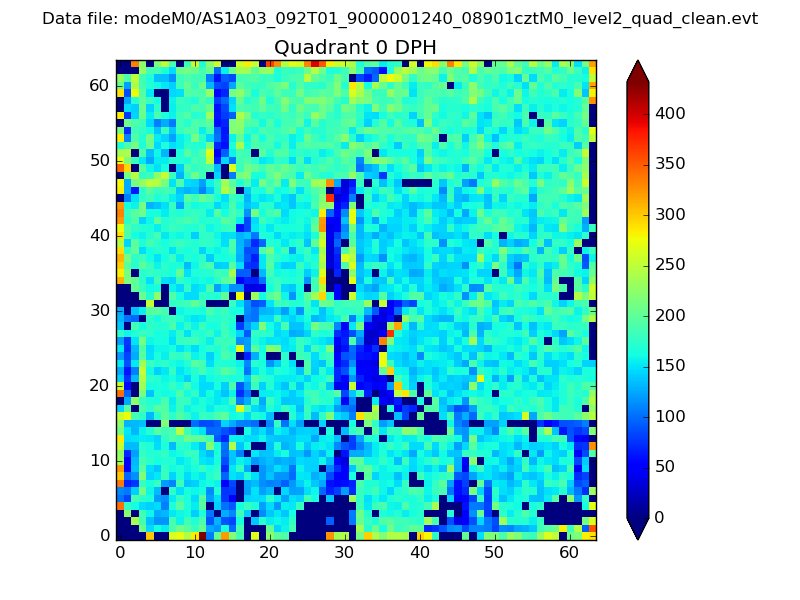 |
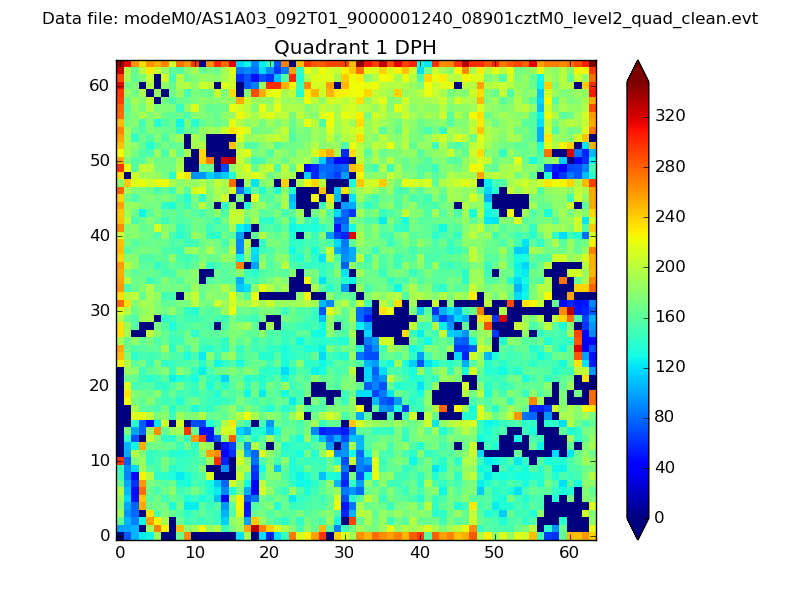 |
Quadrant B |
|---|---|---|---|
| Quadrant D | 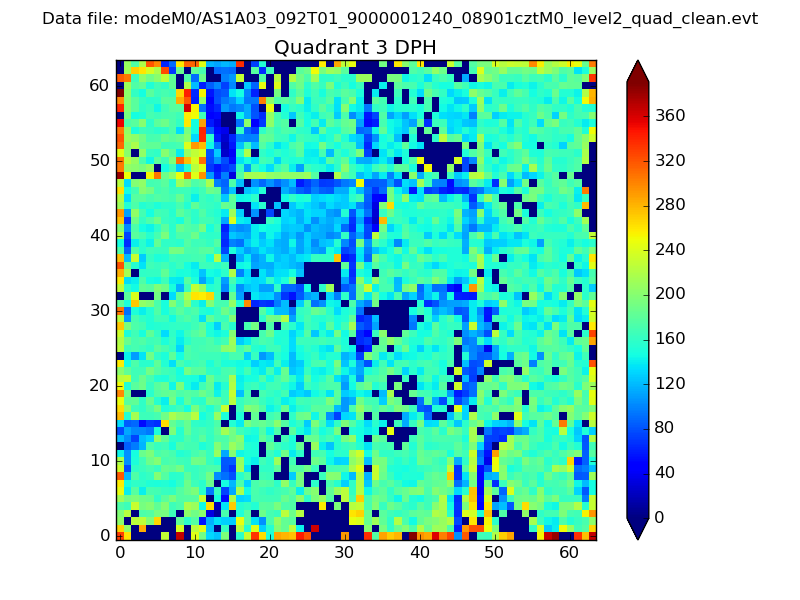 |
 |
Quadrant C |
| Plot type | Count rate plots | Images |
|---|---|---|
| Comparison with Poisson distribution Blue bars denote a histogram of data divided into 1 sec bins. Red curve is a Poisson curve with rate = median count rate of data. |
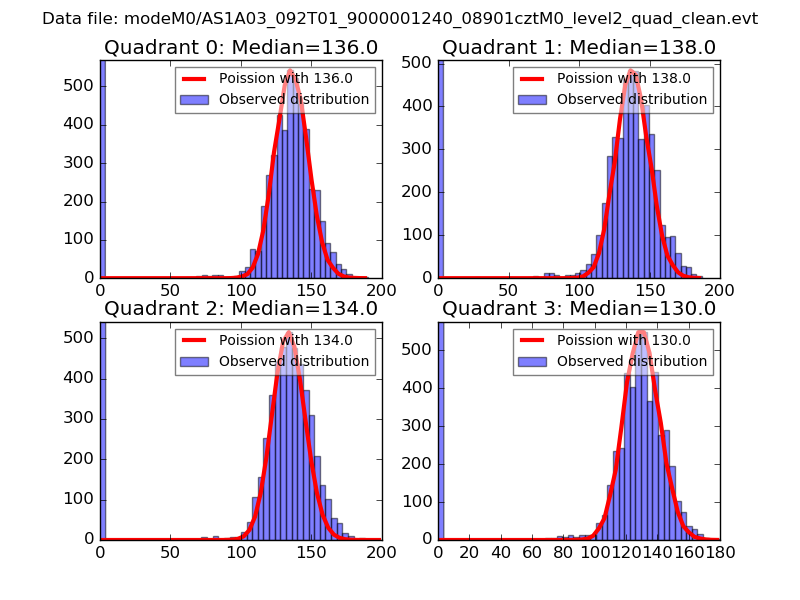 |
 |
| Quadrant-wise count rates Data is divided into 100 sec bins |
 |
|
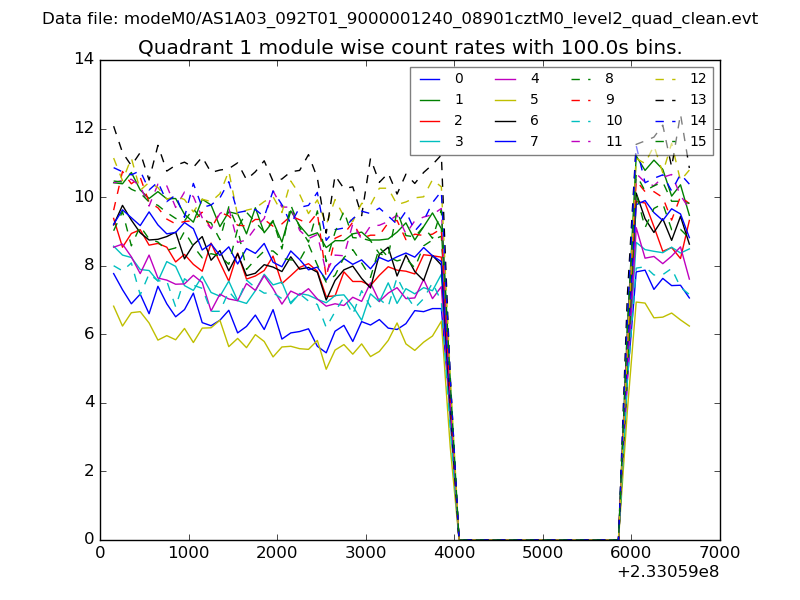
| Module-wise count rates for Quadrant A Data is divided into 100 sec bins |
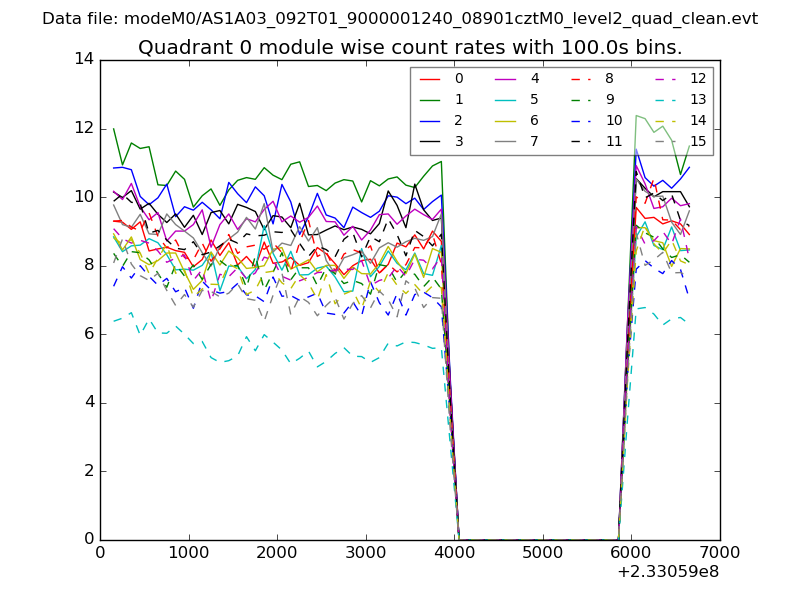 |
 |
| Module-wise count rates for Quadrant B Data is divided into 100 sec bins |
 |
 |
| Module-wise count rates for Quadrant C Data is divided into 100 sec bins |
 |
 |
| Module-wise count rates for Quadrant D Data is divided into 100 sec bins |
 |
 |
| Parameter | Plot |
|---|---|
| CZT HV Monitor | 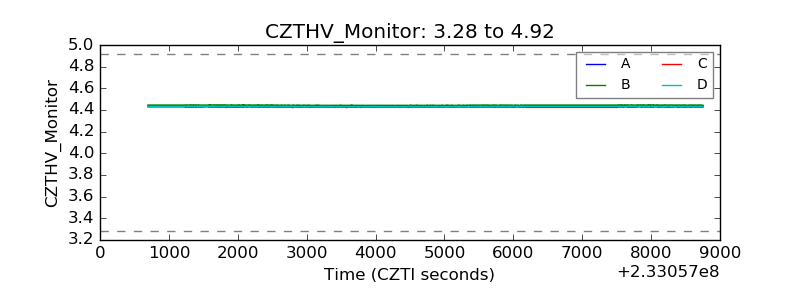 |
| D_VDD | 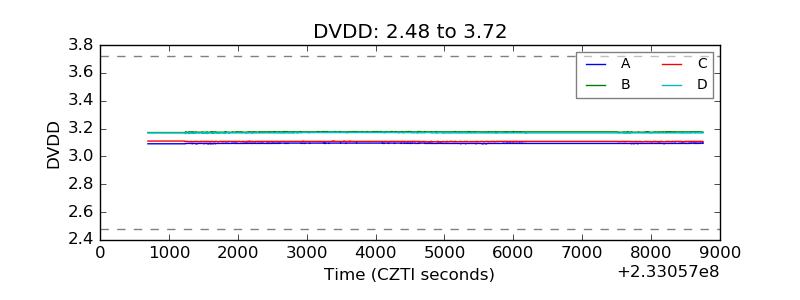 |
| Temperature 1 | 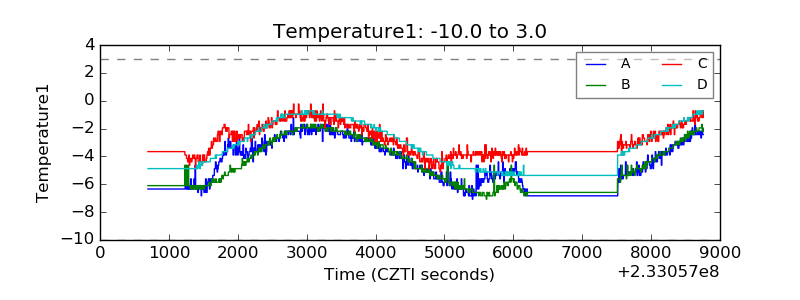 |
| Veto HV Monitor | 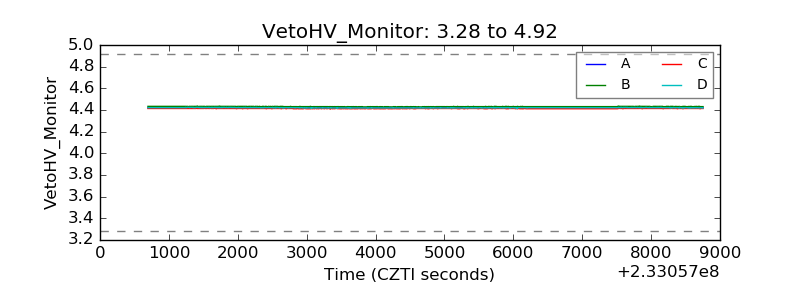 |
| Veto LLD | 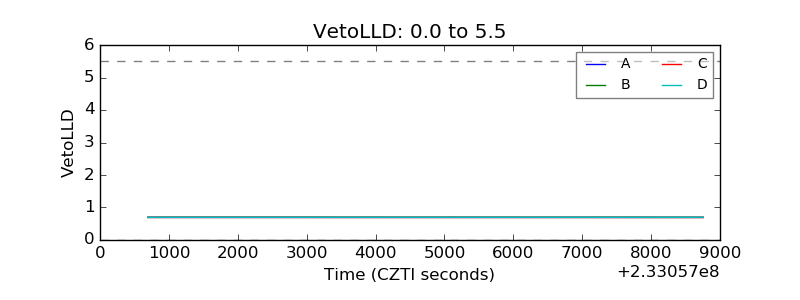 |
| Alpha Counter | 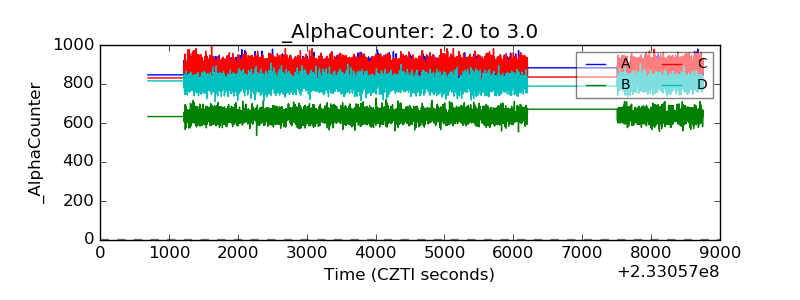 |
| _CPM_Rate | 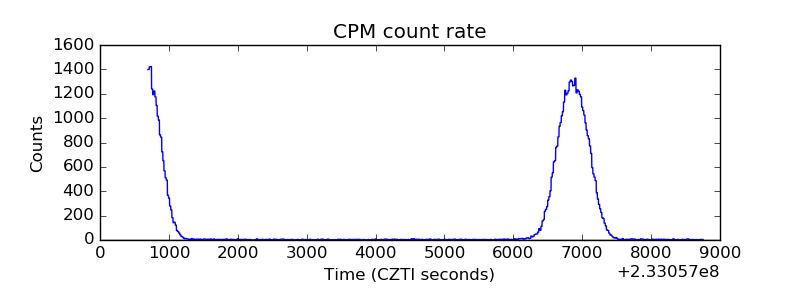 |
| CZT Counter | 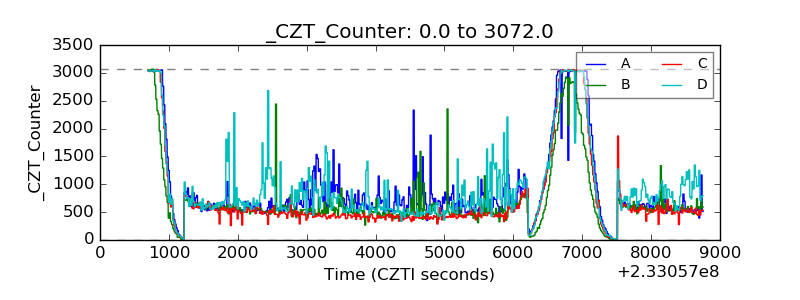 |
| +2.5 Volts monitor |  |
| +5 Volts monitor |  |
| _ROLL_ROT |  |
| _Roll_DEC | 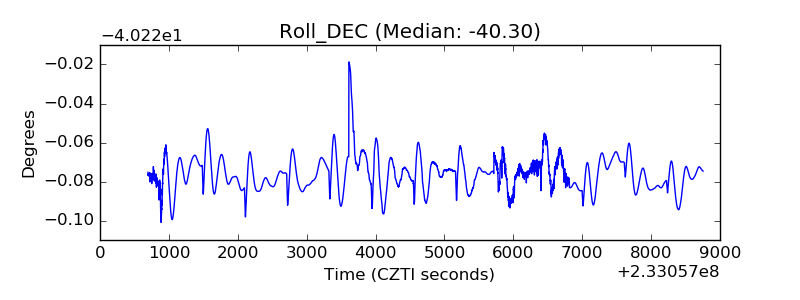 |
| _Roll_RA | 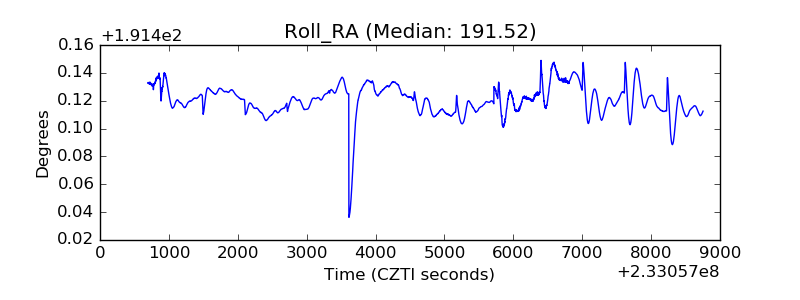 |
| Veto Counter | 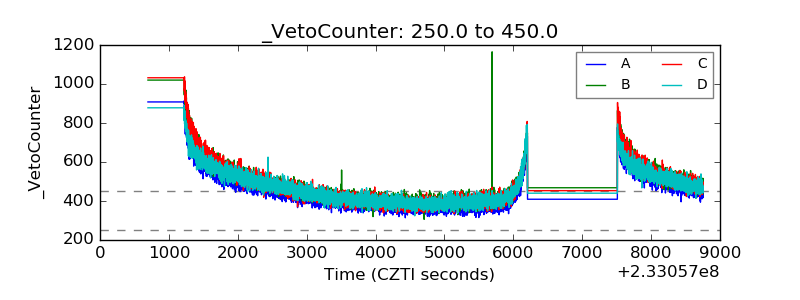 |