| Param | Original file | Final file |
|---|---|---|
| Filename | modeM0/AS1A03_092T01_9000001240_08904cztM0_level2.evt | modeM0/AS1A03_092T01_9000001240_08904cztM0_level2_quad_clean.evt |
| Size (bytes) | 517,501,440 | 99,201,600 |
| Size | 493.5 MB | 94.6 MB |
| Events in quadrant A | 4,540,676 | 629,898 |
| Events in quadrant B | 3,588,523 | 645,983 |
| Events in quadrant C | 3,090,991 | 629,005 |
| Events in quadrant D | 3,979,589 | 613,972 |
| Mode M9 | |||
|---|---|---|---|
| Quadrant | BADHDUFLAG | Total packets | Discarded packets |
| A | 0 | 9 | 0 |
| B | 0 | 9 | 0 |
| C | 0 | 9 | 0 |
| D | 0 | 9 | 0 |
| Mode SS | |||
|---|---|---|---|
| Quadrant | BADHDUFLAG | Total packets | Discarded packets |
| A | 0 | 140 | 0 |
| B | 0 | 140 | 0 |
| C | 0 | 140 | 0 |
| D | 0 | 140 | 0 |
| Mode M0 | |||
|---|---|---|---|
| Quadrant | BADHDUFLAG | Total packets | Discarded packets |
| A | 0 | 17930 | 3 |
| B | 0 | 15338 | 2 |
| C | 0 | 14244 | 2 |
| D | 0 | 16307 | 2 |
| Quadrant | Total seconds | Saturated seconds | Saturation percentage |
|---|---|---|---|
| A | 6972 | 229 | 3.284567% |
| B | 6972 | 64 | 0.917958% |
| C | 6972 | 10 | 0.143431% |
| D | 6972 | 133 | 1.907631% |
Noise dominated data is calculated using 1-second bins in cleaned event files. If a bin has >2000 counts, and if more than 50% of those come from <1% of pixels, then it is considered to be noise-dominated and hence unusable.
| Quadrant | # 1 sec bins | Bins with >0 counts | Bins with >2000 counts | High rate bins dominated by noise | Noise dominated (total time) | Noise dominated (detector-on time) | Marked lightcurve |
|---|---|---|---|---|---|---|---|
| A | 7853 | 6973 | 151 | 151 | 1.92% | 2.17% | 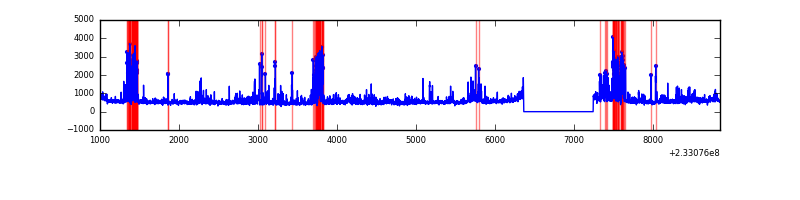 |
| B | 7853 | 6973 | 34 | 34 | 0.43% | 0.49% | 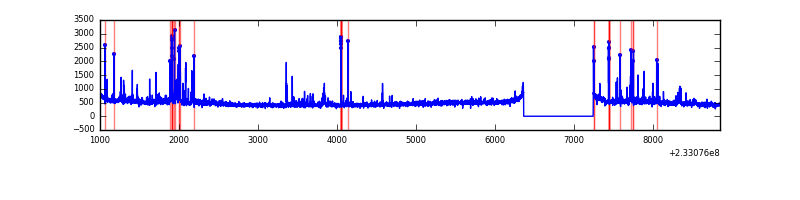 |
| C | 7853 | 6973 | 3 | 3 | 0.04% | 0.04% | 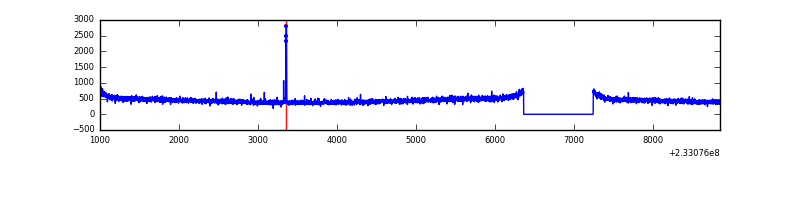 |
| D | 7853 | 6973 | 94 | 94 | 1.20% | 1.35% |  |
Top three noisy pixels from each quadrant. If the there are fewer than three noisy pixels in the level2.evt file, extra rows are filled as -1
| Pixel properties | Quadrant properties | ||||||
|---|---|---|---|---|---|---|---|
| Quadrant | DetID | PixID | Counts | Sigma | Mean | Median | Sigma |
| A | 8 | 5 | 835542 | 5013.13 | 817 | 802 | 166.5 |
| A | 5 | 16 | 455710 | 2732.0 | 817 | 802 | 166.5 |
| A | 15 | 174 | 60034 | 355.72 | 817 | 802 | 166.5 |
| B | 10 | 16 | 239772 | 1516.5 | 825 | 806 | 157.6 |
| B | 0 | 214 | 84071 | 528.41 | 825 | 806 | 157.6 |
| B | 0 | 219 | 16488 | 99.52 | 825 | 806 | 157.6 |
| C | 14 | 234 | 15588 | 80.84 | 789 | 793 | 183.0 |
| C | 13 | 61 | 6016 | 28.54 | 789 | 793 | 183.0 |
| C | 3 | 202 | 1939 | 6.26 | 789 | 793 | 183.0 |
| D | 8 | 195 | 321988 | 1536.76 | 786 | 766 | 209.0 |
| D | 2 | 14 | 241145 | 1150.0 | 786 | 766 | 209.0 |
| D | 1 | 52 | 217163 | 1035.26 | 786 | 766 | 209.0 |
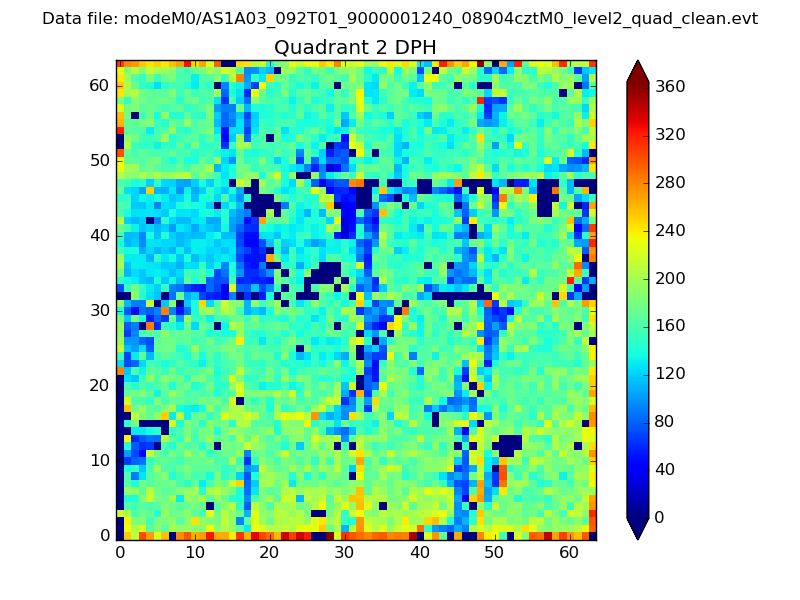
Histogram calculated using DETX and DETY for each event in the final _common_clean file
| Quadrant A |  |
 |
Quadrant B |
|---|---|---|---|
| Quadrant D | 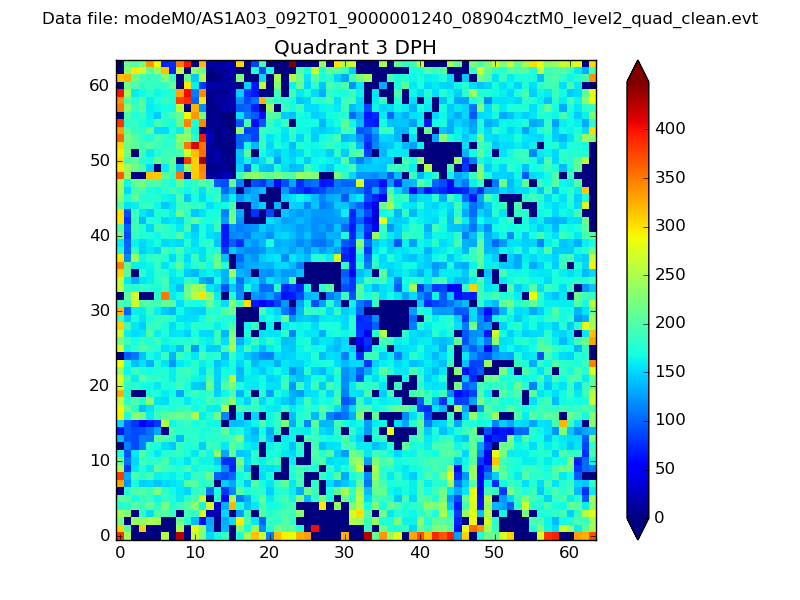 |
 |
Quadrant C |
| Plot type | Count rate plots | Images |
|---|---|---|
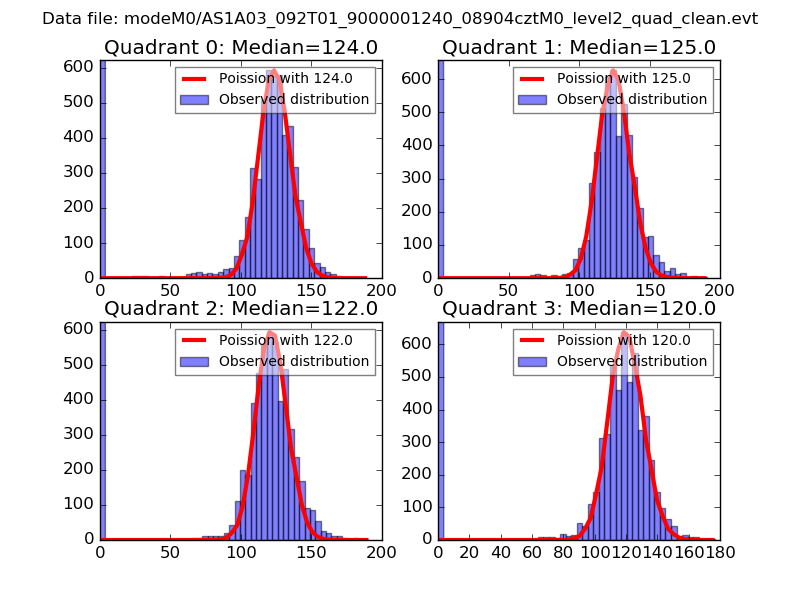
| Comparison with Poisson distribution Blue bars denote a histogram of data divided into 1 sec bins. Red curve is a Poisson curve with rate = median count rate of data. |
 |
 |
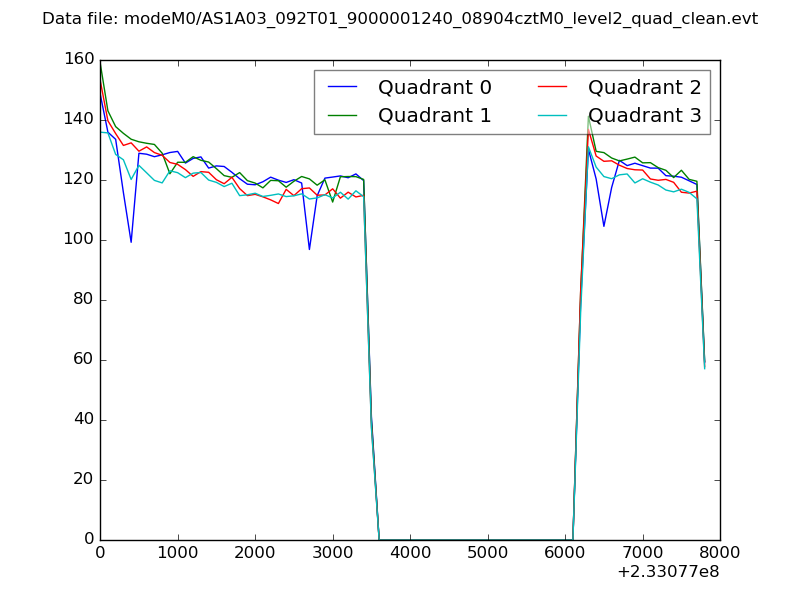
| Quadrant-wise count rates Data is divided into 100 sec bins |
 |
|
| Module-wise count rates for Quadrant A Data is divided into 100 sec bins |
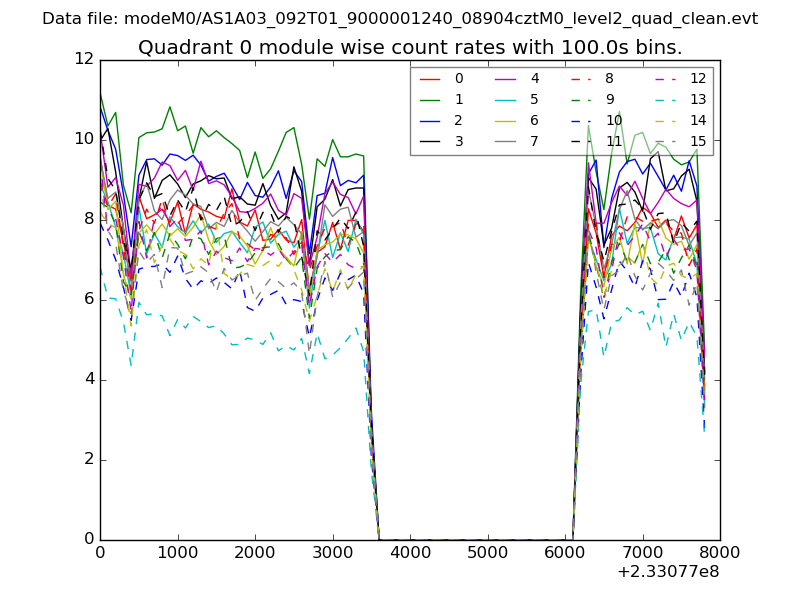 |
 |
| Module-wise count rates for Quadrant B Data is divided into 100 sec bins |
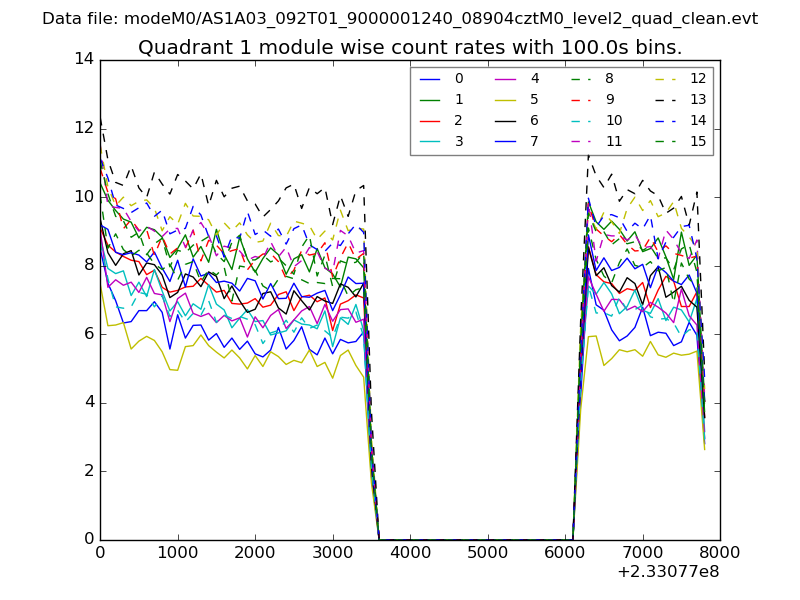 |
 |
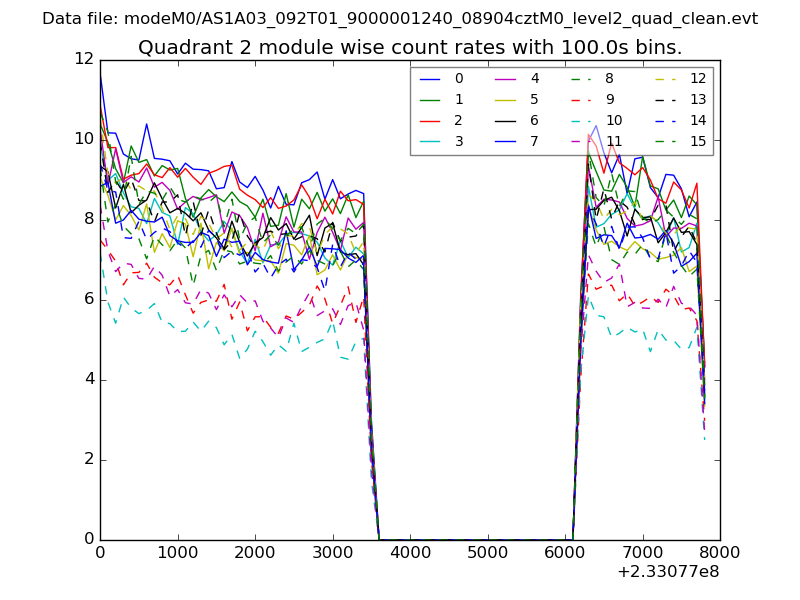
| Module-wise count rates for Quadrant C Data is divided into 100 sec bins |
 |
 |
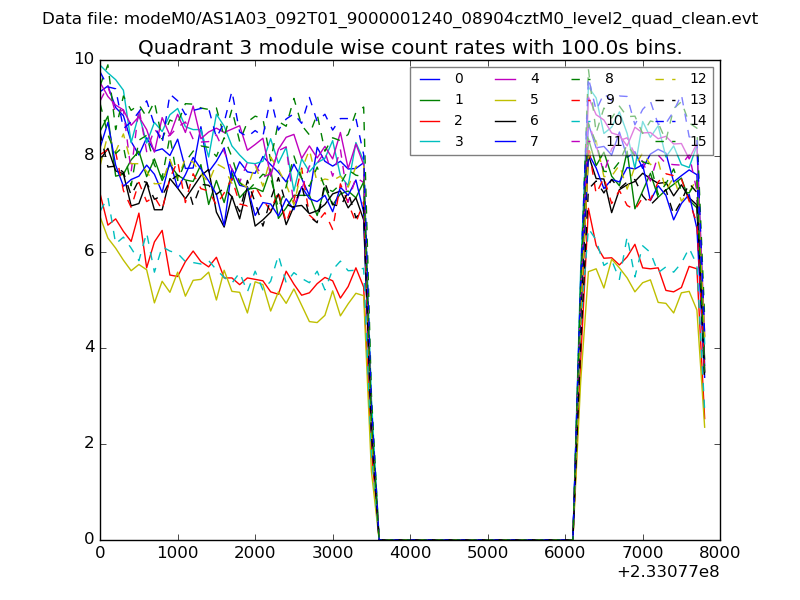
| Module-wise count rates for Quadrant D Data is divided into 100 sec bins |
 |
 |
| Parameter | Plot |
|---|---|
| CZT HV Monitor | 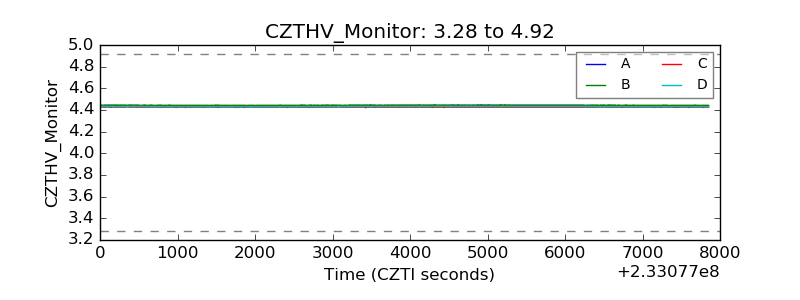 |
| D_VDD | 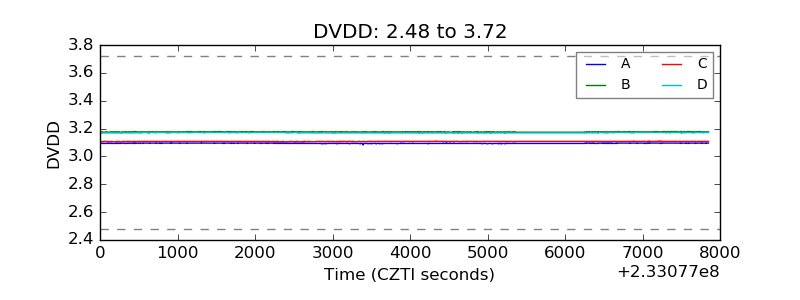 |
| Temperature 1 | 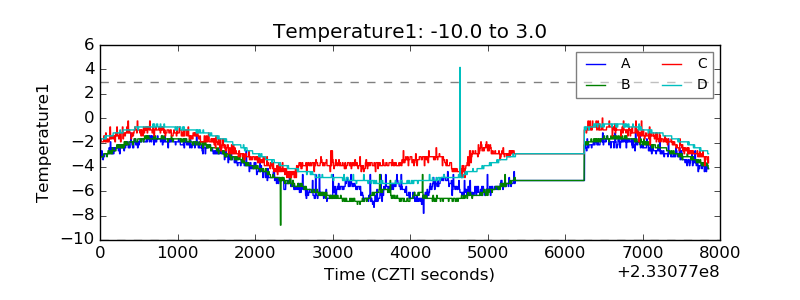 |
| Veto HV Monitor | 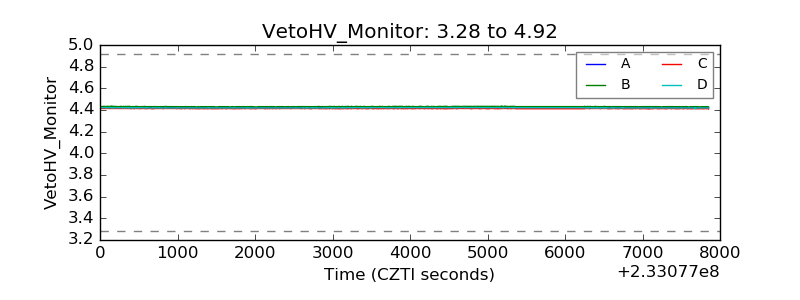 |
| Veto LLD | 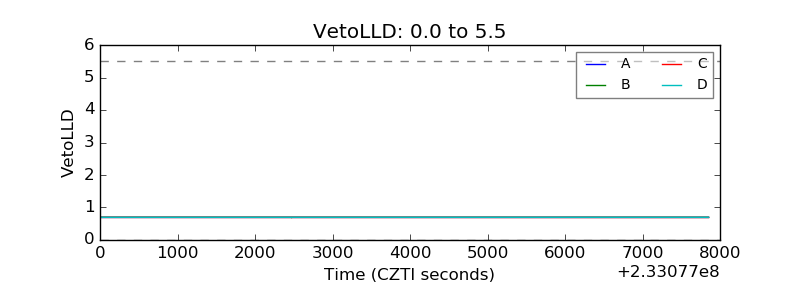 |
| Alpha Counter | 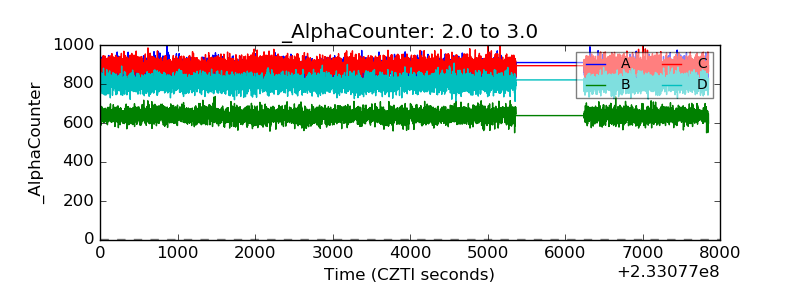 |
| _CPM_Rate | 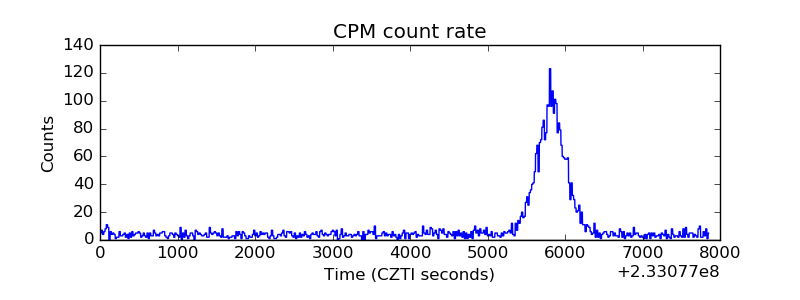 |
| CZT Counter | 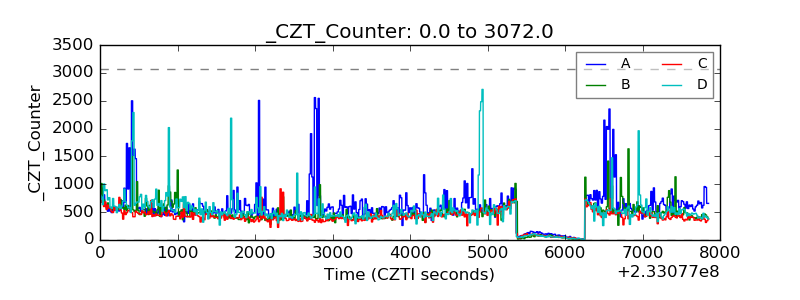 |
| +2.5 Volts monitor |  |
| +5 Volts monitor |  |
| _ROLL_ROT | 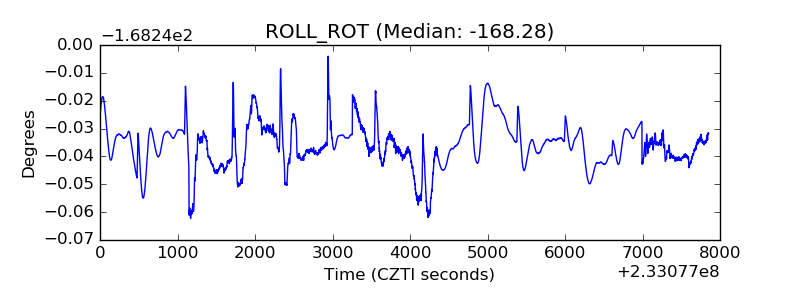 |
| _Roll_DEC | 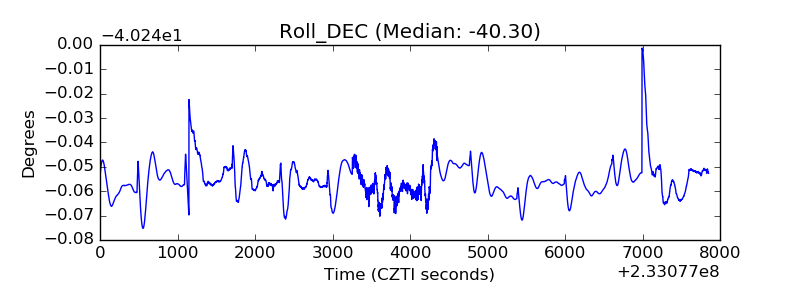 |
| _Roll_RA | 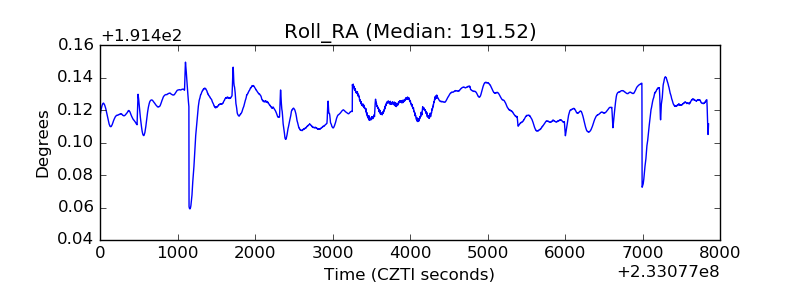 |
| Veto Counter | 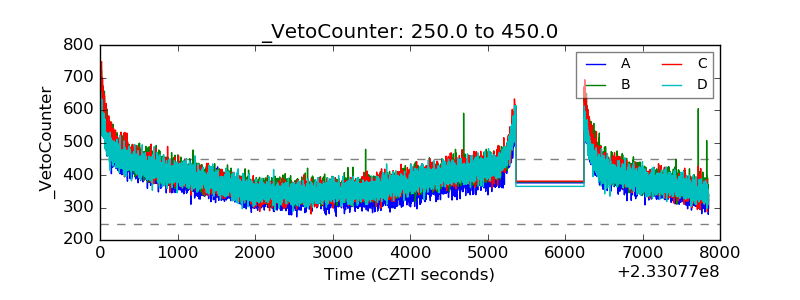 |