| Param | Original file | Final file |
|---|---|---|
| Filename | modeM0/AS1A03_092T01_9000001240_08905cztM0_level2.evt | modeM0/AS1A03_092T01_9000001240_08905cztM0_level2_quad_clean.evt |
| Size (bytes) | 532,592,640 | 99,178,560 |
| Size | 507.9 MB | 94.6 MB |
| Events in quadrant A | 4,813,978 | 627,092 |
| Events in quadrant B | 3,518,133 | 641,443 |
| Events in quadrant C | 3,158,211 | 625,051 |
| Events in quadrant D | 4,150,727 | 608,387 |
| Mode M9 | |||
|---|---|---|---|
| Quadrant | BADHDUFLAG | Total packets | Discarded packets |
| A | 0 | 4 | 0 |
| B | 0 | 4 | 0 |
| C | 0 | 4 | 0 |
| D | 0 | 4 | 0 |
| Mode SS | |||
|---|---|---|---|
| Quadrant | BADHDUFLAG | Total packets | Discarded packets |
| A | 0 | 146 | 0 |
| B | 0 | 146 | 0 |
| C | 0 | 146 | 0 |
| D | 0 | 146 | 0 |
| Mode M0 | |||
|---|---|---|---|
| Quadrant | BADHDUFLAG | Total packets | Discarded packets |
| A | 0 | 19106 | 2 |
| B | 0 | 15315 | 1 |
| C | 0 | 14688 | 1 |
| D | 0 | 17175 | 1 |
| Quadrant | Total seconds | Saturated seconds | Saturation percentage |
|---|---|---|---|
| A | 7202 | 228 | 3.165787% |
| B | 7202 | 64 | 0.888642% |
| C | 7202 | 12 | 0.166620% |
| D | 7202 | 108 | 1.499583% |
Noise dominated data is calculated using 1-second bins in cleaned event files. If a bin has >2000 counts, and if more than 50% of those come from <1% of pixels, then it is considered to be noise-dominated and hence unusable.
| Quadrant | # 1 sec bins | Bins with >0 counts | Bins with >2000 counts | High rate bins dominated by noise | Noise dominated (total time) | Noise dominated (detector-on time) | Marked lightcurve |
|---|---|---|---|---|---|---|---|
| A | 7617 | 7203 | 119 | 119 | 1.56% | 1.65% | 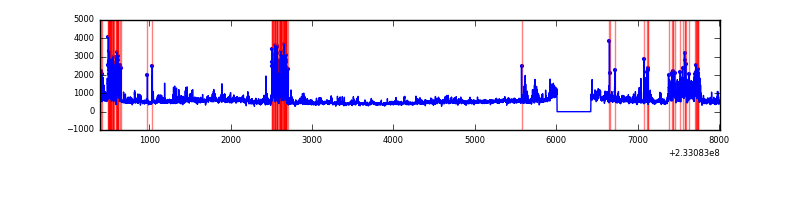 |
| B | 7617 | 7203 | 15 | 15 | 0.20% | 0.21% | 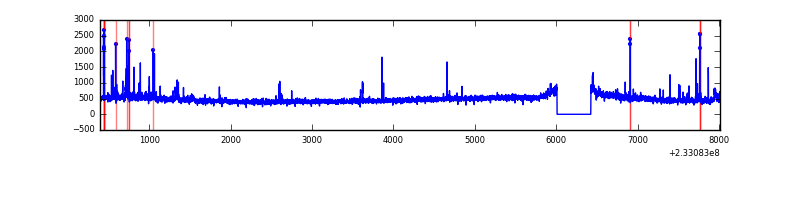 |
| C | 7617 | 7203 | 0 | 0 | 0.00% | 0.00% | 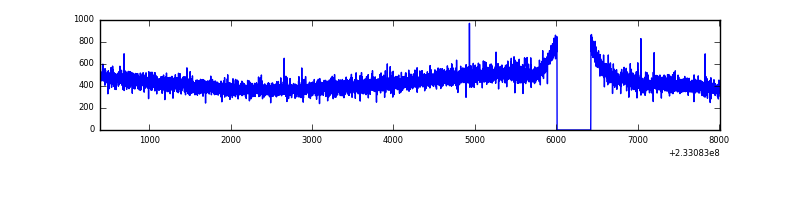 |
| D | 7617 | 7203 | 110 | 110 | 1.44% | 1.53% | 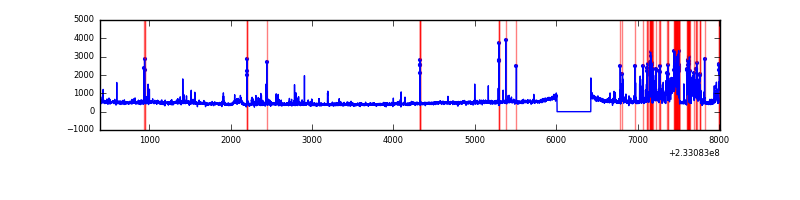 |
Top three noisy pixels from each quadrant. If the there are fewer than three noisy pixels in the level2.evt file, extra rows are filled as -1
| Pixel properties | Quadrant properties | ||||||
|---|---|---|---|---|---|---|---|
| Quadrant | DetID | PixID | Counts | Sigma | Mean | Median | Sigma |
| A | 8 | 5 | 1213135 | 7101.91 | 837 | 818 | 170.7 |
| A | 5 | 16 | 314542 | 1837.84 | 837 | 818 | 170.7 |
| A | 0 | 8 | 18617 | 104.27 | 837 | 818 | 170.7 |
| B | 10 | 16 | 91689 | 558.94 | 847 | 825 | 162.6 |
| B | 0 | 214 | 62890 | 381.79 | 847 | 825 | 162.6 |
| B | 0 | 219 | 25234 | 150.15 | 847 | 825 | 162.6 |
| C | 13 | 61 | 6228 | 28.74 | 809 | 812 | 188.4 |
| C | 8 | 128 | 2709 | 10.07 | 809 | 812 | 188.4 |
| C | 3 | 202 | 1962 | 6.1 | 809 | 812 | 188.4 |
| D | 12 | 233 | 582508 | 2679.97 | 807 | 784 | 217.1 |
| D | 8 | 195 | 289367 | 1329.48 | 807 | 784 | 217.1 |
| D | 2 | 14 | 92870 | 424.23 | 807 | 784 | 217.1 |
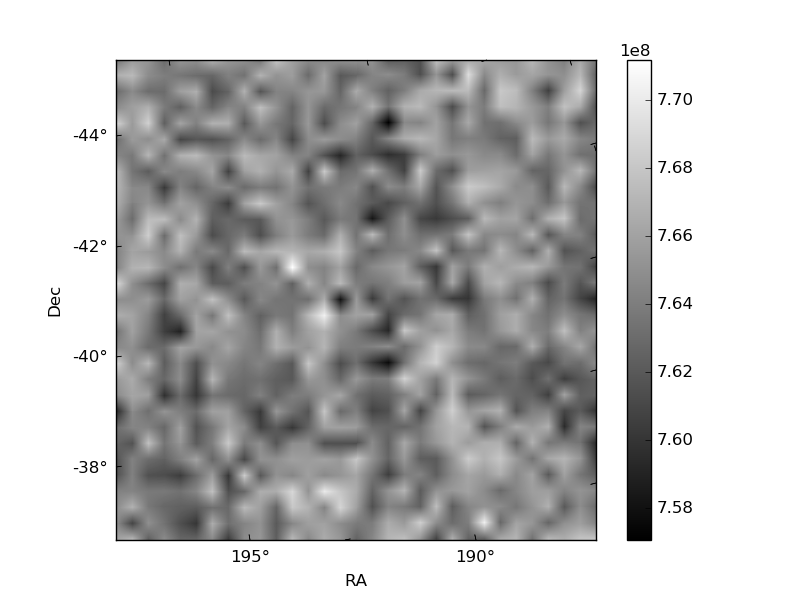
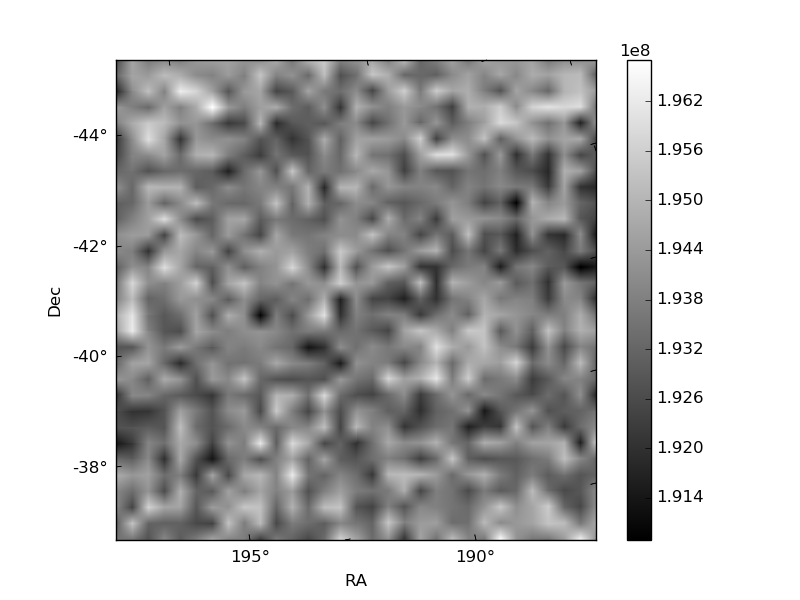
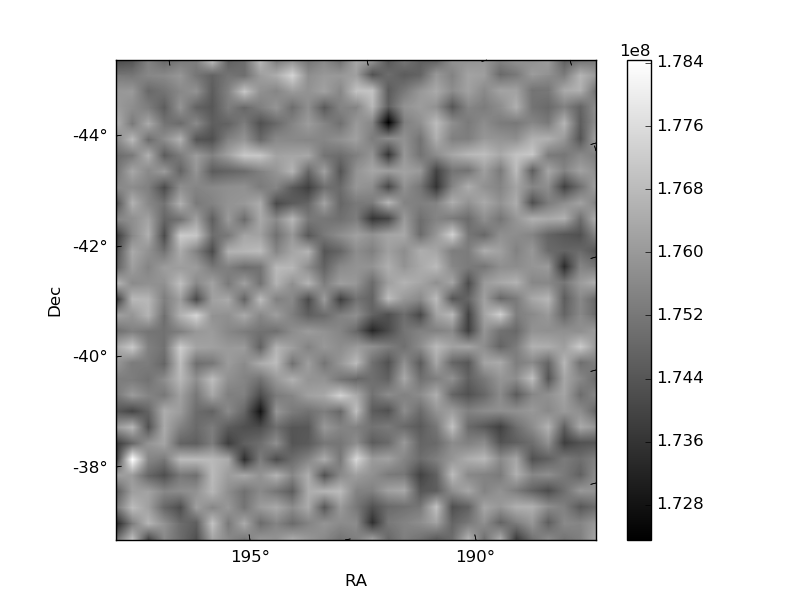
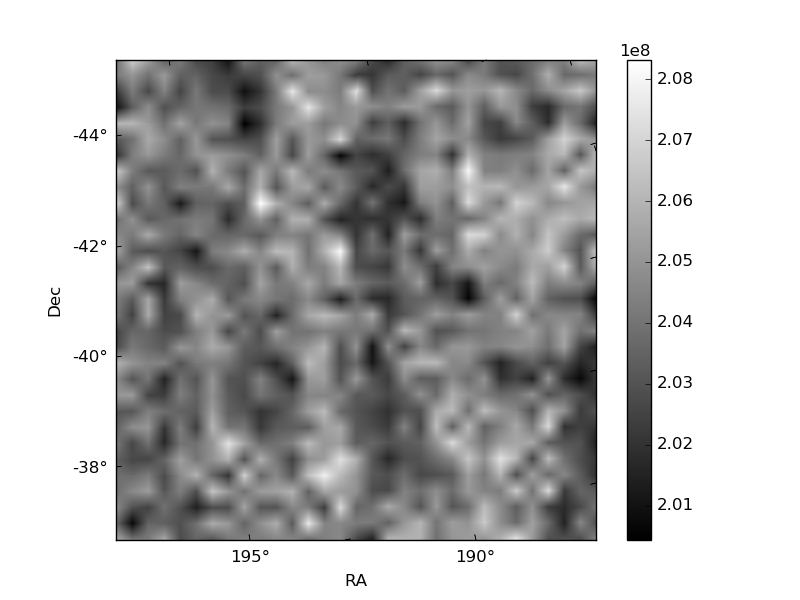
Histogram calculated using DETX and DETY for each event in the final _common_clean file
| Quadrant A | 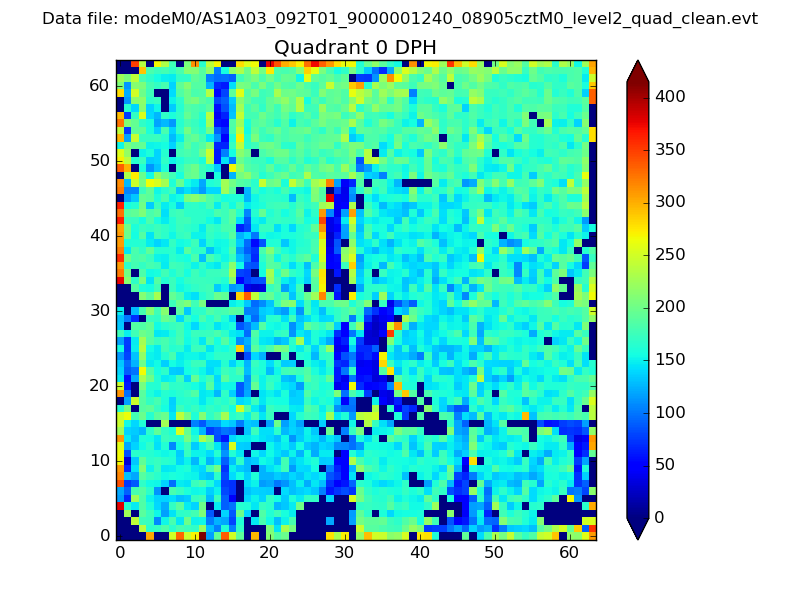 |
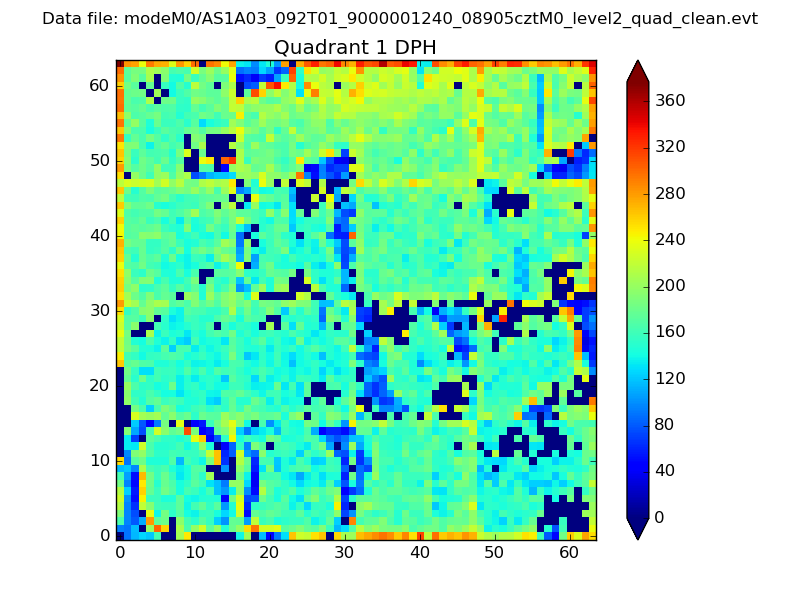 |
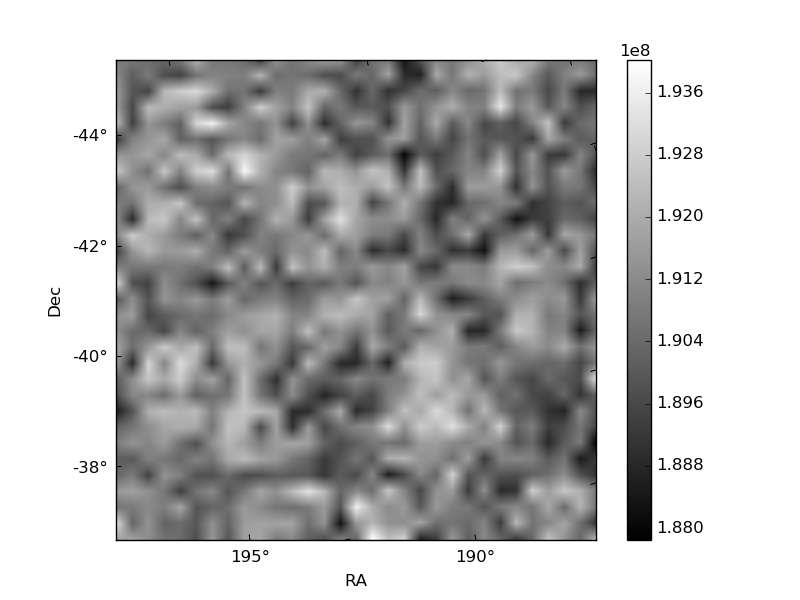
Quadrant B |
|---|---|---|---|
| Quadrant D | 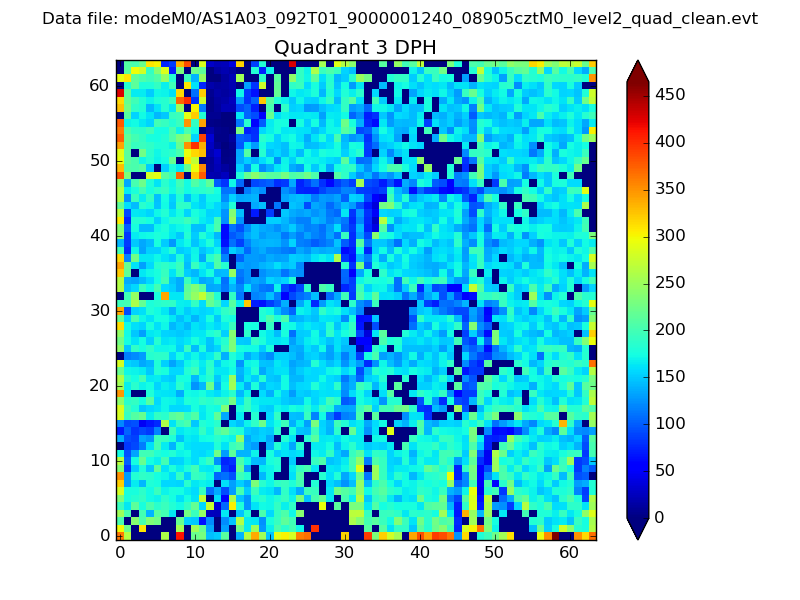 |
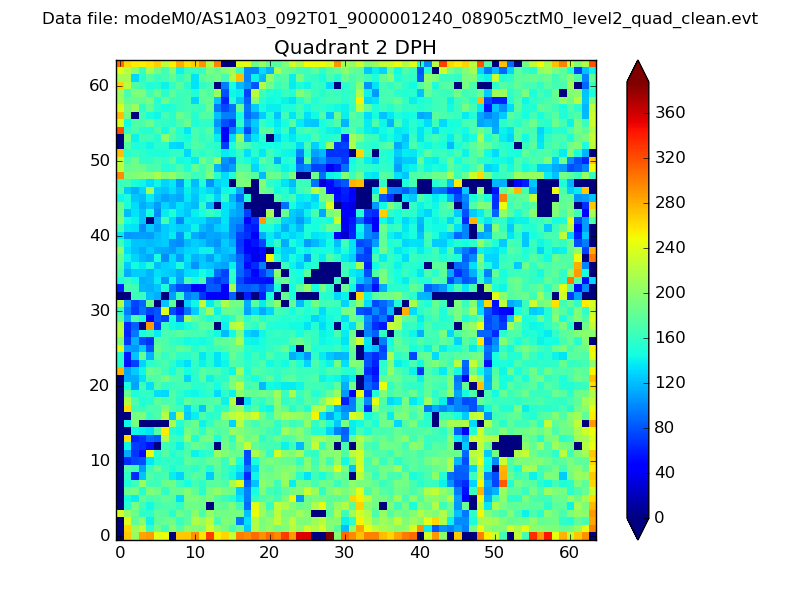 |
Quadrant C |
| Plot type | Count rate plots | Images |
|---|---|---|
| Comparison with Poisson distribution Blue bars denote a histogram of data divided into 1 sec bins. Red curve is a Poisson curve with rate = median count rate of data. |
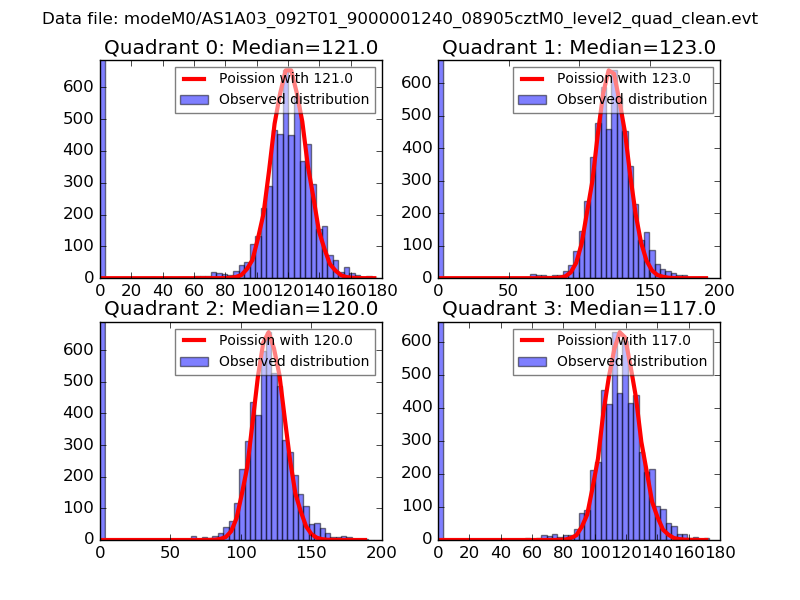 |
 |
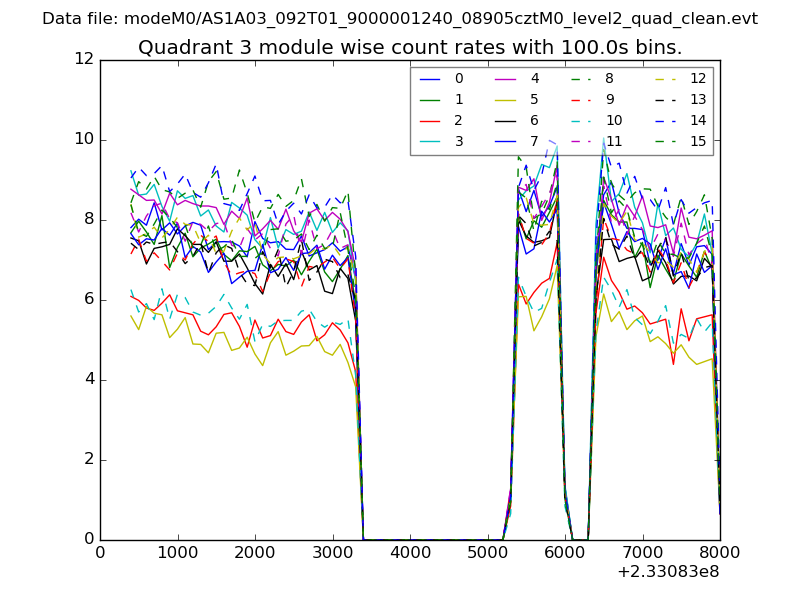
| Quadrant-wise count rates Data is divided into 100 sec bins |
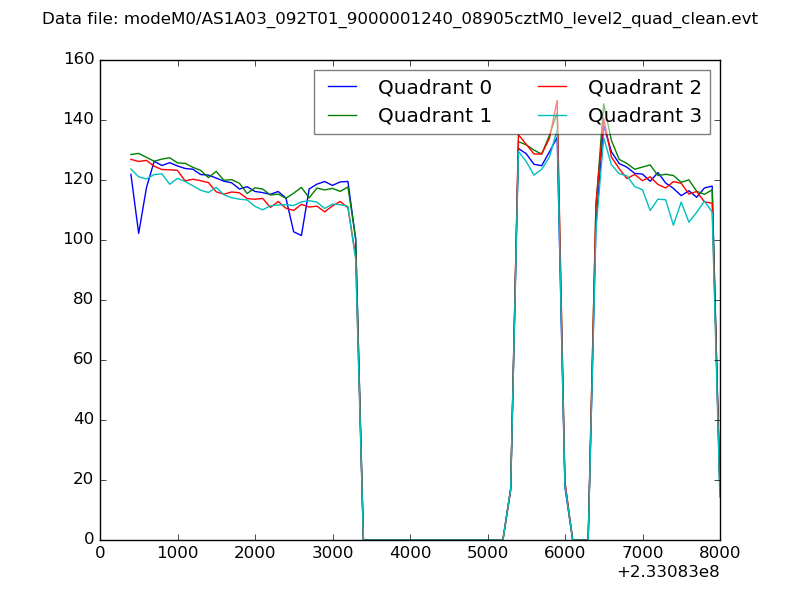 |
|
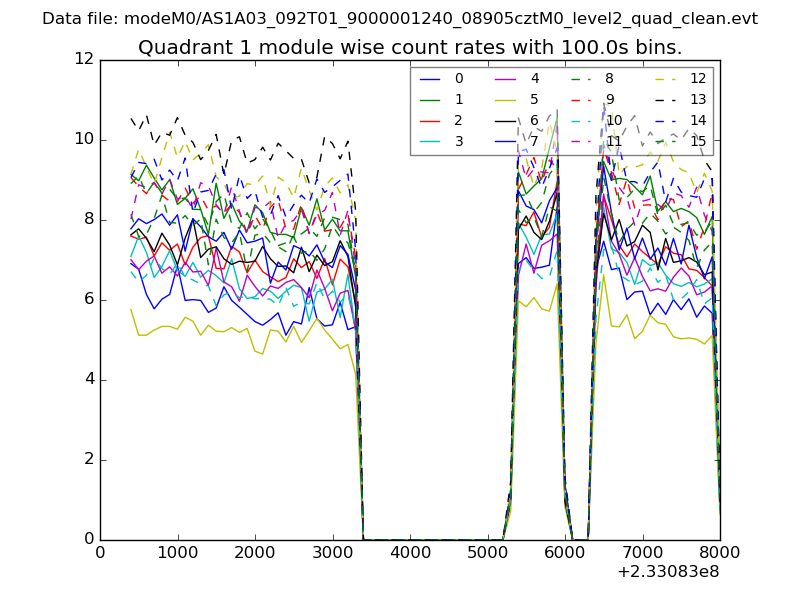
| Module-wise count rates for Quadrant A Data is divided into 100 sec bins |
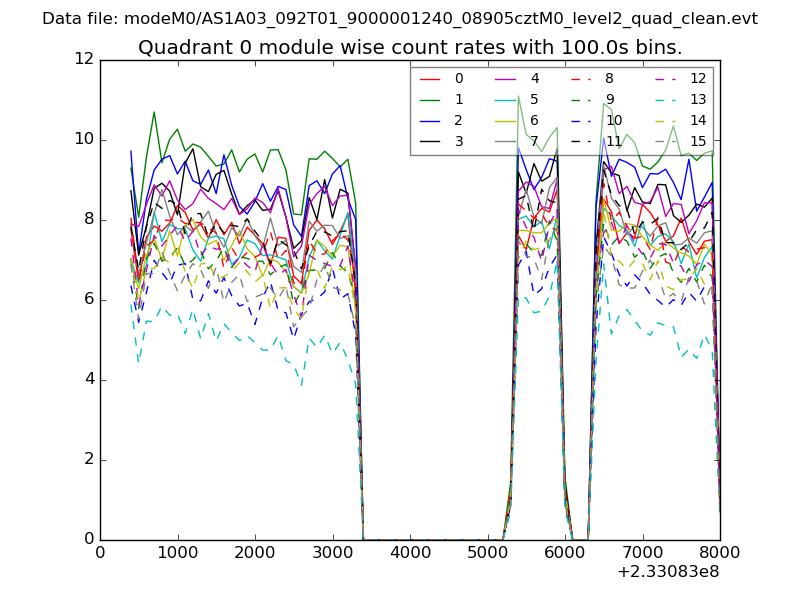 |
 |
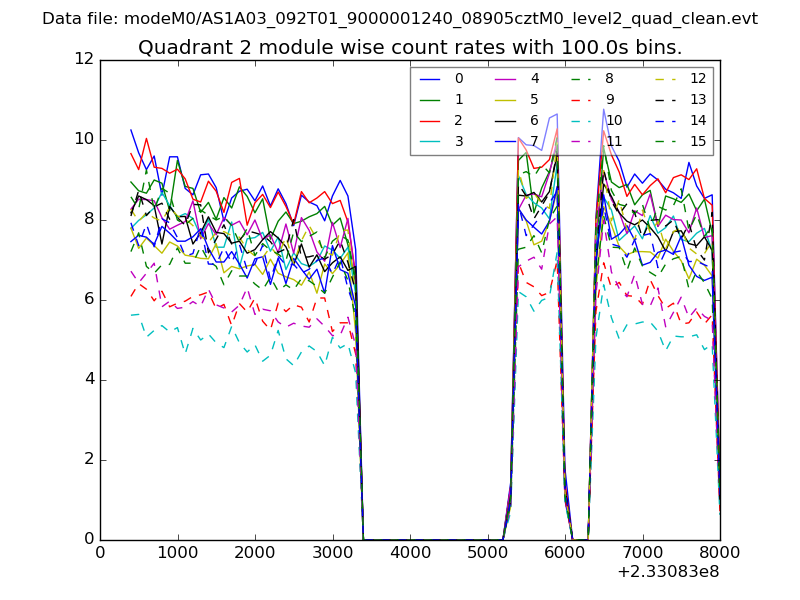
| Module-wise count rates for Quadrant B Data is divided into 100 sec bins |
 |
 |
| Module-wise count rates for Quadrant C Data is divided into 100 sec bins |
 |
 |
| Module-wise count rates for Quadrant D Data is divided into 100 sec bins |
 |
 |
| Parameter | Plot |
|---|---|
| CZT HV Monitor | 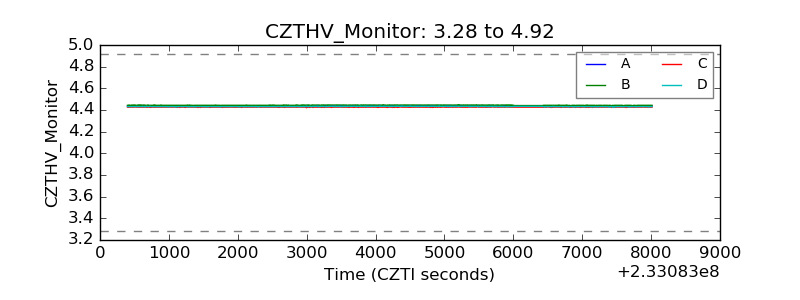 |
| D_VDD | 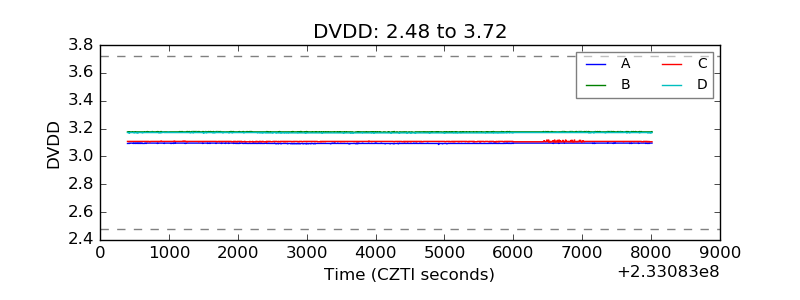 |
| Temperature 1 |  |
| Veto HV Monitor | 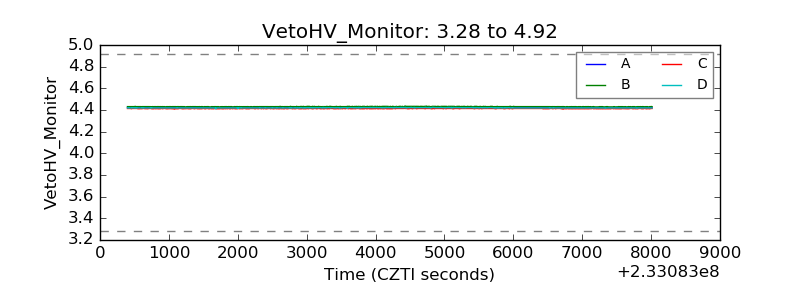 |
| Veto LLD | 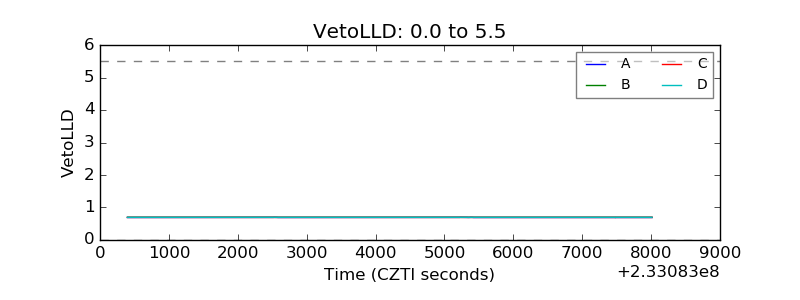 |
| Alpha Counter | 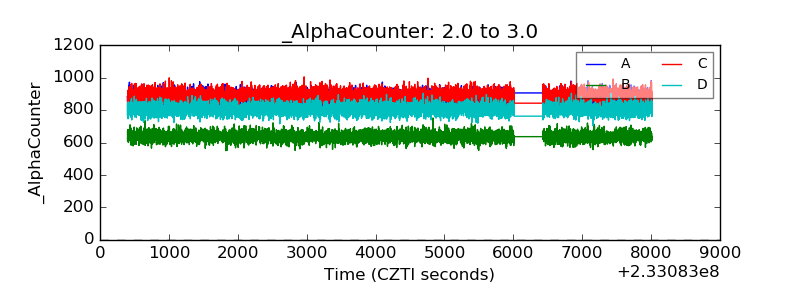 |
| _CPM_Rate | 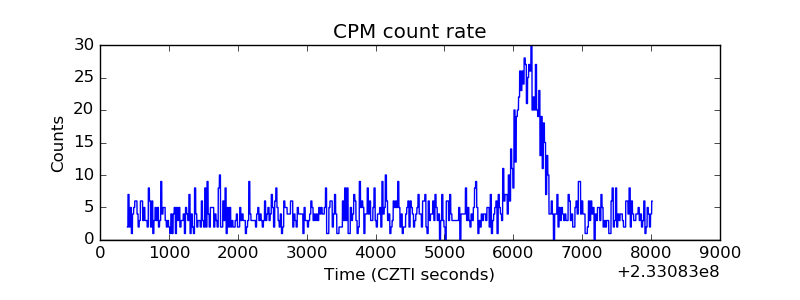 |
| CZT Counter | 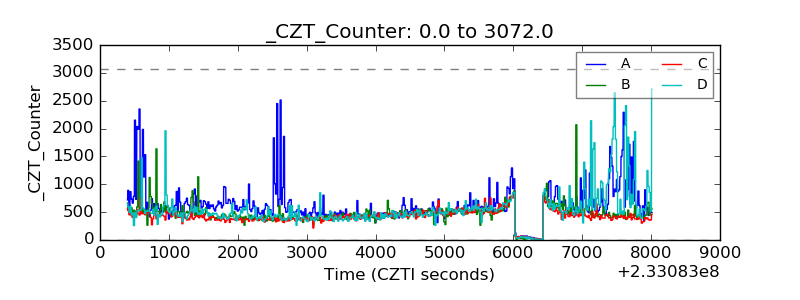 |
| +2.5 Volts monitor |  |
| +5 Volts monitor |  |
| _ROLL_ROT | 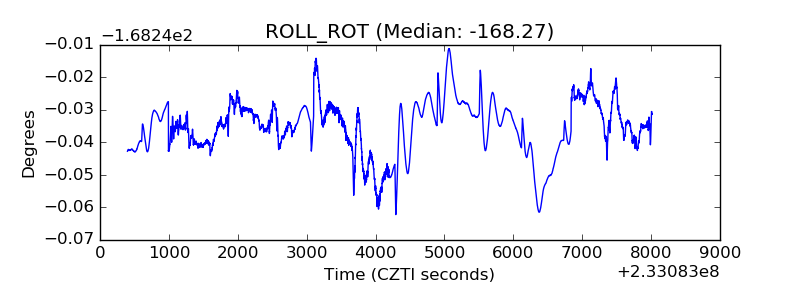 |
| _Roll_DEC |  |
| _Roll_RA | 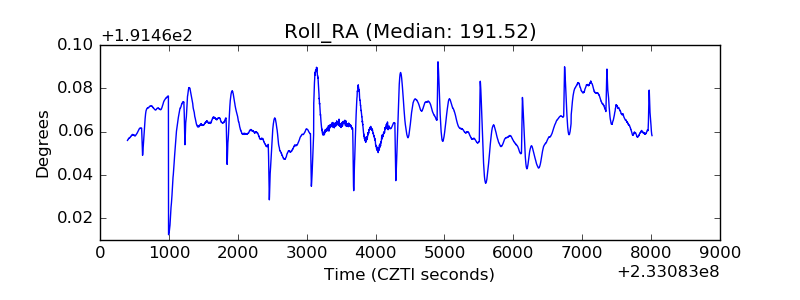 |
| Veto Counter | 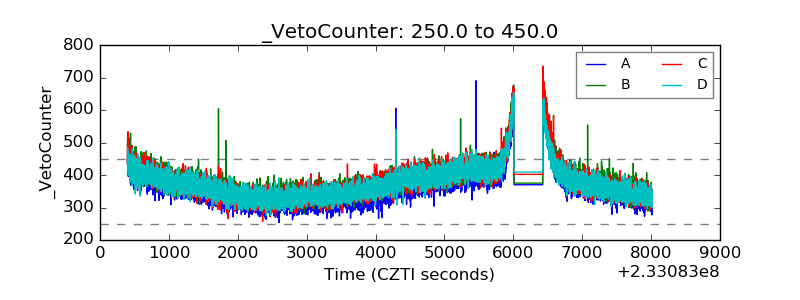 |