| Param | Original file | Final file |
|---|---|---|
| Filename | modeM0/AS1A03_092T01_9000001240_08906cztM0_level2.evt | modeM0/AS1A03_092T01_9000001240_08906cztM0_level2_quad_clean.evt |
| Size (bytes) | 615,672,000 | 108,630,720 |
| Size | 587.2 MB | 103.6 MB |
| Events in quadrant A | 4,986,016 | 693,659 |
| Events in quadrant B | 4,122,692 | 703,378 |
| Events in quadrant C | 3,443,637 | 690,372 |
| Events in quadrant D | 5,569,531 | 664,492 |
| Mode M9 | |||
|---|---|---|---|
| Quadrant | BADHDUFLAG | Total packets | Discarded packets |
| A | 0 | 7 | 0 |
| B | 0 | 7 | 0 |
| C | 0 | 7 | 0 |
| D | 0 | 7 | 0 |
| Mode SS | |||
|---|---|---|---|
| Quadrant | BADHDUFLAG | Total packets | Discarded packets |
| A | 0 | 160 | 0 |
| B | 0 | 160 | 0 |
| C | 0 | 160 | 0 |
| D | 0 | 160 | 0 |
| Mode M0 | |||
|---|---|---|---|
| Quadrant | BADHDUFLAG | Total packets | Discarded packets |
| A | 0 | 19920 | 3 |
| B | 0 | 17439 | 2 |
| C | 0 | 15942 | 2 |
| D | 0 | 21733 | 2 |
| Quadrant | Total seconds | Saturated seconds | Saturation percentage |
|---|---|---|---|
| A | 7735 | 269 | 3.477699% |
| B | 7735 | 171 | 2.210730% |
| C | 7735 | 27 | 0.349063% |
| D | 7735 | 263 | 3.400129% |
Noise dominated data is calculated using 1-second bins in cleaned event files. If a bin has >2000 counts, and if more than 50% of those come from <1% of pixels, then it is considered to be noise-dominated and hence unusable.
| Quadrant | # 1 sec bins | Bins with >0 counts | Bins with >2000 counts | High rate bins dominated by noise | Noise dominated (total time) | Noise dominated (detector-on time) | Marked lightcurve |
|---|---|---|---|---|---|---|---|
| A | 8440 | 7738 | 169 | 169 | 2.00% | 2.18% | 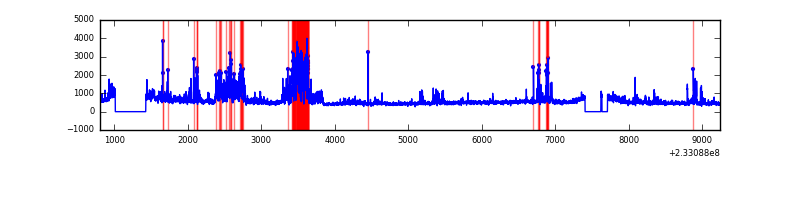 |
| B | 8440 | 7738 | 64 | 64 | 0.76% | 0.83% | 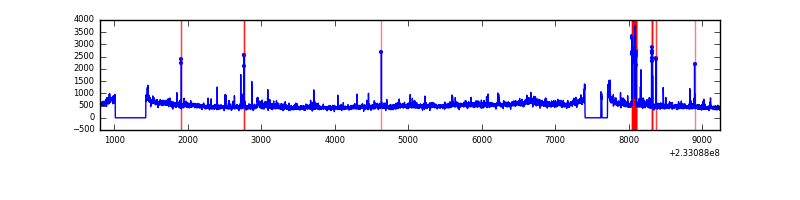 |
| C | 8440 | 7738 | 0 | 0 | 0.00% | 0.00% |  |
| D | 8440 | 7738 | 263 | 263 | 3.12% | 3.40% | 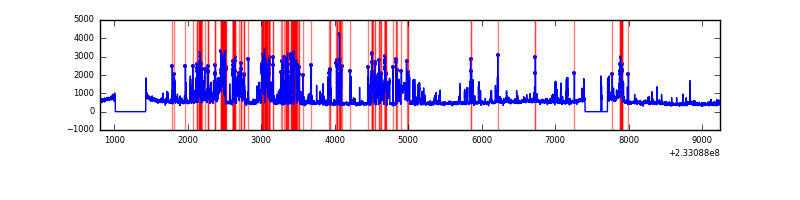 |
Top three noisy pixels from each quadrant. If the there are fewer than three noisy pixels in the level2.evt file, extra rows are filled as -1
| Pixel properties | Quadrant properties | ||||||
|---|---|---|---|---|---|---|---|
| Quadrant | DetID | PixID | Counts | Sigma | Mean | Median | Sigma |
| A | 8 | 5 | 1073850 | 5802.32 | 907 | 887 | 184.9 |
| A | 5 | 16 | 386877 | 2087.34 | 907 | 887 | 184.9 |
| A | 15 | 174 | 17559 | 90.16 | 907 | 887 | 184.9 |
| B | 0 | 219 | 262724 | 1476.8 | 915 | 892 | 177.3 |
| B | 10 | 16 | 173266 | 972.24 | 915 | 892 | 177.3 |
| B | 0 | 214 | 28547 | 155.98 | 915 | 892 | 177.3 |
| C | 13 | 61 | 6670 | 28.32 | 878 | 879 | 204.5 |
| C | 3 | 233 | 6365 | 26.83 | 878 | 879 | 204.5 |
| C | 9 | 68 | 5493 | 22.56 | 878 | 879 | 204.5 |
| D | 12 | 233 | 713621 | 3050.49 | 870 | 847 | 233.7 |
| D | 1 | 52 | 684347 | 2925.21 | 870 | 847 | 233.7 |
| D | 7 | 71 | 411901 | 1759.21 | 870 | 847 | 233.7 |
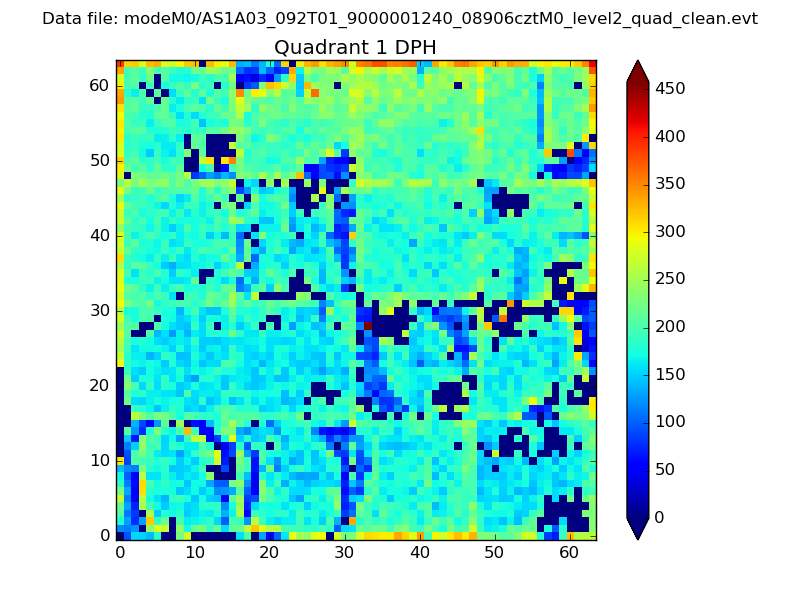
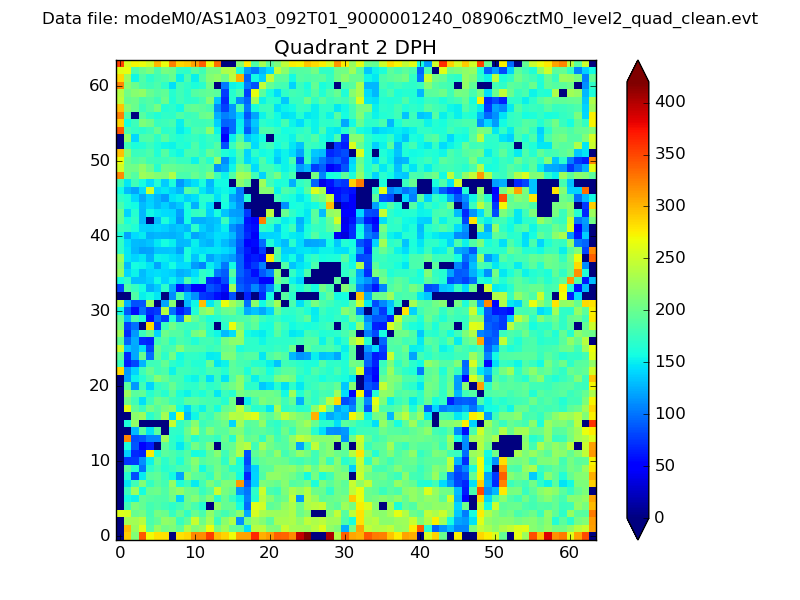
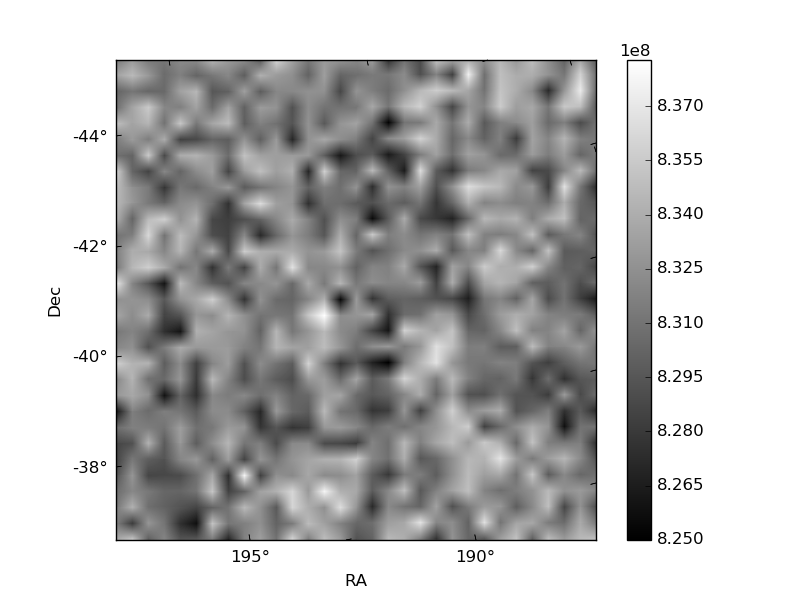
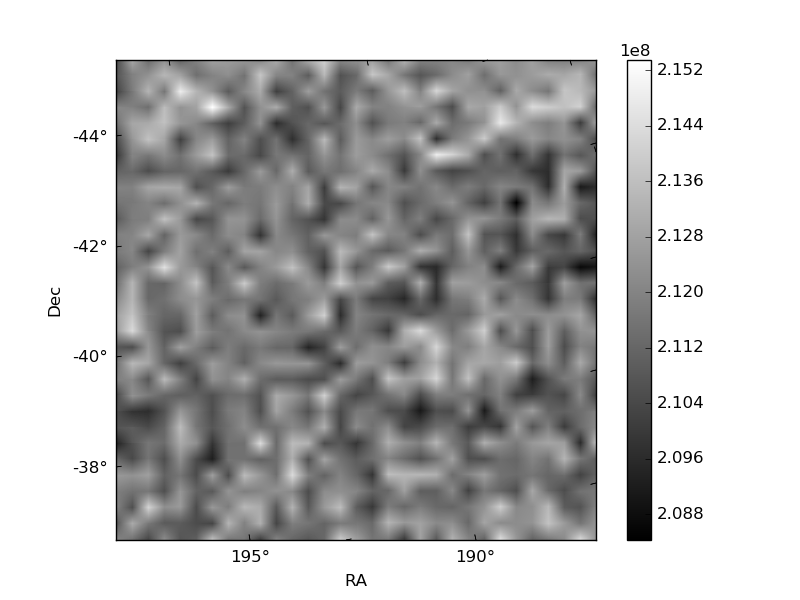
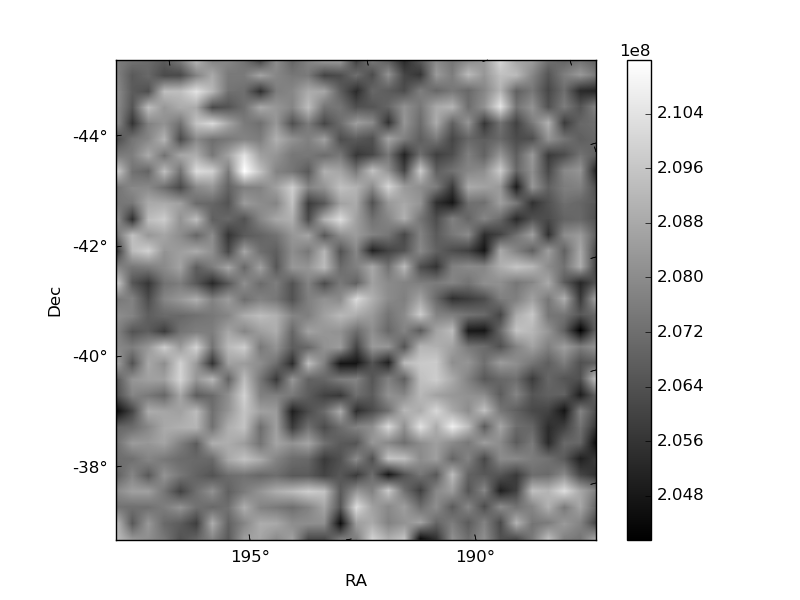
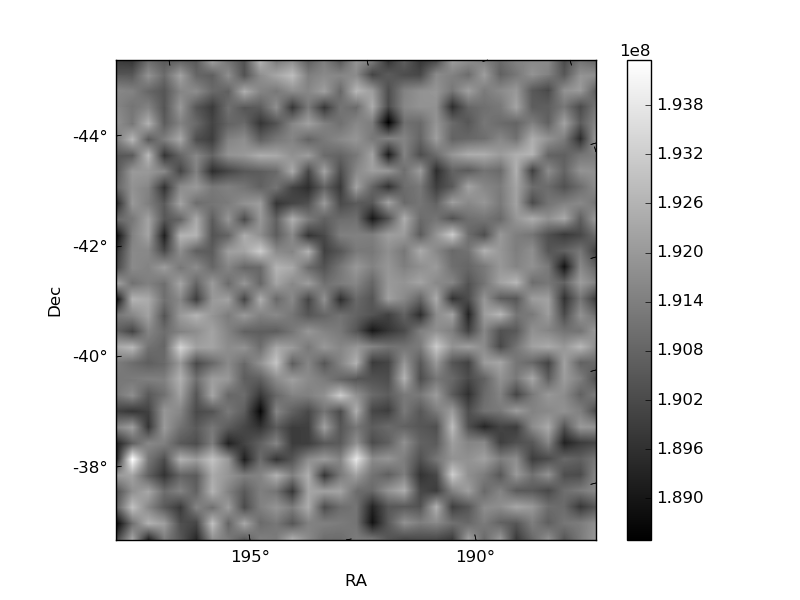
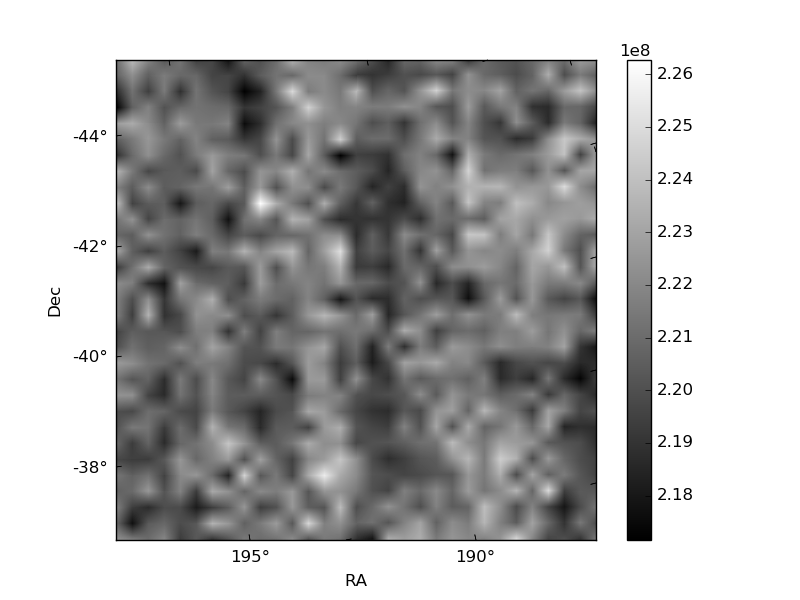
Histogram calculated using DETX and DETY for each event in the final _common_clean file
| Quadrant A | 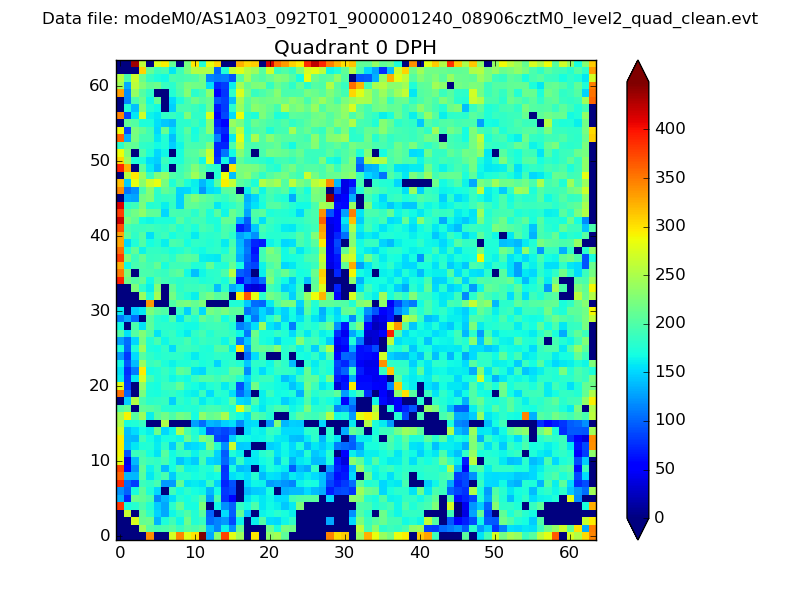 |
 |
Quadrant B |
|---|---|---|---|
| Quadrant D | 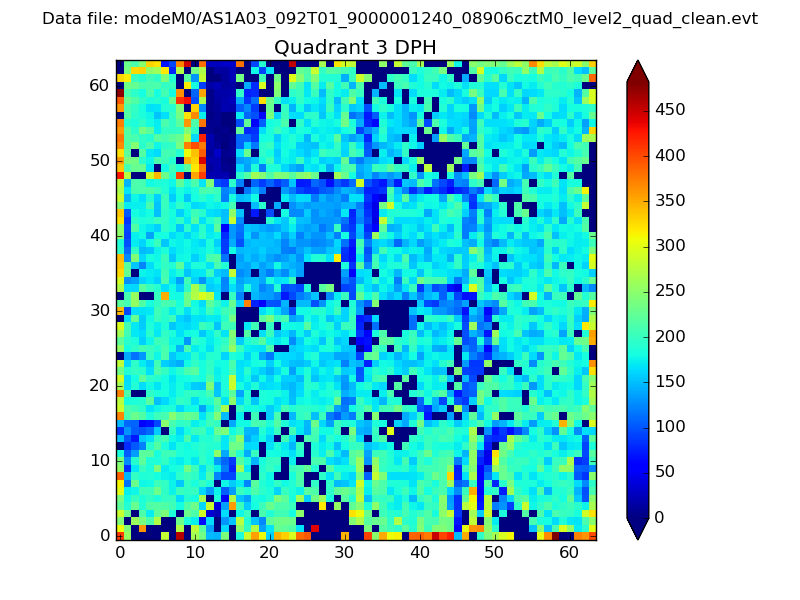 |
 |
Quadrant C |
| Plot type | Count rate plots | Images |
|---|---|---|
| Comparison with Poisson distribution Blue bars denote a histogram of data divided into 1 sec bins. Red curve is a Poisson curve with rate = median count rate of data. |
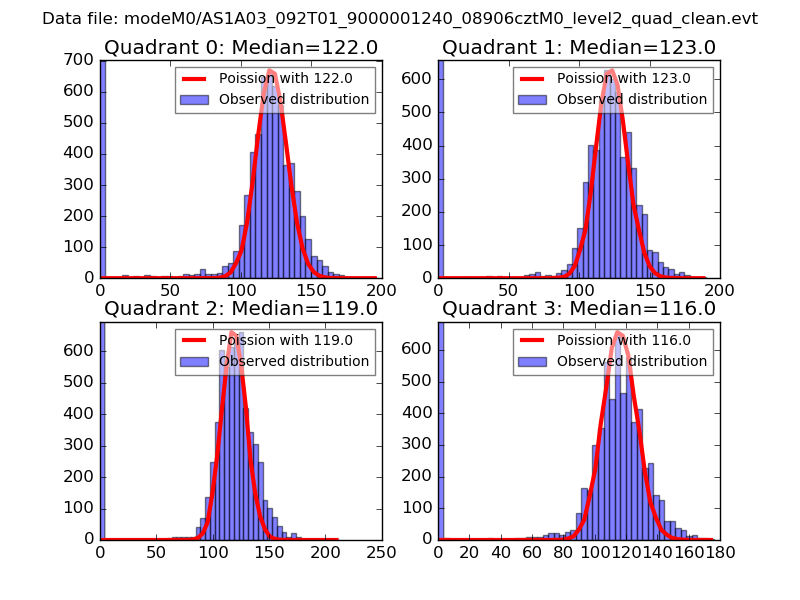 |
 |
| Quadrant-wise count rates Data is divided into 100 sec bins |
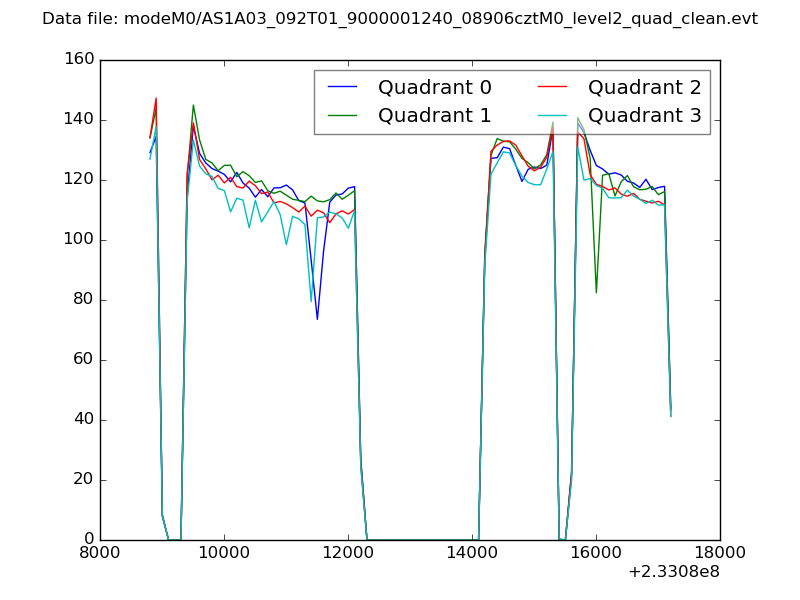 |
|
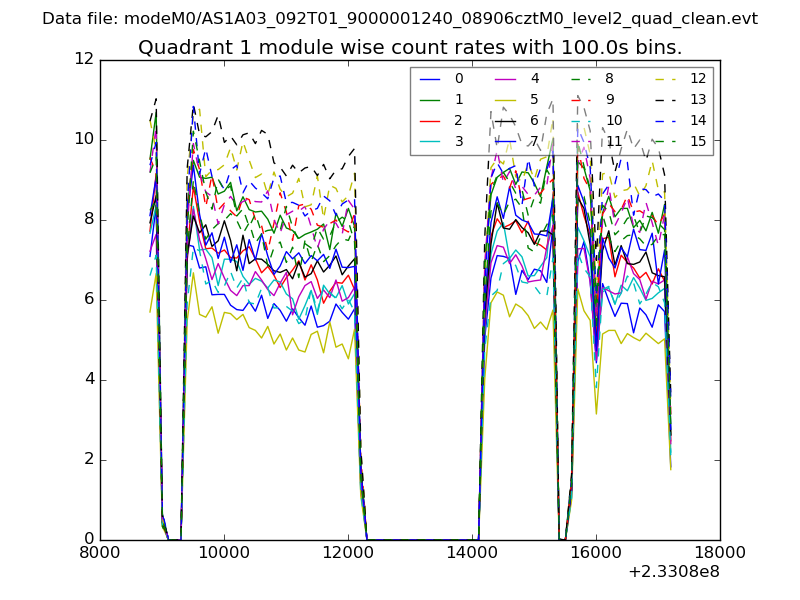
| Module-wise count rates for Quadrant A Data is divided into 100 sec bins |
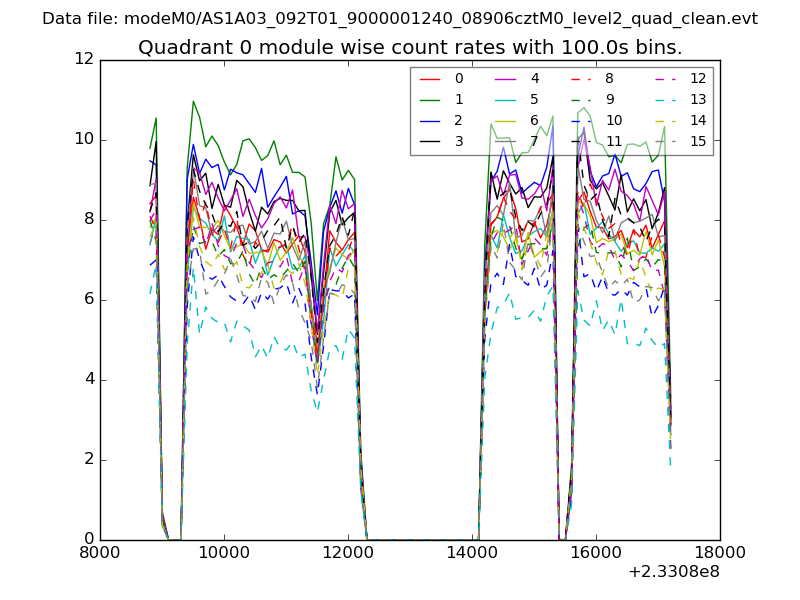 |
 |
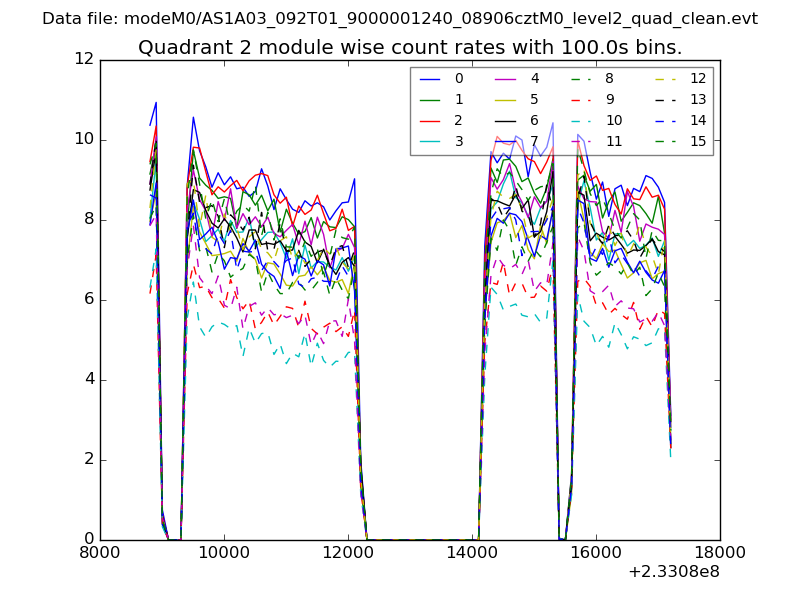
| Module-wise count rates for Quadrant B Data is divided into 100 sec bins |
 |
 |
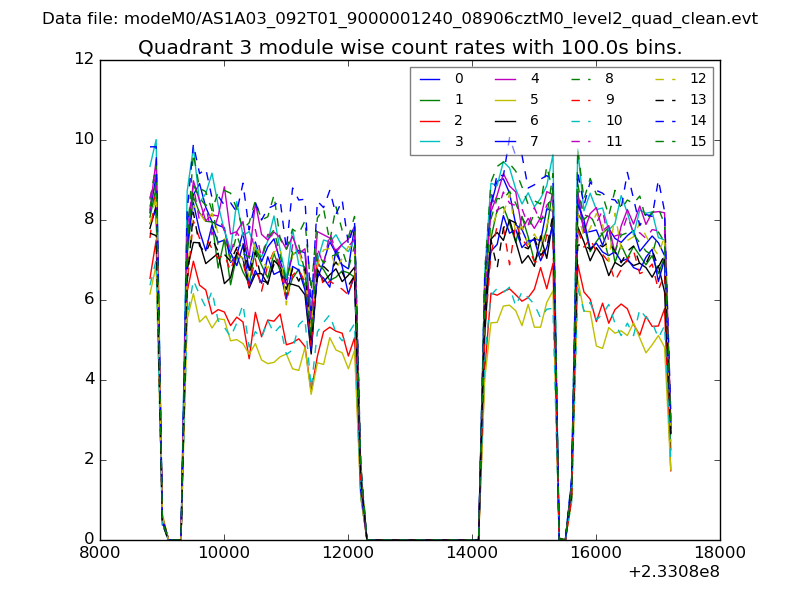
| Module-wise count rates for Quadrant C Data is divided into 100 sec bins |
 |
 |
| Module-wise count rates for Quadrant D Data is divided into 100 sec bins |
 |
 |
| Parameter | Plot |
|---|---|
| CZT HV Monitor | 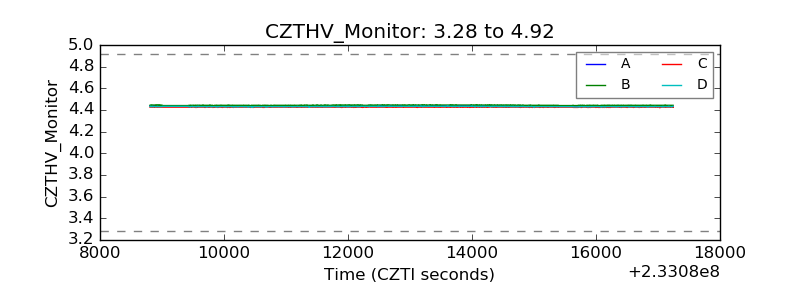 |
| D_VDD | 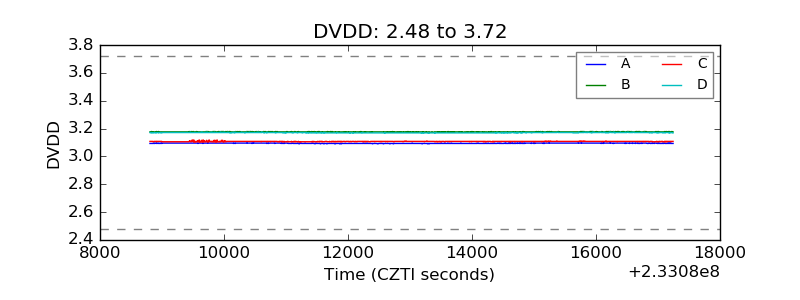 |
| Temperature 1 | 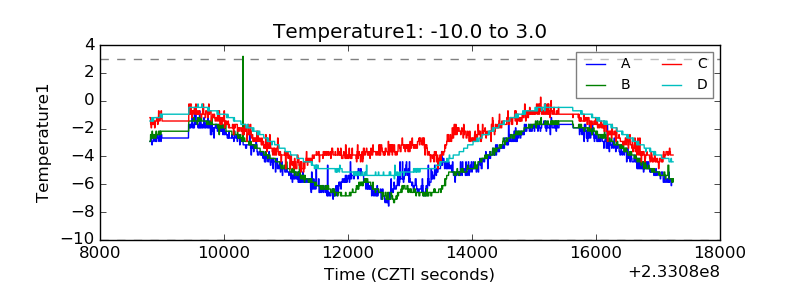 |
| Veto HV Monitor | 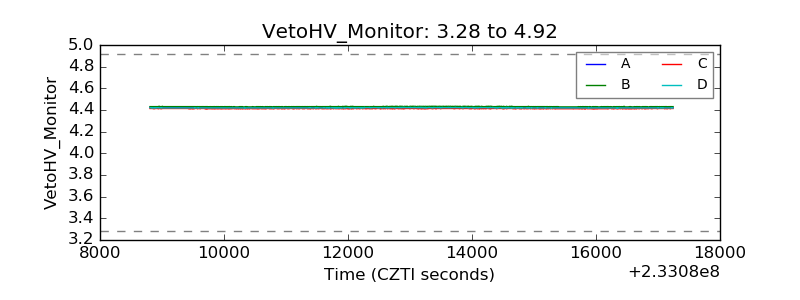 |
| Veto LLD | 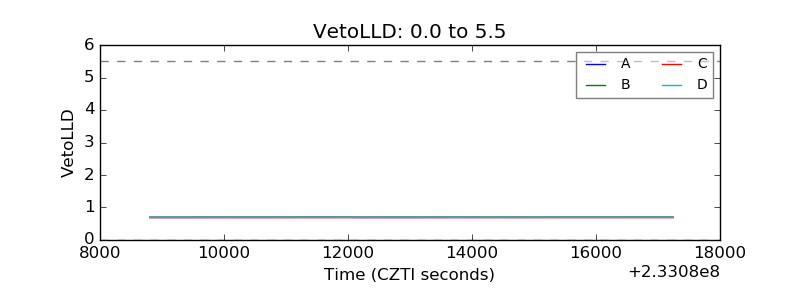 |
| Alpha Counter | 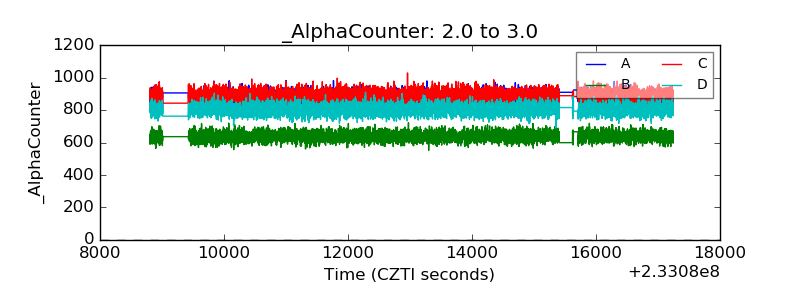 |
| _CPM_Rate | 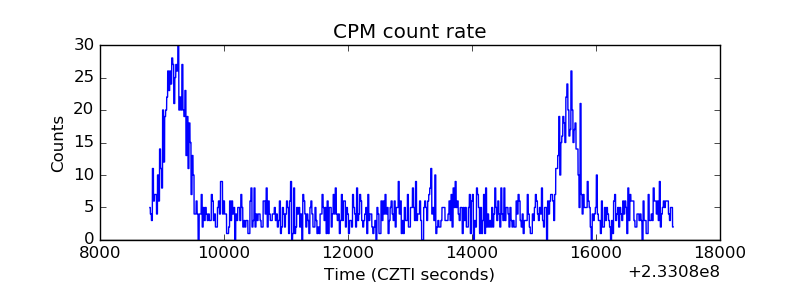 |
| CZT Counter | 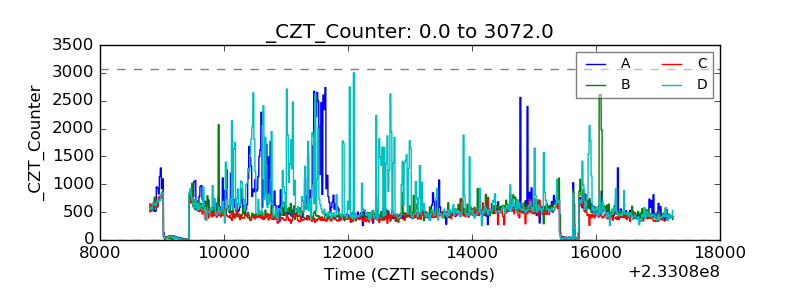 |
| +2.5 Volts monitor |  |
| +5 Volts monitor |  |
| _ROLL_ROT | 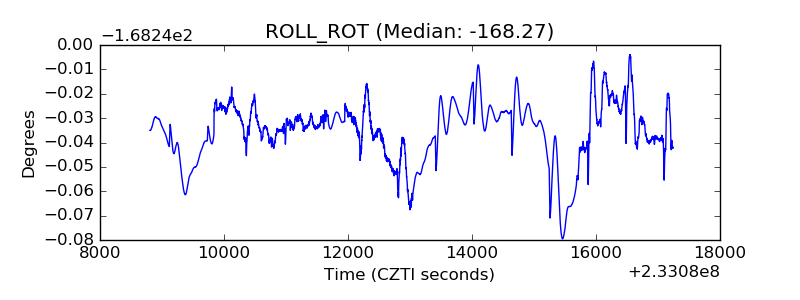 |
| _Roll_DEC |  |
| _Roll_RA | 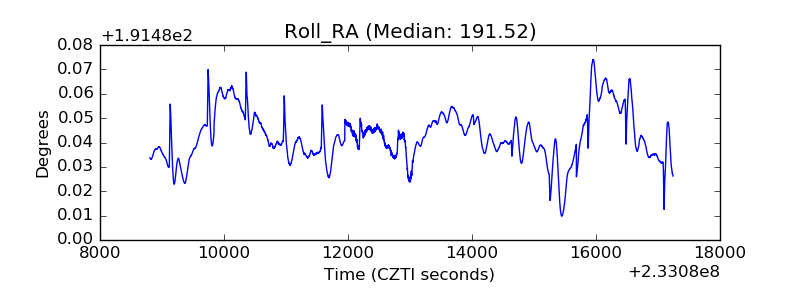 |
| Veto Counter | 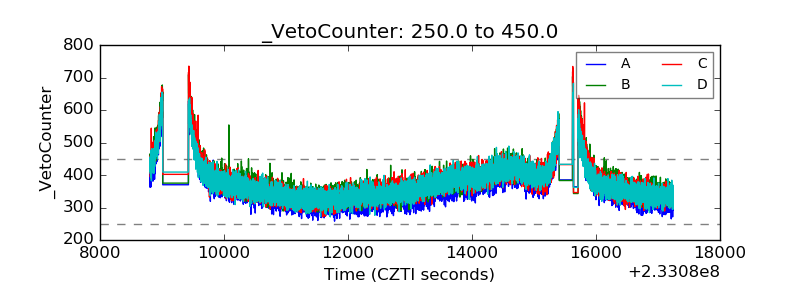 |