| Param | Original file | Final file |
|---|---|---|
| Filename | modeM0/AS1A03_092T01_9000001240_08907cztM0_level2.evt | modeM0/AS1A03_092T01_9000001240_08907cztM0_level2_quad_clean.evt |
| Size (bytes) | 583,427,520 | 113,840,640 |
| Size | 556.4 MB | 108.6 MB |
| Events in quadrant A | 5,080,116 | 729,312 |
| Events in quadrant B | 4,094,729 | 737,684 |
| Events in quadrant C | 3,533,286 | 721,587 |
| Events in quadrant D | 4,418,395 | 702,735 |
| Mode M9 | |||
|---|---|---|---|
| Quadrant | BADHDUFLAG | Total packets | Discarded packets |
| A | 0 | 7 | 0 |
| B | 0 | 7 | 0 |
| C | 0 | 7 | 0 |
| D | 0 | 7 | 0 |
| Mode SS | |||
|---|---|---|---|
| Quadrant | BADHDUFLAG | Total packets | Discarded packets |
| A | 0 | 164 | 0 |
| B | 0 | 164 | 0 |
| C | 0 | 164 | 0 |
| D | 0 | 164 | 0 |
| Mode M0 | |||
|---|---|---|---|
| Quadrant | BADHDUFLAG | Total packets | Discarded packets |
| A | 0 | 20544 | 3 |
| B | 0 | 17541 | 2 |
| C | 0 | 16369 | 2 |
| D | 0 | 18581 | 2 |
| Quadrant | Total seconds | Saturated seconds | Saturation percentage |
|---|---|---|---|
| A | 8011 | 153 | 1.909874% |
| B | 8011 | 164 | 2.047185% |
| C | 8011 | 36 | 0.449382% |
| D | 8011 | 83 | 1.036075% |
Noise dominated data is calculated using 1-second bins in cleaned event files. If a bin has >2000 counts, and if more than 50% of those come from <1% of pixels, then it is considered to be noise-dominated and hence unusable.
| Quadrant | # 1 sec bins | Bins with >0 counts | Bins with >2000 counts | High rate bins dominated by noise | Noise dominated (total time) | Noise dominated (detector-on time) | Marked lightcurve |
|---|---|---|---|---|---|---|---|
| A | 8646 | 8014 | 86 | 86 | 0.99% | 1.07% | 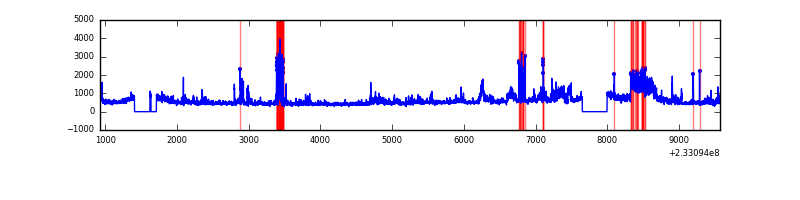 |
| B | 8646 | 8014 | 64 | 64 | 0.74% | 0.80% | 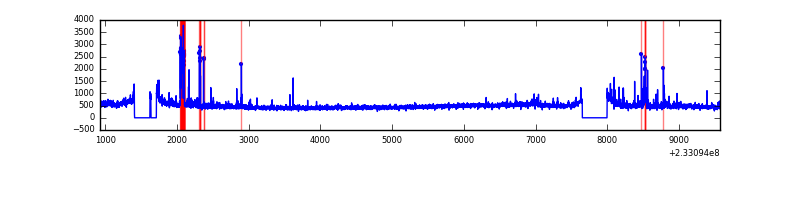 |
| C | 8646 | 8014 | 0 | 0 | 0.00% | 0.00% |  |
| D | 8646 | 8014 | 38 | 38 | 0.44% | 0.47% | 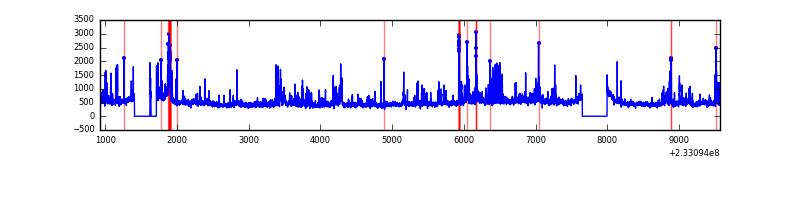 |
Top three noisy pixels from each quadrant. If the there are fewer than three noisy pixels in the level2.evt file, extra rows are filled as -1
| Pixel properties | Quadrant properties | ||||||
|---|---|---|---|---|---|---|---|
| Quadrant | DetID | PixID | Counts | Sigma | Mean | Median | Sigma |
| A | 8 | 5 | 1201517 | 6263.09 | 934 | 913 | 191.7 |
| A | 5 | 16 | 201223 | 1044.94 | 934 | 913 | 191.7 |
| A | 15 | 174 | 39324 | 200.38 | 934 | 913 | 191.7 |
| B | 10 | 16 | 206003 | 1134.56 | 939 | 917 | 180.8 |
| B | 0 | 219 | 132952 | 730.43 | 939 | 917 | 180.8 |
| B | 4 | 173 | 31199 | 167.52 | 939 | 917 | 180.8 |
| C | 9 | 68 | 12208 | 53.82 | 901 | 902 | 210.1 |
| C | 3 | 233 | 7189 | 29.93 | 901 | 902 | 210.1 |
| C | 13 | 61 | 7063 | 29.33 | 901 | 902 | 210.1 |
| D | 1 | 52 | 443576 | 1826.27 | 896 | 876 | 242.4 |
| D | 8 | 195 | 261720 | 1076.06 | 896 | 876 | 242.4 |
| D | 7 | 71 | 210533 | 864.9 | 896 | 876 | 242.4 |
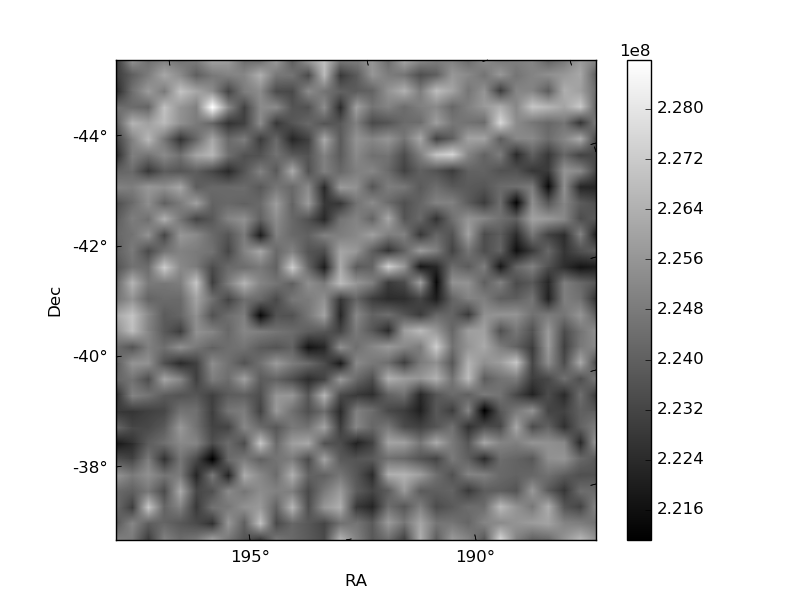
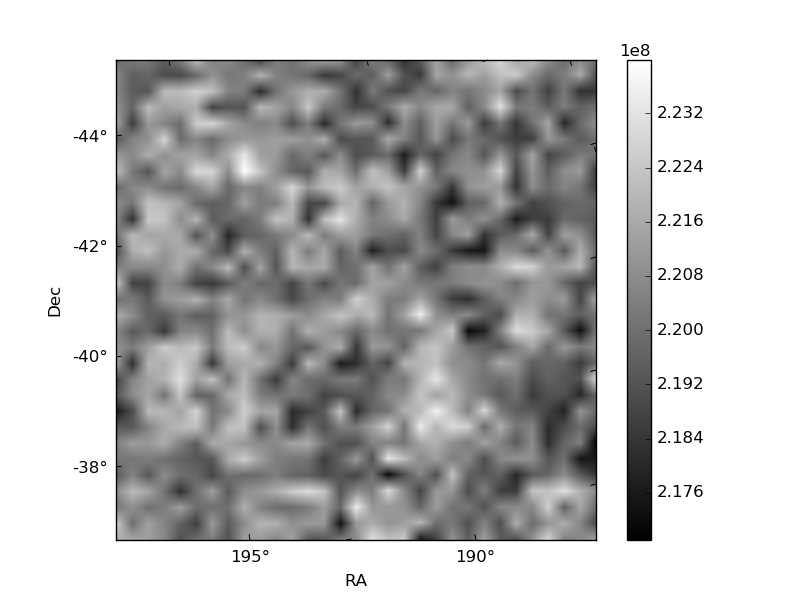
Histogram calculated using DETX and DETY for each event in the final _common_clean file
| Quadrant A |  |
 |
Quadrant B |
|---|---|---|---|
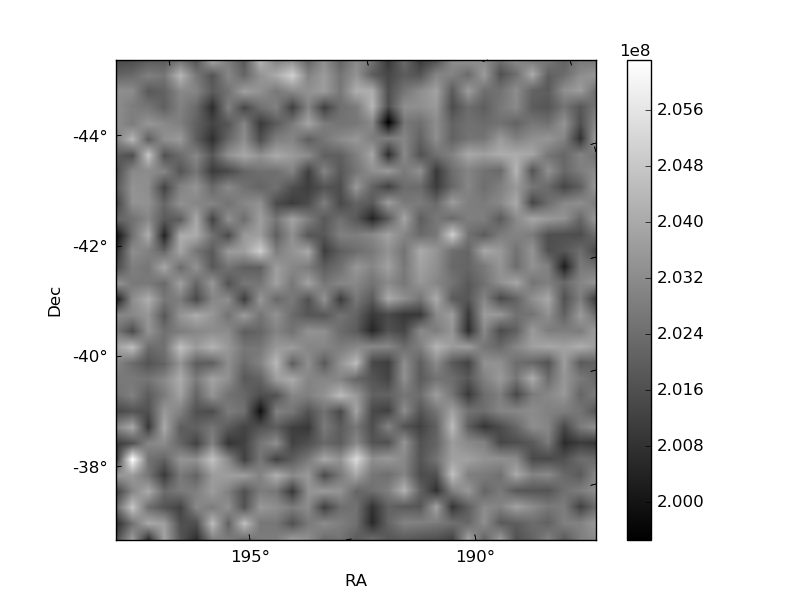
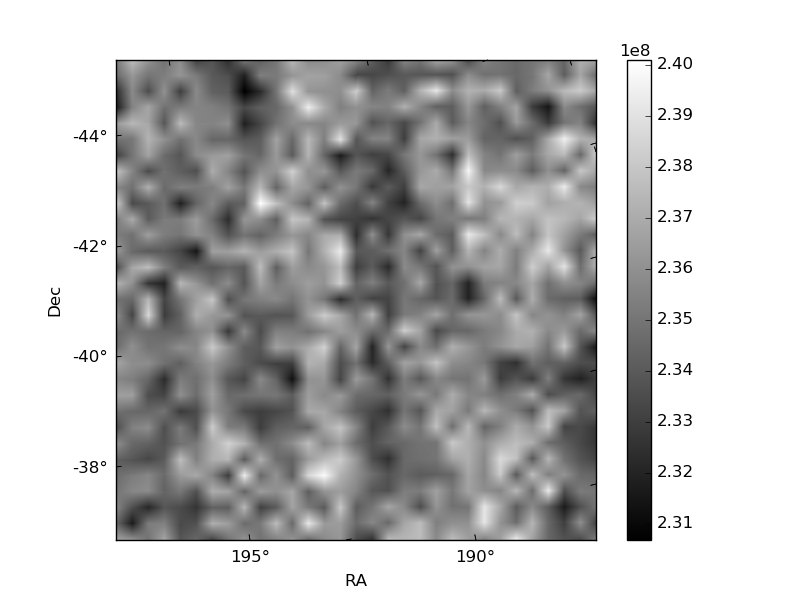
| Quadrant D | 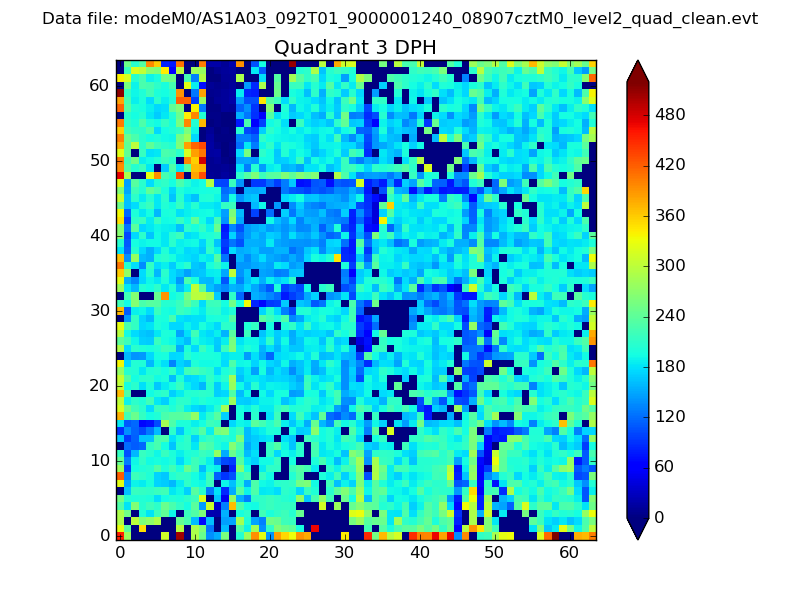 |
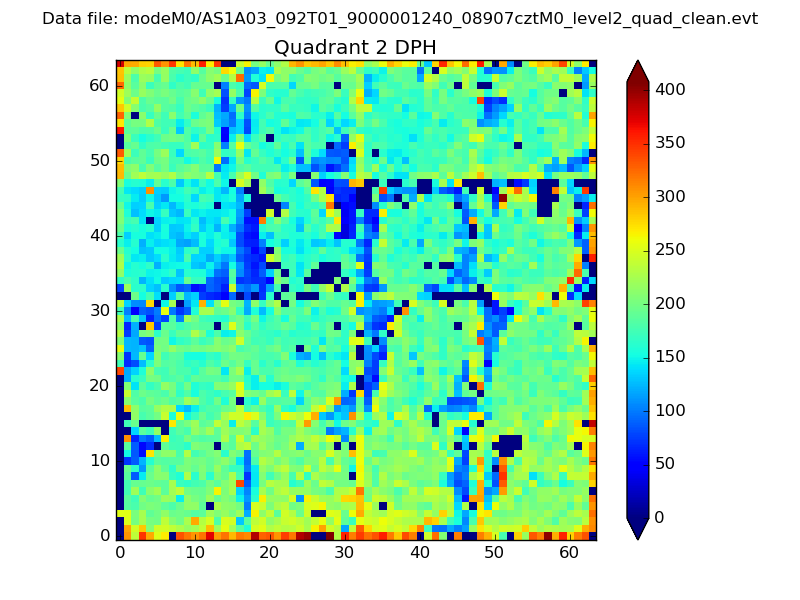 |
Quadrant C |
| Plot type | Count rate plots | Images |
|---|---|---|
| Comparison with Poisson distribution Blue bars denote a histogram of data divided into 1 sec bins. Red curve is a Poisson curve with rate = median count rate of data. |
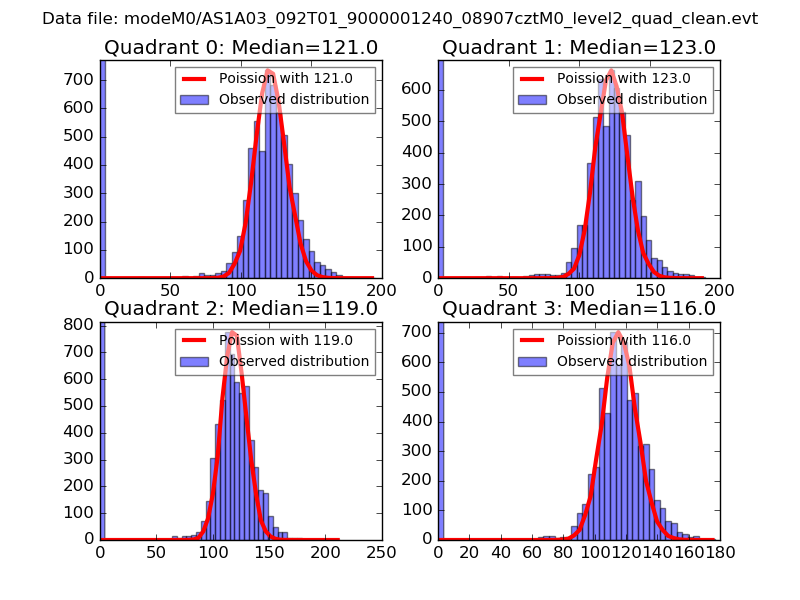 |
 |
| Quadrant-wise count rates Data is divided into 100 sec bins |
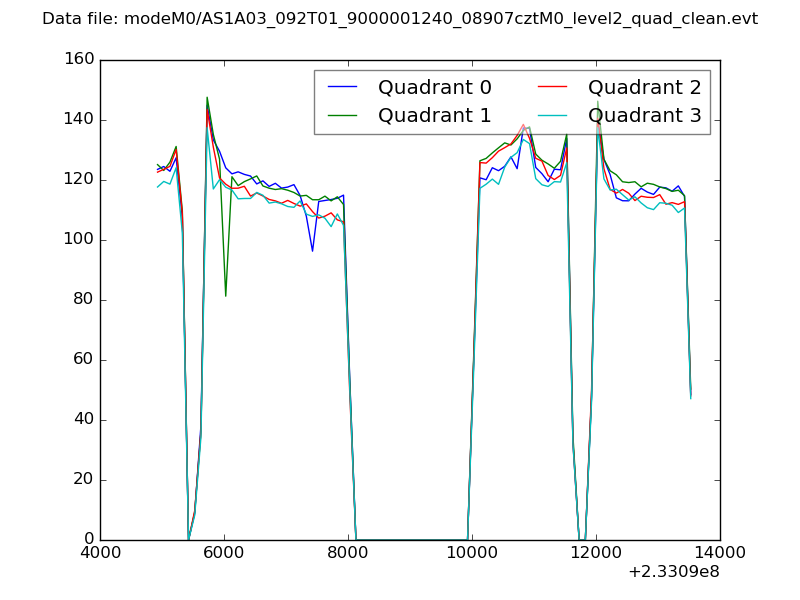 |
|
| Module-wise count rates for Quadrant A Data is divided into 100 sec bins |
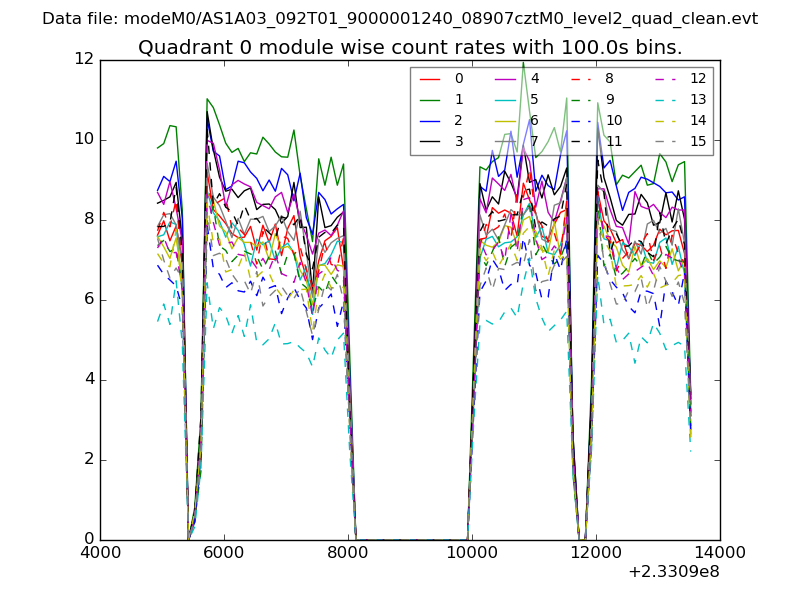 |
 |
| Module-wise count rates for Quadrant B Data is divided into 100 sec bins |
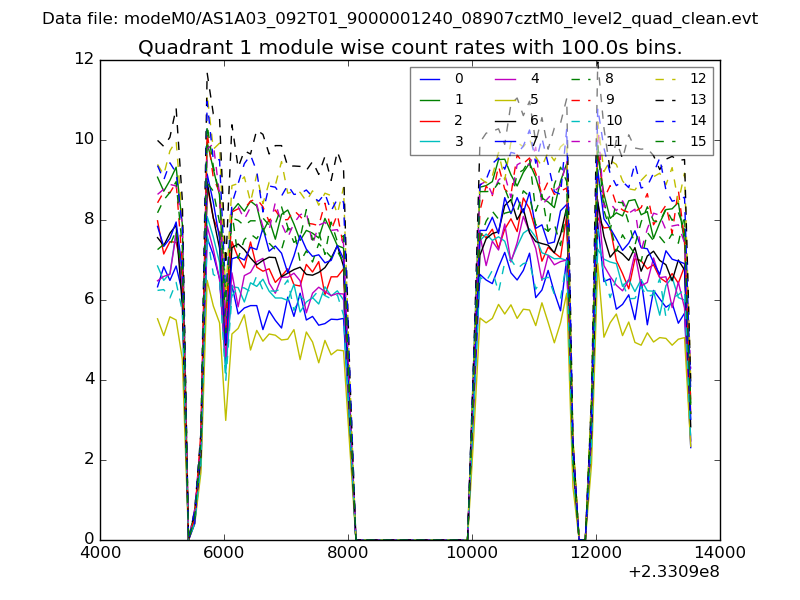 |
 |
| Module-wise count rates for Quadrant C Data is divided into 100 sec bins |
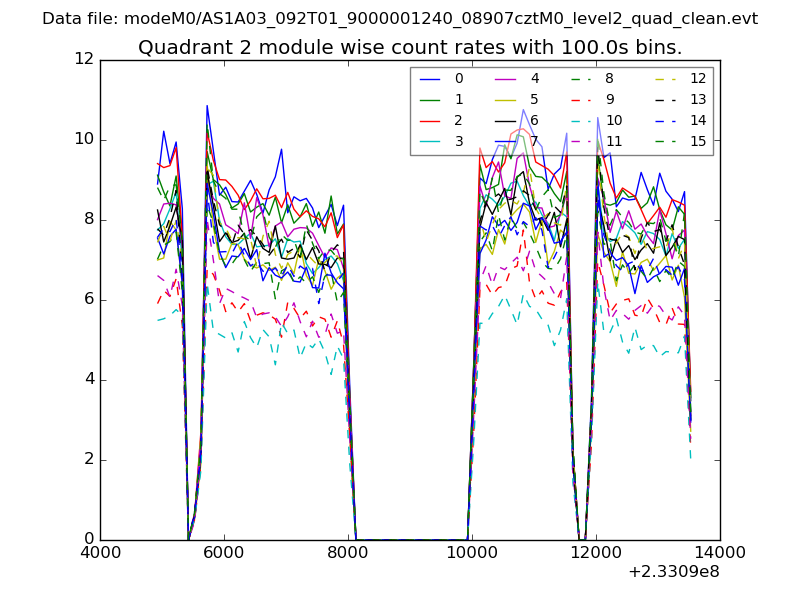 |
 |
| Module-wise count rates for Quadrant D Data is divided into 100 sec bins |
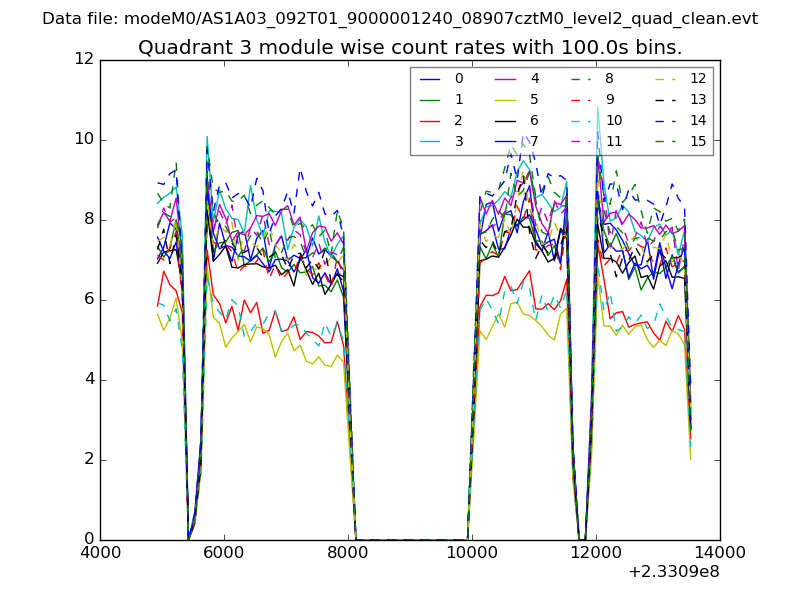 |
 |
| Parameter | Plot |
|---|---|
| CZT HV Monitor | 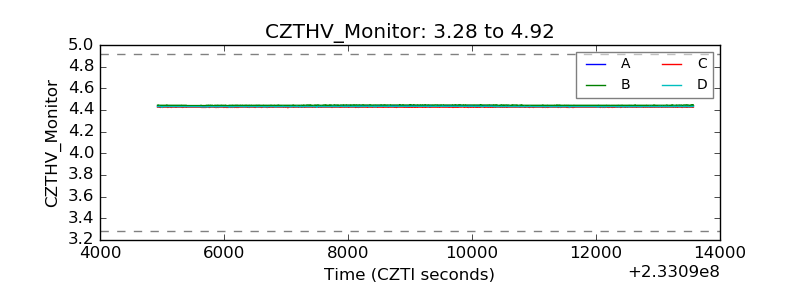 |
| D_VDD | 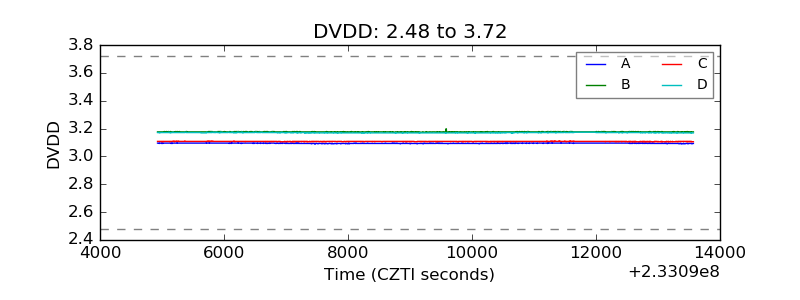 |
| Temperature 1 | 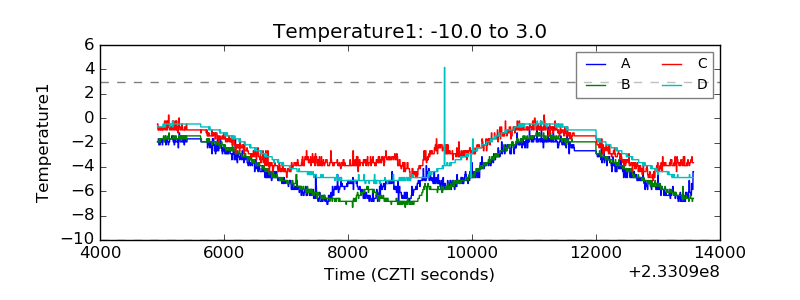 |
| Veto HV Monitor | 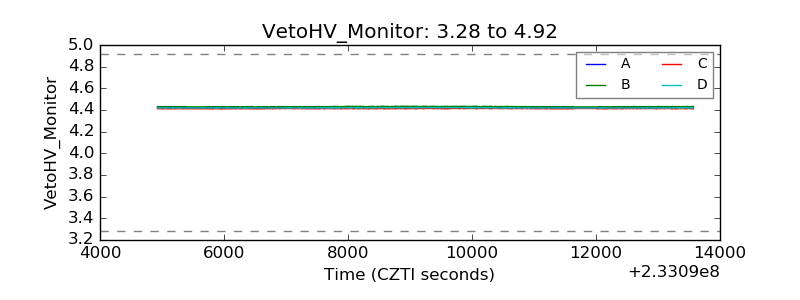 |
| Veto LLD | 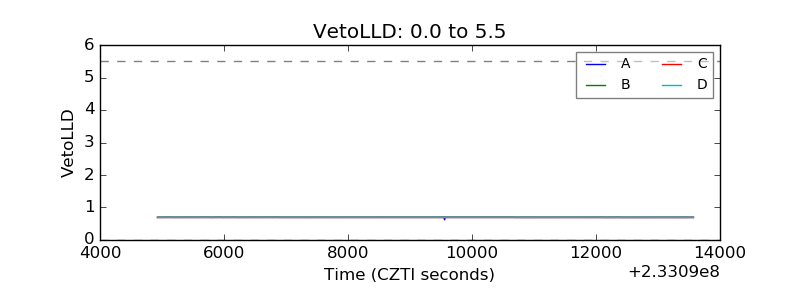 |
| Alpha Counter | 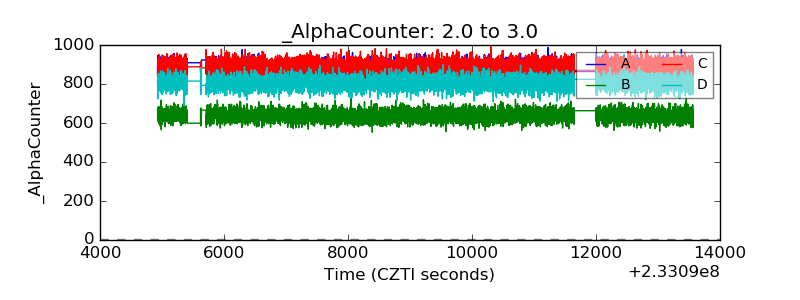 |
| _CPM_Rate | 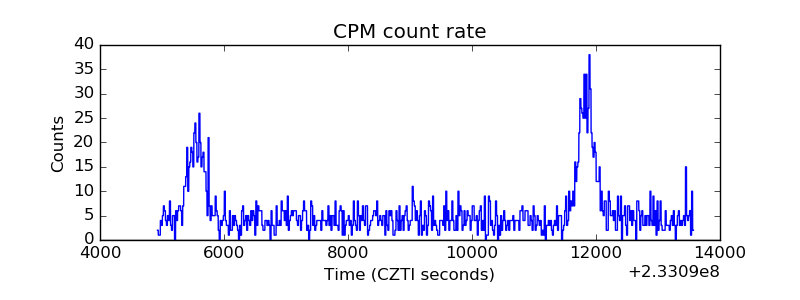 |
| CZT Counter | 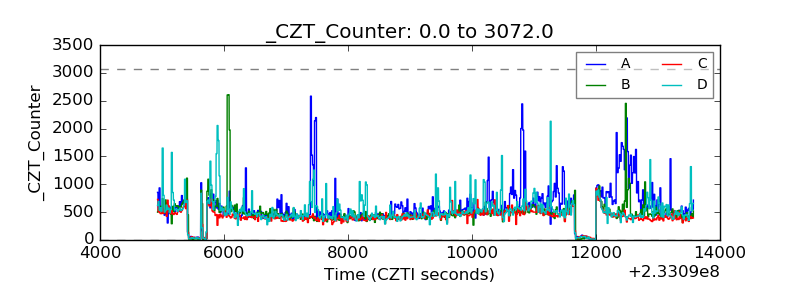 |
| +2.5 Volts monitor |  |
| +5 Volts monitor |  |
| _ROLL_ROT | 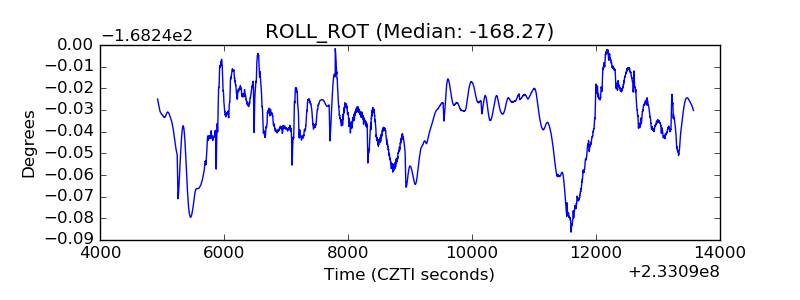 |
| _Roll_DEC | 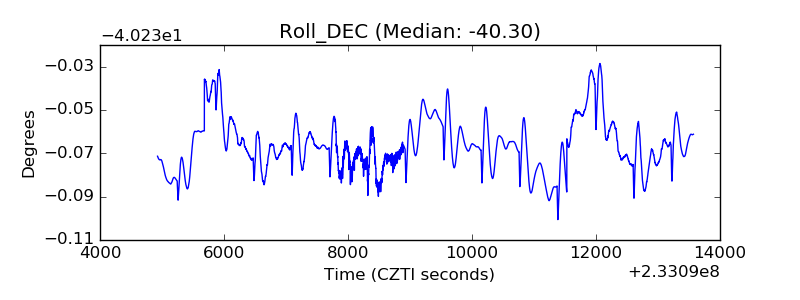 |
| _Roll_RA | 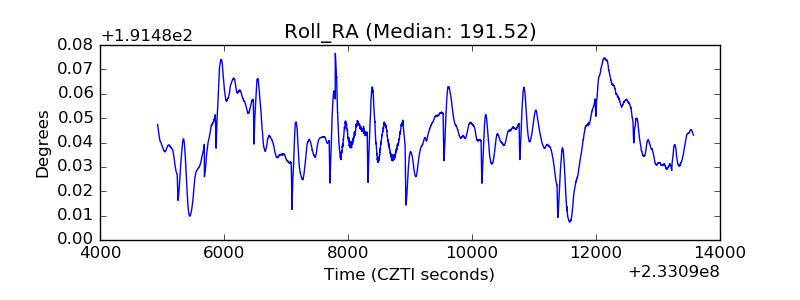 |
| Veto Counter | 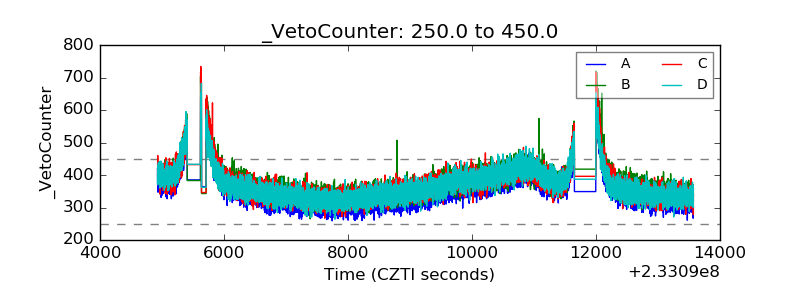 |