| Param | Original file | Final file |
|---|---|---|
| Filename | modeM0/AS1A03_092T01_9000001240_08909cztM0_level2.evt | modeM0/AS1A03_092T01_9000001240_08909cztM0_level2_quad_clean.evt |
| Size (bytes) | 936,817,920 | 171,371,520 |
| Size | 893.4 MB | 163.4 MB |
| Events in quadrant A | 7,689,081 | 1,077,624 |
| Events in quadrant B | 7,158,839 | 1,078,664 |
| Events in quadrant C | 5,850,028 | 1,063,799 |
| Events in quadrant D | 6,762,790 | 1,040,396 |
| Mode M9 | |||
|---|---|---|---|
| Quadrant | BADHDUFLAG | Total packets | Discarded packets |
| A | 0 | 16 | 0 |
| B | 0 | 16 | 0 |
| C | 0 | 16 | 0 |
| D | 0 | 16 | 0 |
| Mode SS | |||
|---|---|---|---|
| Quadrant | BADHDUFLAG | Total packets | Discarded packets |
| A | 0 | 274 | 0 |
| B | 0 | 274 | 0 |
| C | 0 | 274 | 0 |
| D | 0 | 274 | 0 |
| Mode M0 | |||
|---|---|---|---|
| Quadrant | BADHDUFLAG | Total packets | Discarded packets |
| A | 0 | 31547 | 4 |
| B | 0 | 30265 | 3 |
| C | 0 | 27232 | 3 |
| D | 0 | 29055 | 3 |
| Quadrant | Total seconds | Saturated seconds | Saturation percentage |
|---|---|---|---|
| A | 13463 | 132 | 0.980465% |
| B | 13463 | 292 | 2.168907% |
| C | 13463 | 32 | 0.237688% |
| D | 13463 | 58 | 0.430810% |
Noise dominated data is calculated using 1-second bins in cleaned event files. If a bin has >2000 counts, and if more than 50% of those come from <1% of pixels, then it is considered to be noise-dominated and hence unusable.
| Quadrant | # 1 sec bins | Bins with >0 counts | Bins with >2000 counts | High rate bins dominated by noise | Noise dominated (total time) | Noise dominated (detector-on time) | Marked lightcurve |
|---|---|---|---|---|---|---|---|
| A | 15043 | 13466 | 63 | 63 | 0.42% | 0.47% | 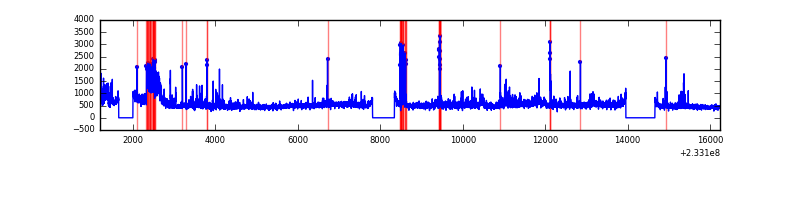 |
| B | 15043 | 13465 | 170 | 170 | 1.13% | 1.26% | 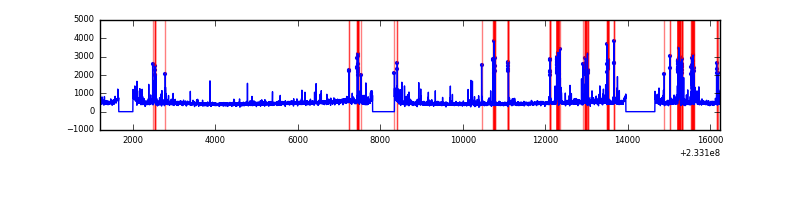 |
| C | 15043 | 13466 | 0 | 0 | 0.00% | 0.00% | 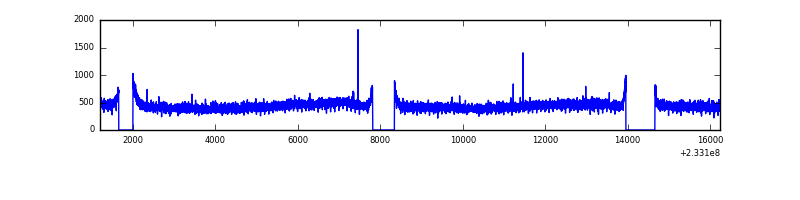 |
| D | 15043 | 13466 | 22 | 22 | 0.15% | 0.16% | 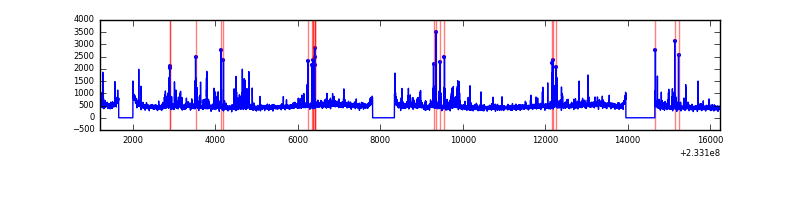 |
Top three noisy pixels from each quadrant. If the there are fewer than three noisy pixels in the level2.evt file, extra rows are filled as -1
| Pixel properties | Quadrant properties | ||||||
|---|---|---|---|---|---|---|---|
| Quadrant | DetID | PixID | Counts | Sigma | Mean | Median | Sigma |
| A | 8 | 5 | 1605268 | 5064.75 | 1549 | 1516 | 316.6 |
| A | 15 | 174 | 53604 | 164.5 | 1549 | 1516 | 316.6 |
| A | 5 | 16 | 28454 | 85.07 | 1549 | 1516 | 316.6 |
| B | 10 | 16 | 843873 | 2843.35 | 1550 | 1510 | 296.3 |
| B | 0 | 214 | 80698 | 267.3 | 1550 | 1510 | 296.3 |
| B | 0 | 219 | 76421 | 252.86 | 1550 | 1510 | 296.3 |
| C | 13 | 61 | 11446 | 28.72 | 1497 | 1503 | 346.2 |
| C | 1 | 3 | 5916 | 12.74 | 1497 | 1503 | 346.2 |
| C | 9 | 68 | 5482 | 11.49 | 1497 | 1503 | 346.2 |
| D | 8 | 195 | 476364 | 1187.7 | 1492 | 1453 | 399.9 |
| D | 1 | 52 | 178577 | 442.97 | 1492 | 1453 | 399.9 |
| D | 2 | 14 | 145847 | 361.11 | 1492 | 1453 | 399.9 |
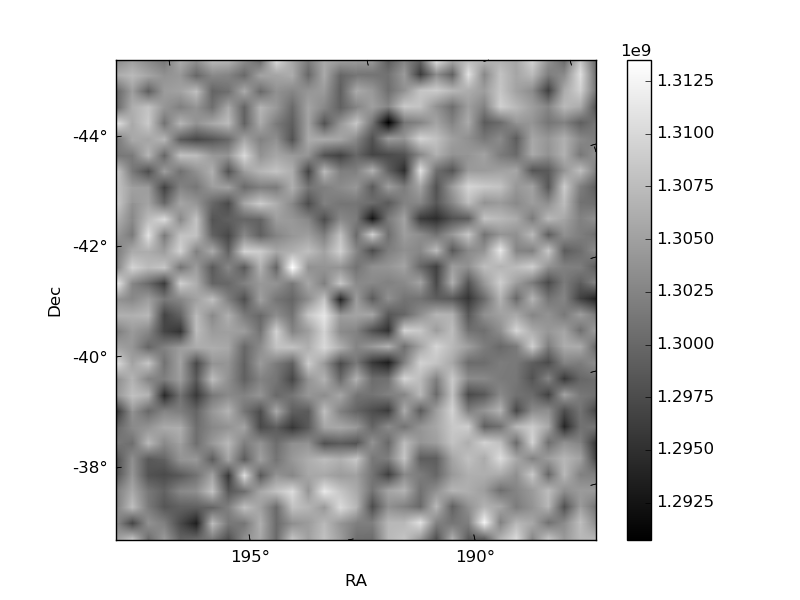
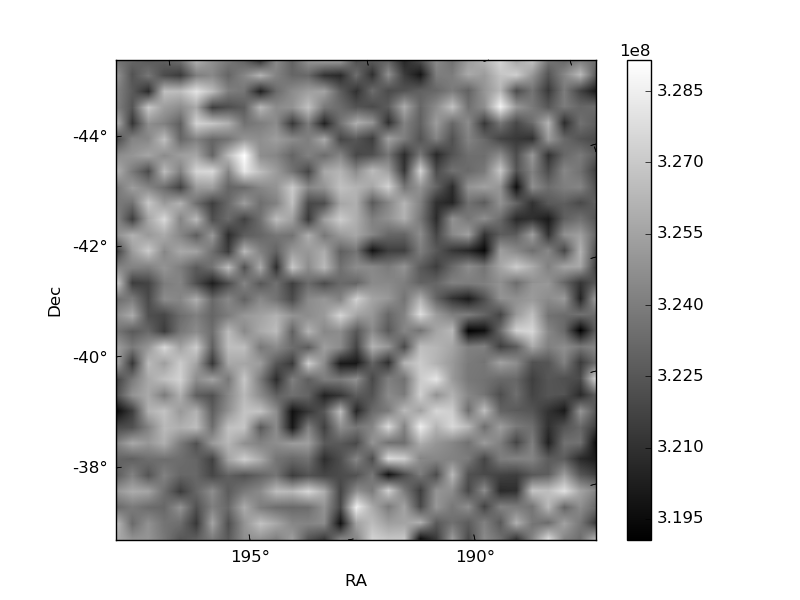
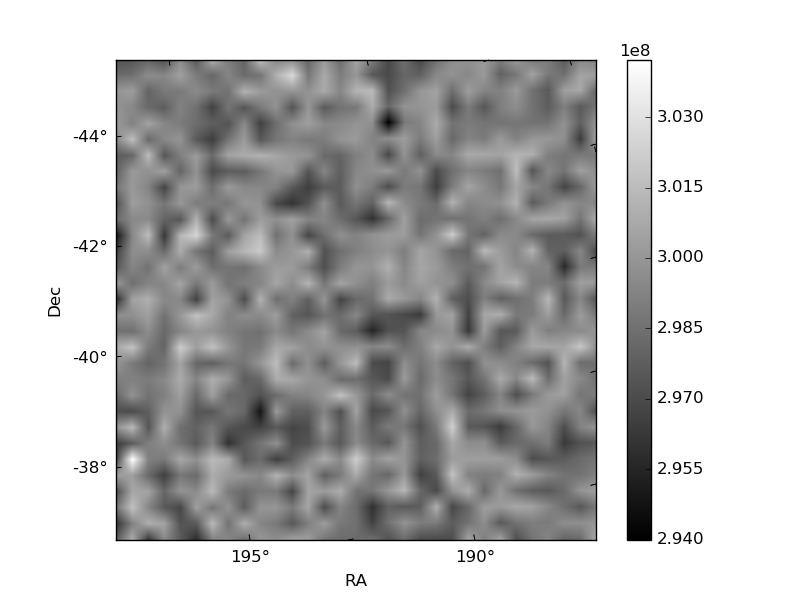
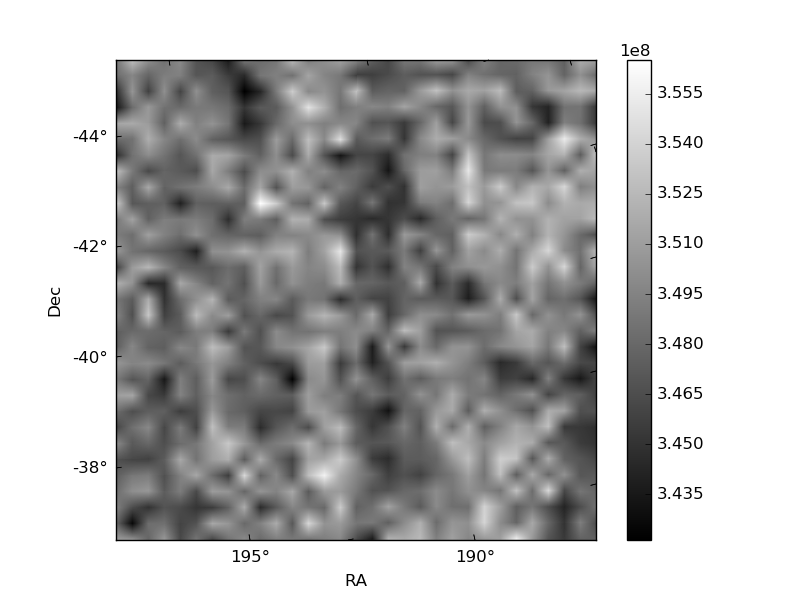
Histogram calculated using DETX and DETY for each event in the final _common_clean file
| Quadrant A | 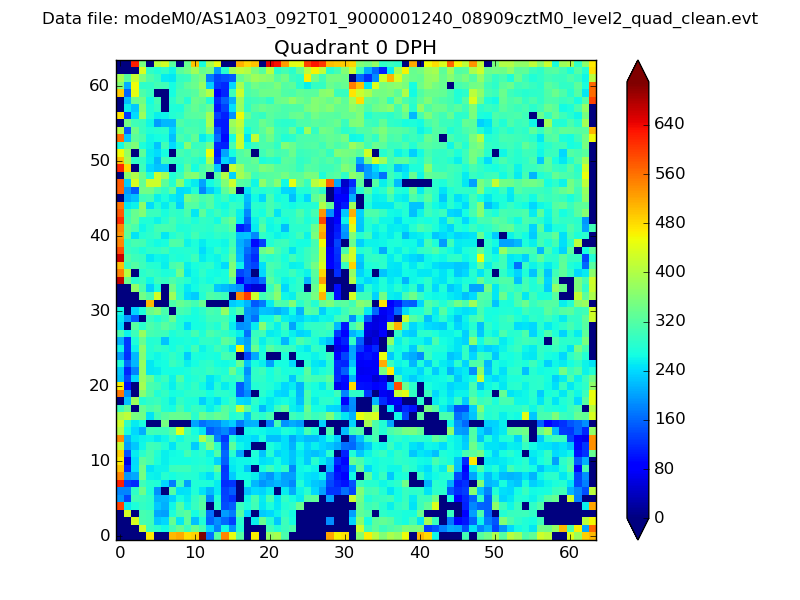 |
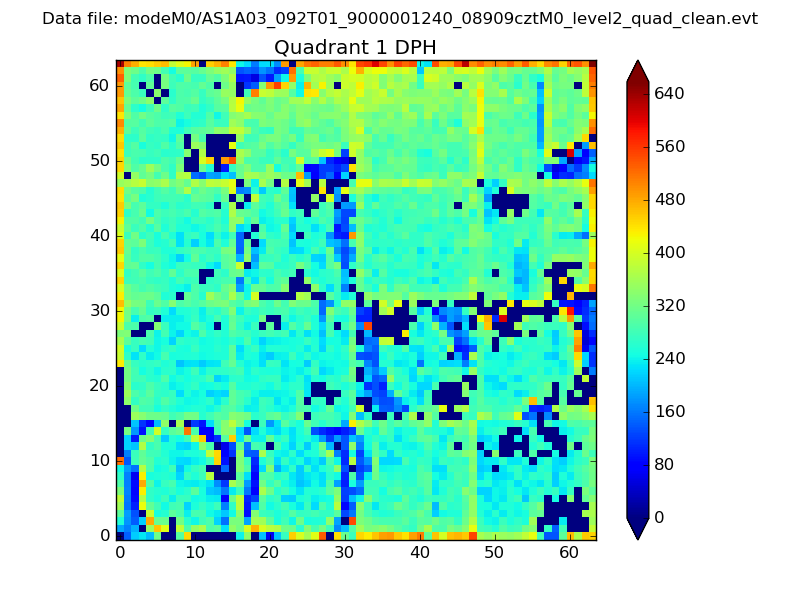 |
Quadrant B |
|---|---|---|---|
| Quadrant D | 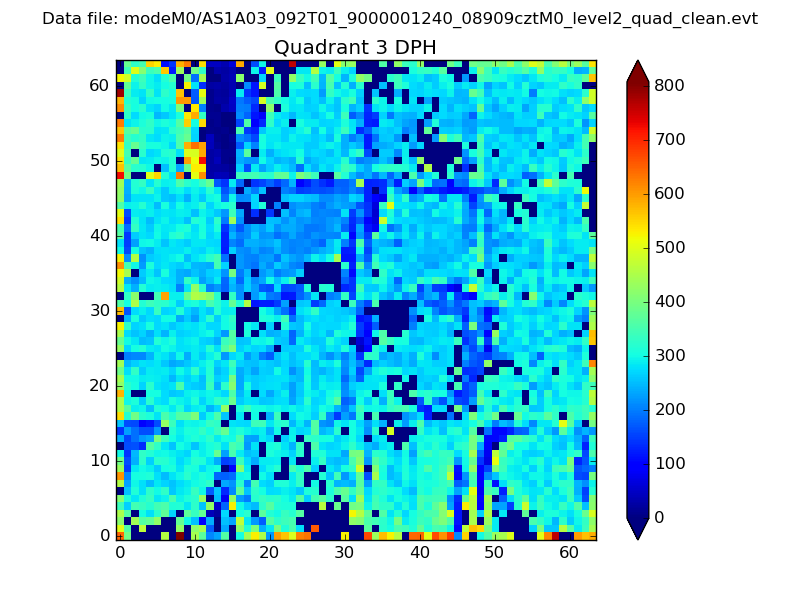 |
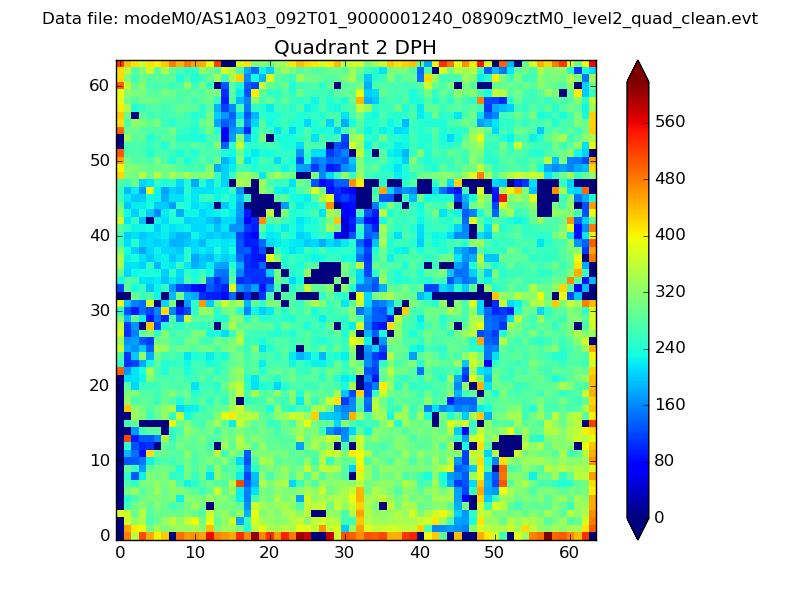 |
Quadrant C |
| Plot type | Count rate plots | Images |
|---|---|---|
| Comparison with Poisson distribution Blue bars denote a histogram of data divided into 1 sec bins. Red curve is a Poisson curve with rate = median count rate of data. |
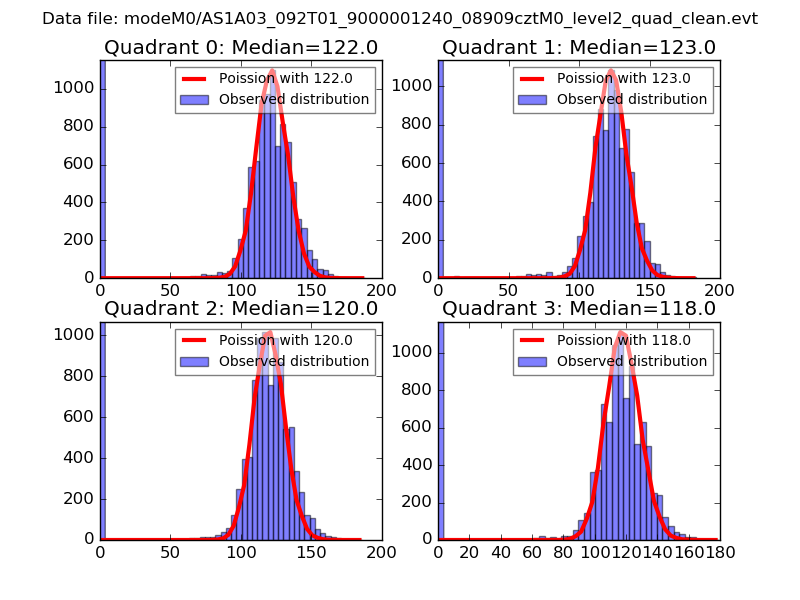 |
 |
| Quadrant-wise count rates Data is divided into 100 sec bins |
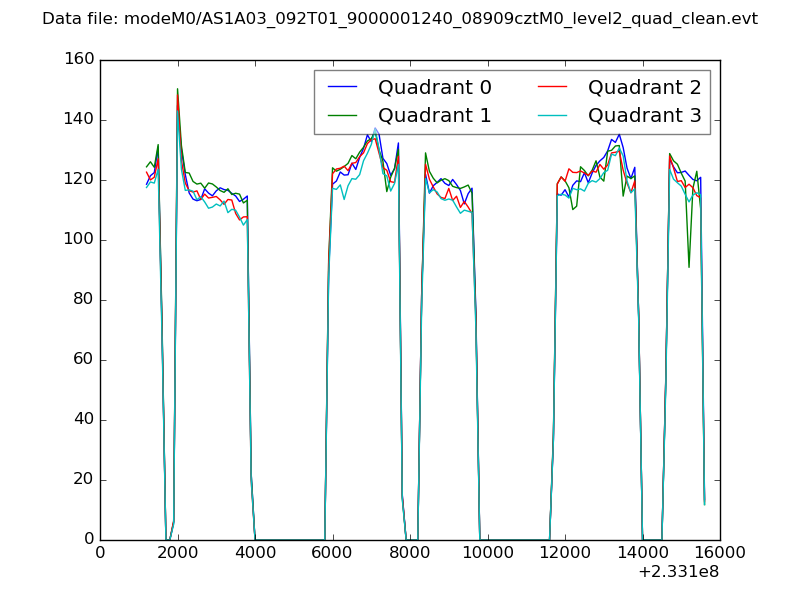 |
|
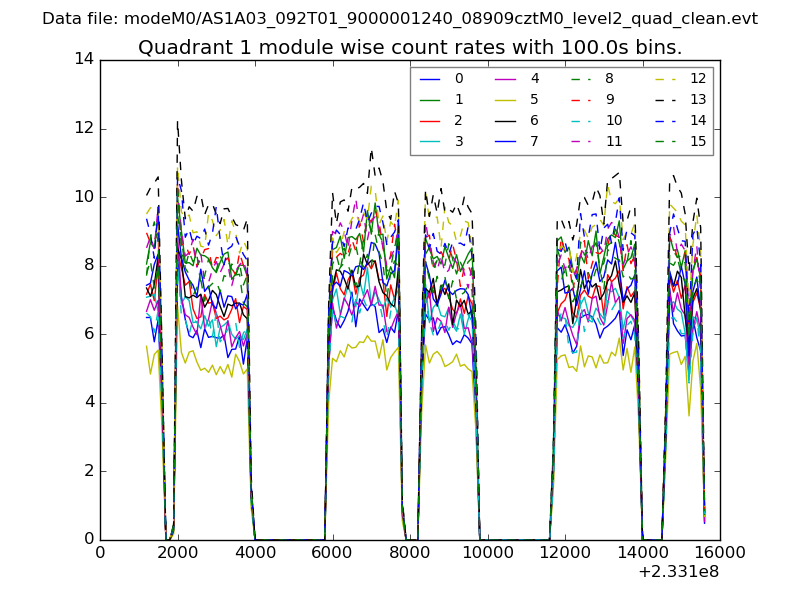
| Module-wise count rates for Quadrant A Data is divided into 100 sec bins |
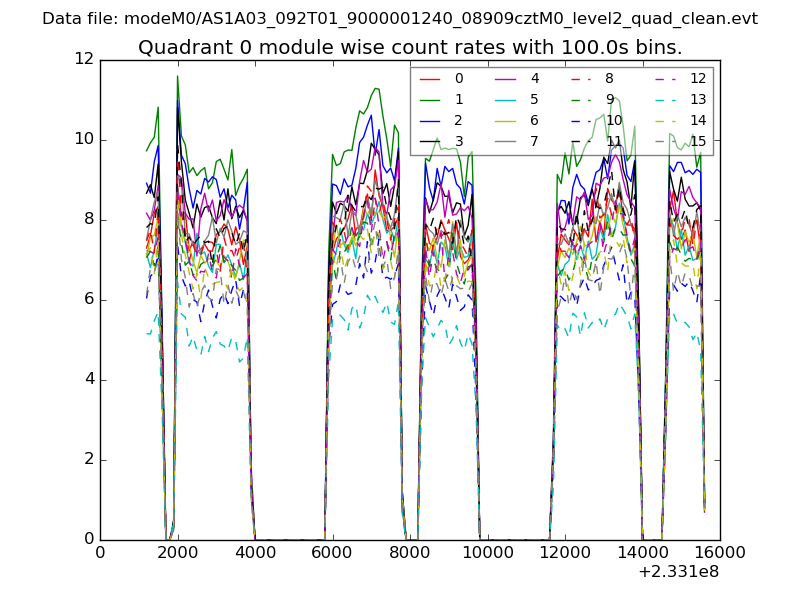 |
 |
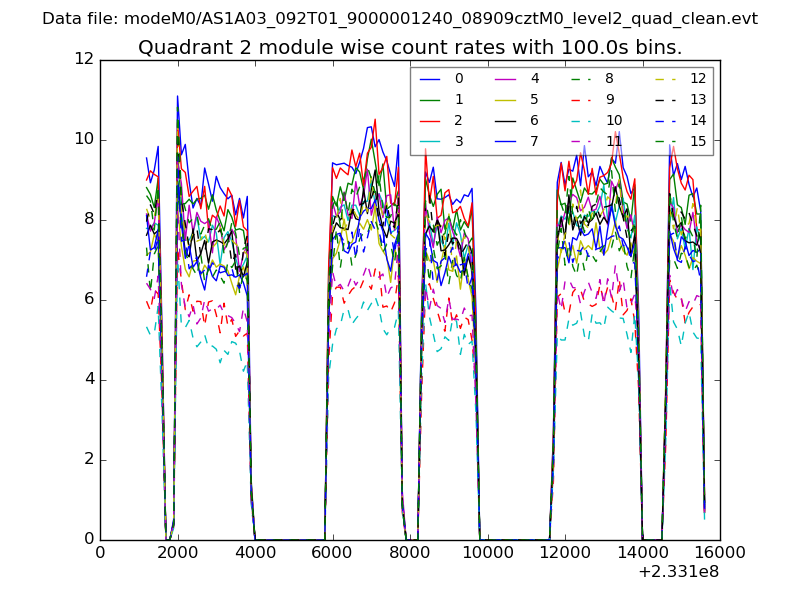
| Module-wise count rates for Quadrant B Data is divided into 100 sec bins |
 |
 |
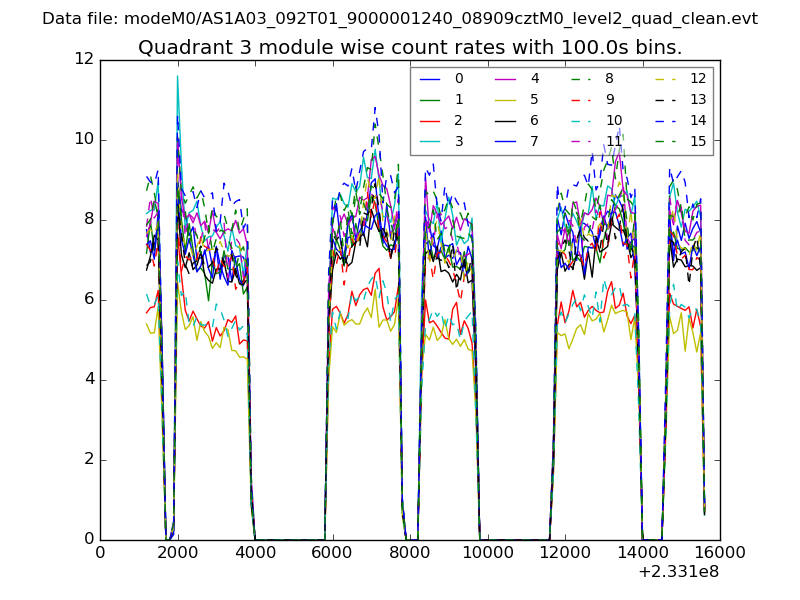
| Module-wise count rates for Quadrant C Data is divided into 100 sec bins |
 |
 |
| Module-wise count rates for Quadrant D Data is divided into 100 sec bins |
 |
 |
| Parameter | Plot |
|---|---|
| CZT HV Monitor | 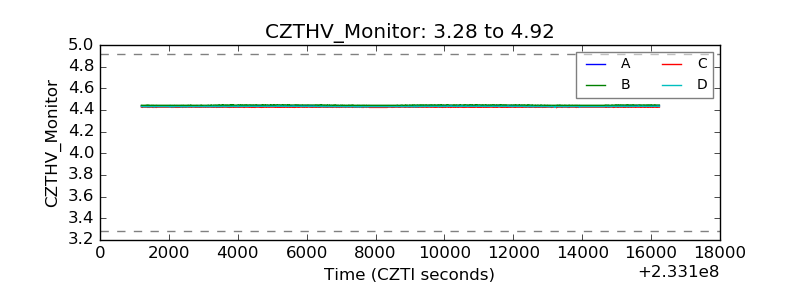 |
| D_VDD | 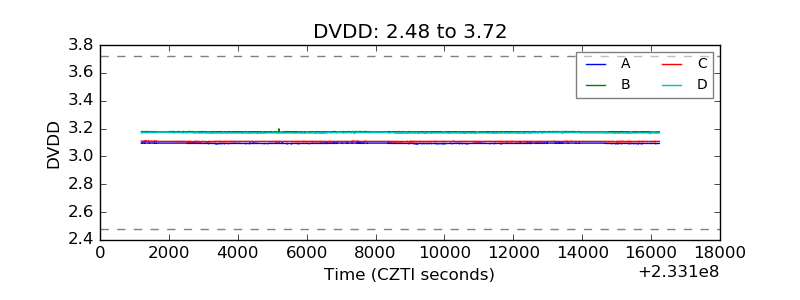 |
| Temperature 1 | 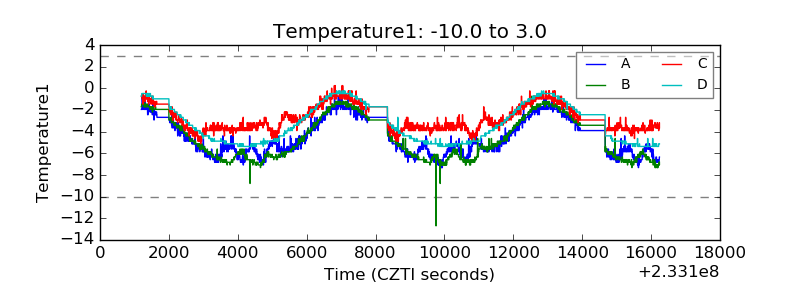 |
| Veto HV Monitor | 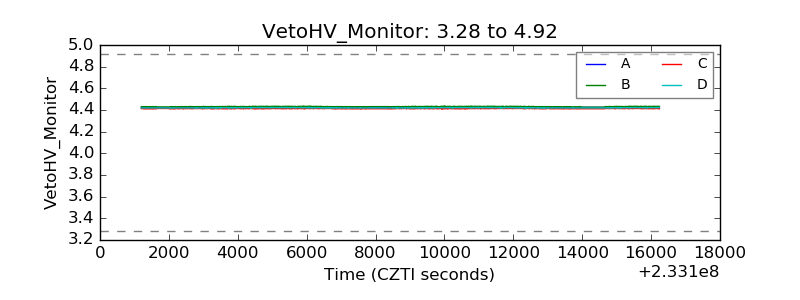 |
| Veto LLD | 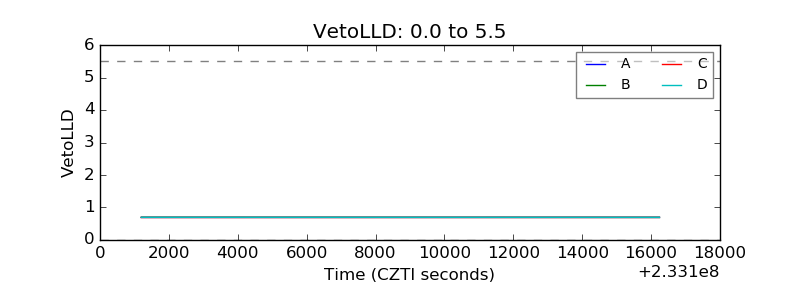 |
| Alpha Counter | 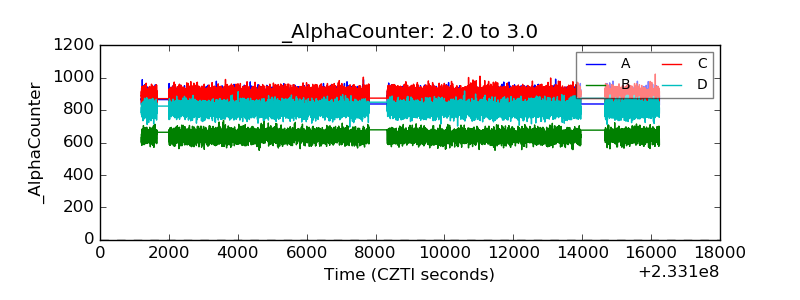 |
| _CPM_Rate | 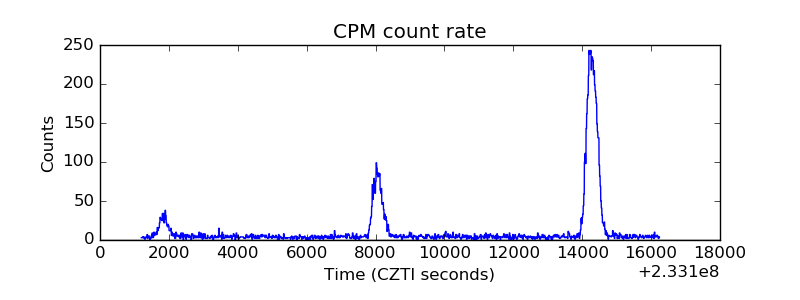 |
| CZT Counter | 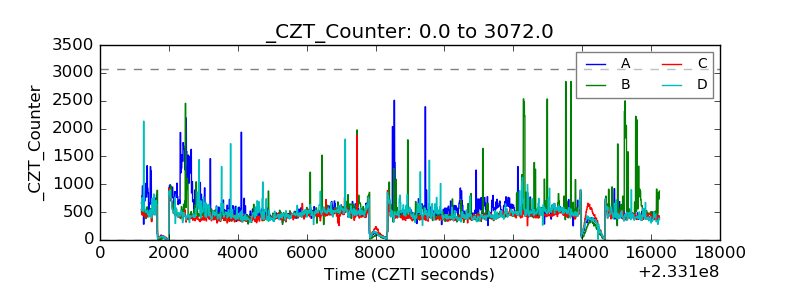 |
| +2.5 Volts monitor |  |
| +5 Volts monitor |  |
| _ROLL_ROT | 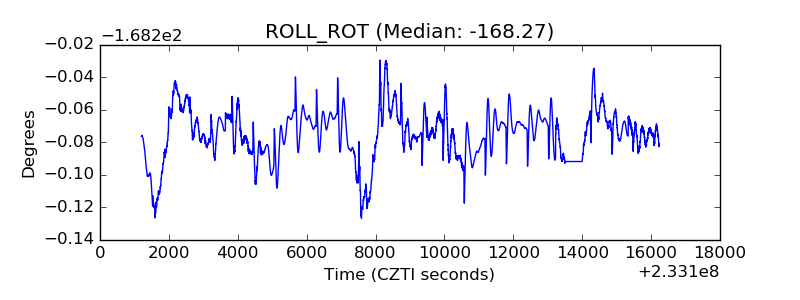 |
| _Roll_DEC |  |
| _Roll_RA | 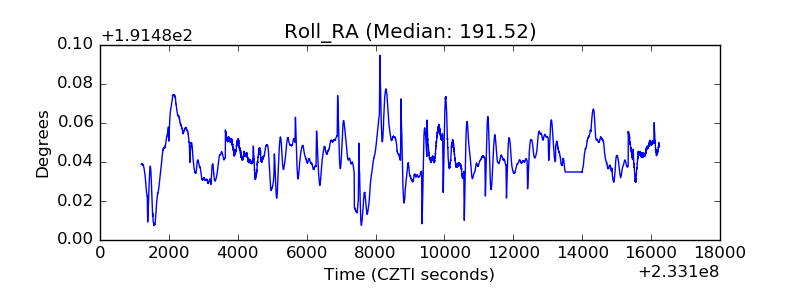 |
| Veto Counter | 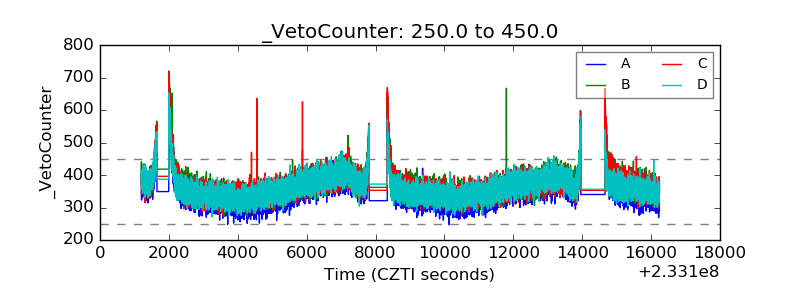 |