| Param | Original file | Final file |
|---|---|---|
| Filename | modeM0/AS1A03_092T01_9000001240_08911cztM0_level2.evt | modeM0/AS1A03_092T01_9000001240_08911cztM0_level2_quad_clean.evt |
| Size (bytes) | 488,900,160 | 73,627,200 |
| Size | 466.3 MB | 70.2 MB |
| Events in quadrant A | 3,716,887 | 445,881 |
| Events in quadrant B | 4,082,257 | 422,771 |
| Events in quadrant C | 3,131,222 | 442,210 |
| Events in quadrant D | 3,402,670 | 432,927 |
| Mode M9 | |||
|---|---|---|---|
| Quadrant | BADHDUFLAG | Total packets | Discarded packets |
| A | 0 | 18 | 0 |
| B | 0 | 18 | 0 |
| C | 0 | 18 | 0 |
| D | 0 | 18 | 0 |
| Mode SS | |||
|---|---|---|---|
| Quadrant | BADHDUFLAG | Total packets | Discarded packets |
| A | 0 | 144 | 0 |
| B | 0 | 144 | 0 |
| C | 0 | 144 | 0 |
| D | 0 | 144 | 0 |
| Mode M0 | |||
|---|---|---|---|
| Quadrant | BADHDUFLAG | Total packets | Discarded packets |
| A | 0 | 15519 | 3 |
| B | 0 | 16663 | 2 |
| C | 0 | 14182 | 2 |
| D | 0 | 14956 | 2 |
| Quadrant | Total seconds | Saturated seconds | Saturation percentage |
|---|---|---|---|
| A | 6965 | 91 | 1.306533% |
| B | 6965 | 409 | 5.872218% |
| C | 6965 | 56 | 0.804020% |
| D | 6965 | 64 | 0.918880% |
Noise dominated data is calculated using 1-second bins in cleaned event files. If a bin has >2000 counts, and if more than 50% of those come from <1% of pixels, then it is considered to be noise-dominated and hence unusable.
| Quadrant | # 1 sec bins | Bins with >0 counts | Bins with >2000 counts | High rate bins dominated by noise | Noise dominated (total time) | Noise dominated (detector-on time) | Marked lightcurve |
|---|---|---|---|---|---|---|---|
| A | 8820 | 6967 | 37 | 37 | 0.42% | 0.53% | 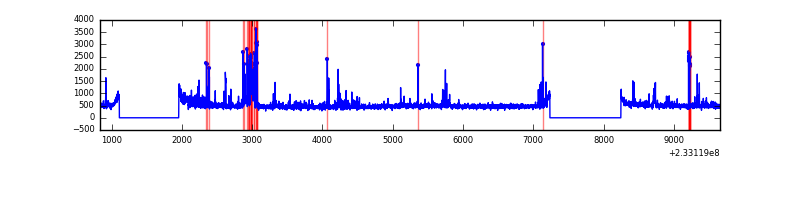 |
| B | 8819 | 6965 | 211 | 211 | 2.39% | 3.03% | 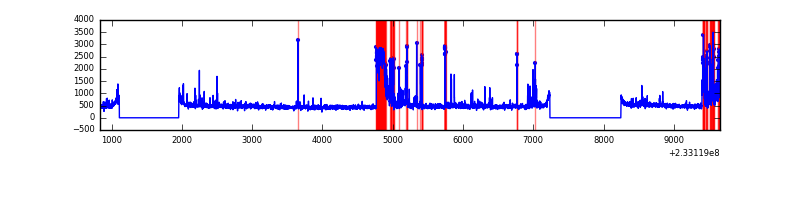 |
| C | 8820 | 6966 | 0 | 0 | 0.00% | 0.00% | 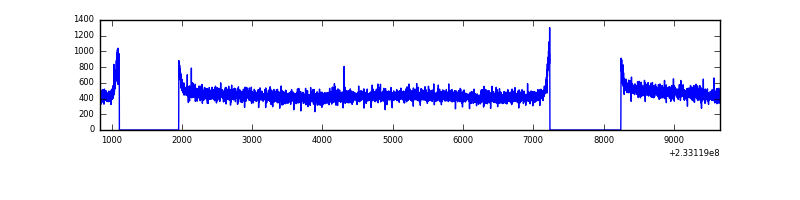 |
| D | 8820 | 6966 | 10 | 10 | 0.11% | 0.14% | 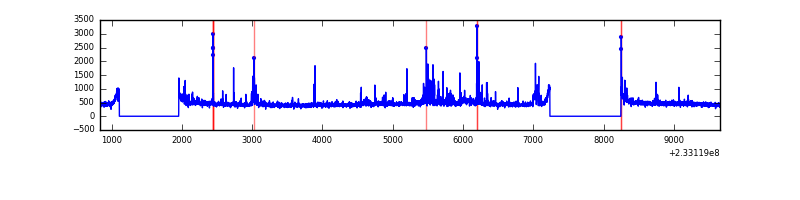 |
Top three noisy pixels from each quadrant. If the there are fewer than three noisy pixels in the level2.evt file, extra rows are filled as -1
| Pixel properties | Quadrant properties | ||||||
|---|---|---|---|---|---|---|---|
| Quadrant | DetID | PixID | Counts | Sigma | Mean | Median | Sigma |
| A | 8 | 5 | 326847 | 1954.58 | 821 | 802 | 166.8 |
| A | 5 | 16 | 165231 | 985.72 | 821 | 802 | 166.8 |
| A | 15 | 174 | 40235 | 236.39 | 821 | 802 | 166.8 |
| B | 10 | 16 | 880005 | 5739.47 | 803 | 784 | 153.2 |
| B | 0 | 214 | 27059 | 171.52 | 803 | 784 | 153.2 |
| B | 0 | 219 | 21611 | 135.96 | 803 | 784 | 153.2 |
| C | 13 | 61 | 5961 | 27.62 | 803 | 805 | 186.7 |
| C | 3 | 202 | 2060 | 6.72 | 803 | 805 | 186.7 |
| C | -1 | -1 | -1 | -1.0 | 803 | 805 | 186.7 |
| D | 1 | 52 | 155515 | 757.32 | 797 | 779 | 204.3 |
| D | 2 | 14 | 65799 | 318.22 | 797 | 779 | 204.3 |
| D | 8 | 195 | 44630 | 214.62 | 797 | 779 | 204.3 |
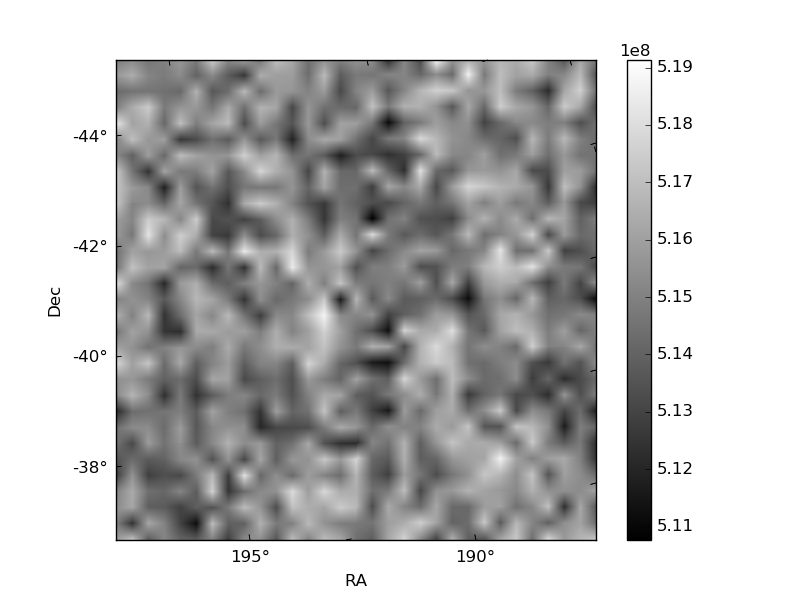
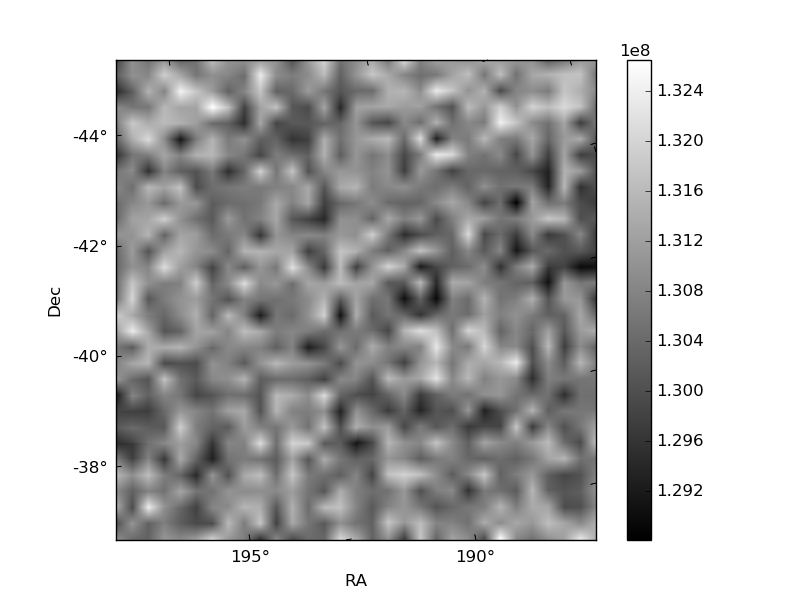
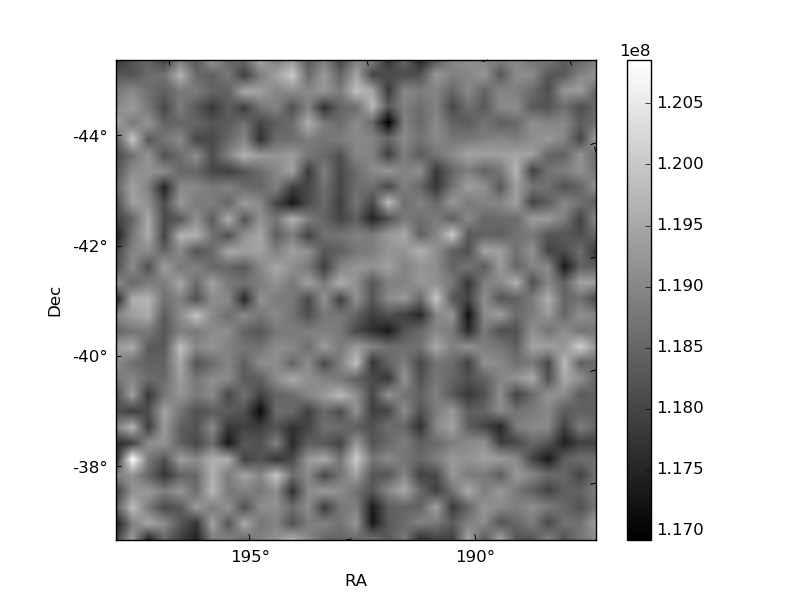
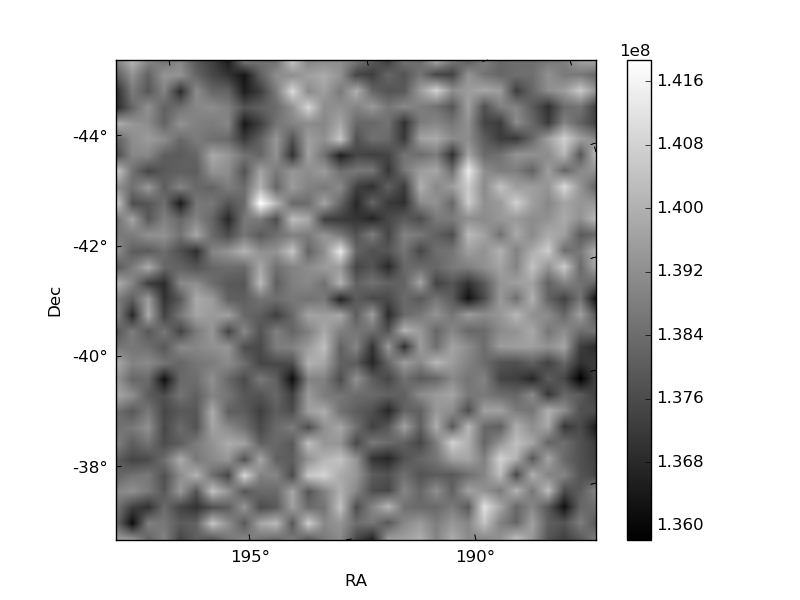
Histogram calculated using DETX and DETY for each event in the final _common_clean file
| Quadrant A | 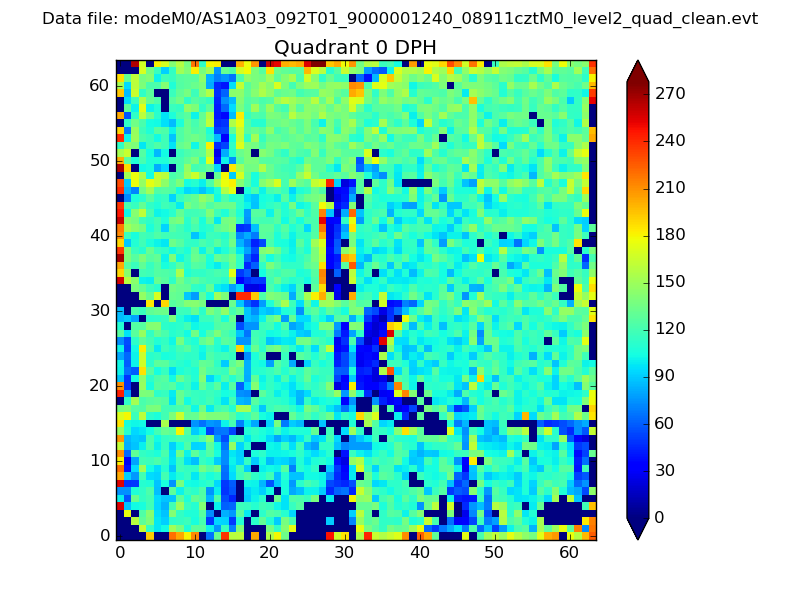 |
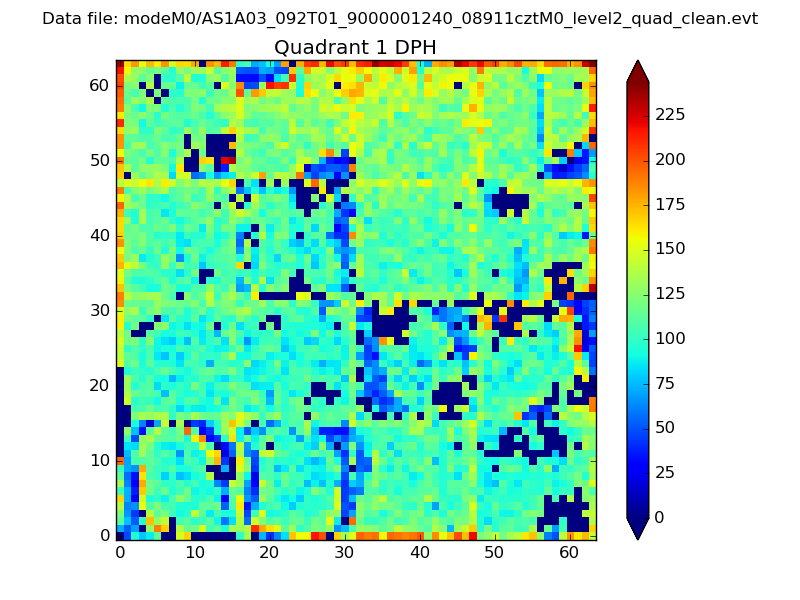 |
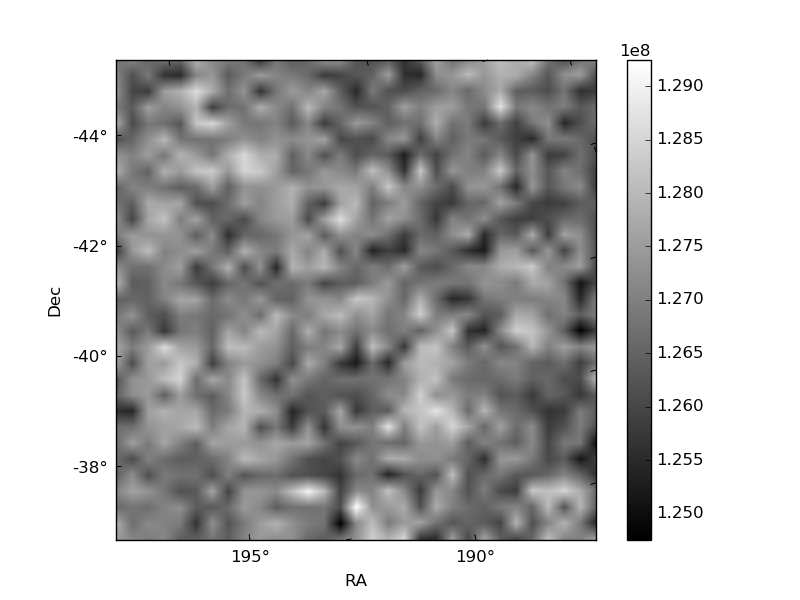
Quadrant B |
|---|---|---|---|
| Quadrant D | 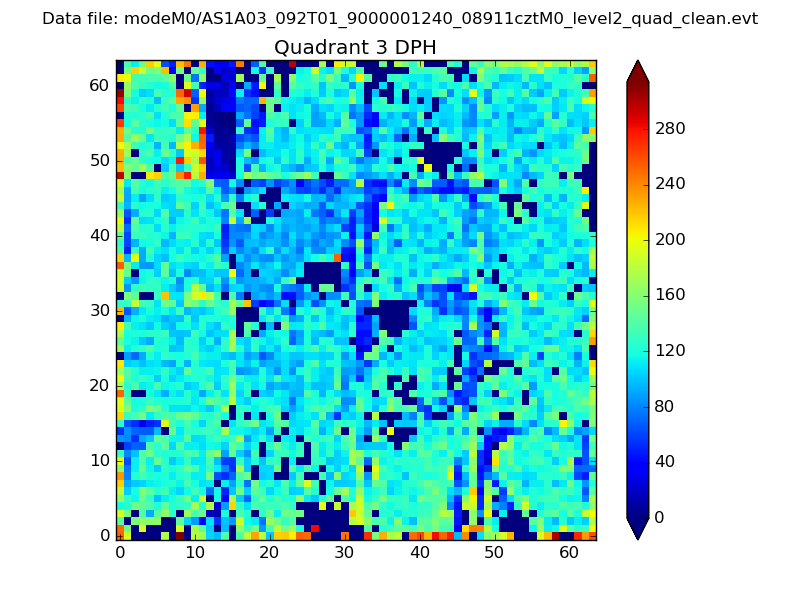 |
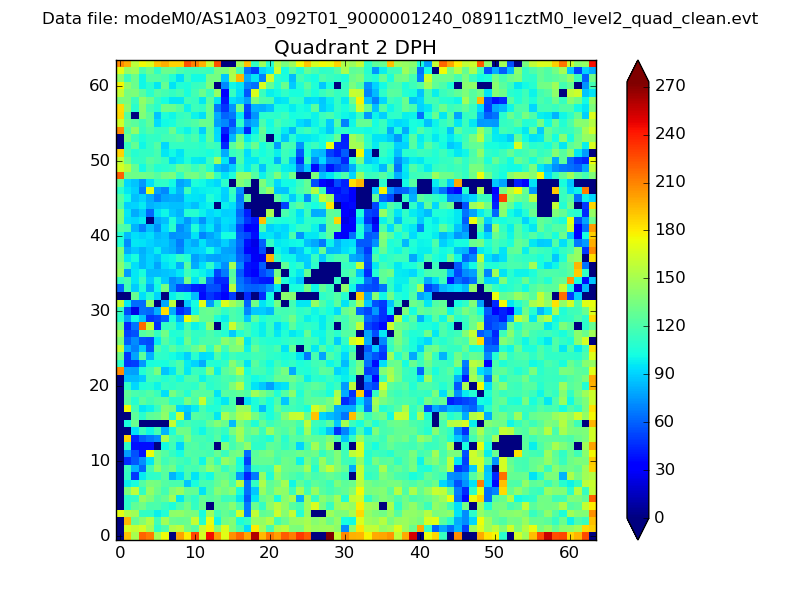 |
Quadrant C |
| Plot type | Count rate plots | Images |
|---|---|---|
| Comparison with Poisson distribution Blue bars denote a histogram of data divided into 1 sec bins. Red curve is a Poisson curve with rate = median count rate of data. |
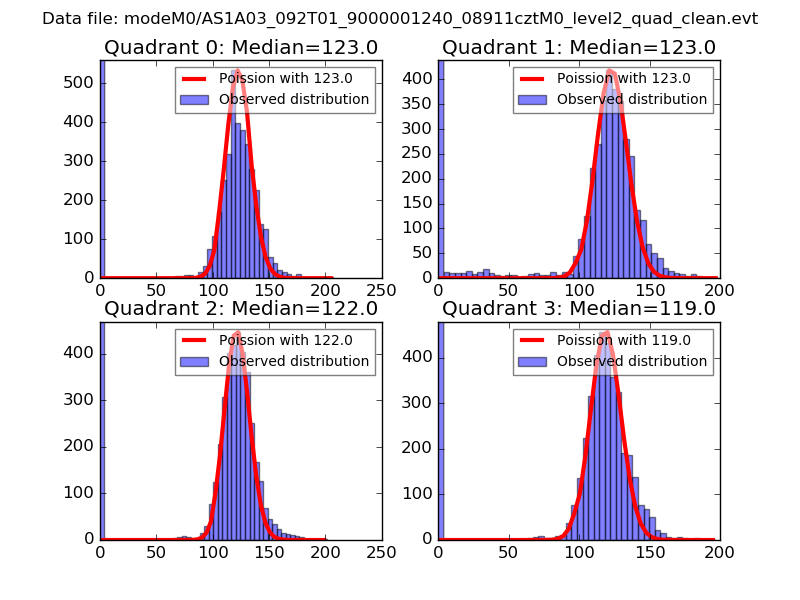 |
 |
| Quadrant-wise count rates Data is divided into 100 sec bins |
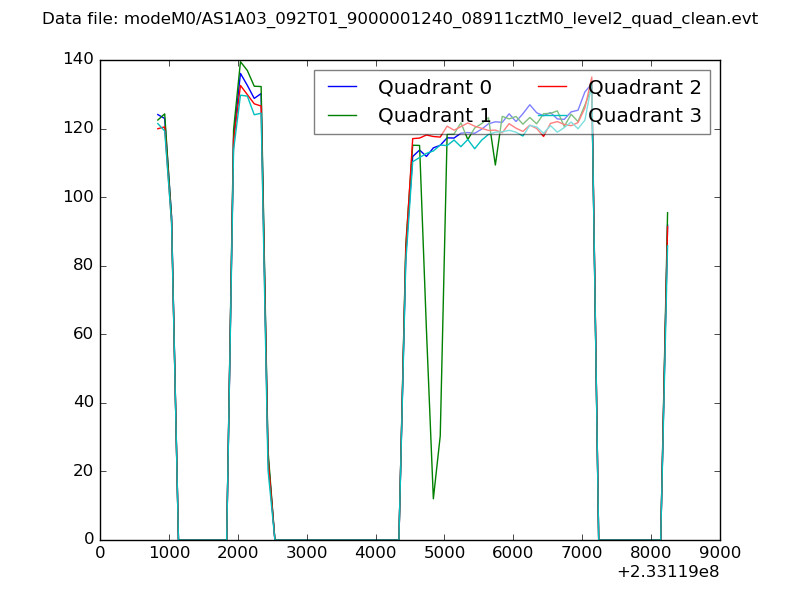 |
|
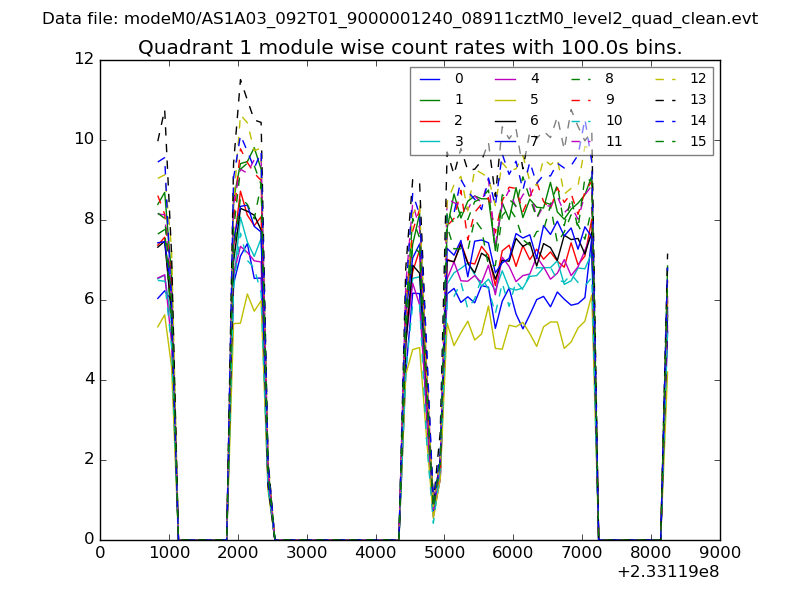
| Module-wise count rates for Quadrant A Data is divided into 100 sec bins |
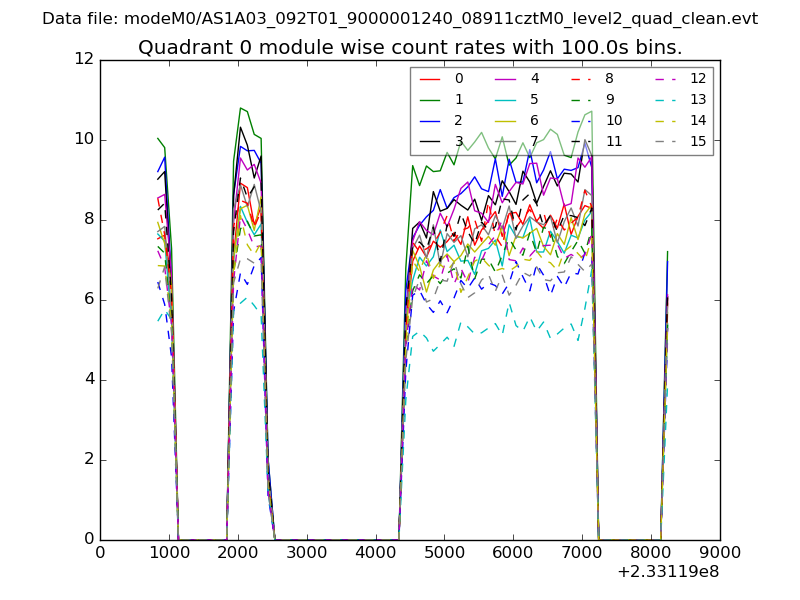 |
 |
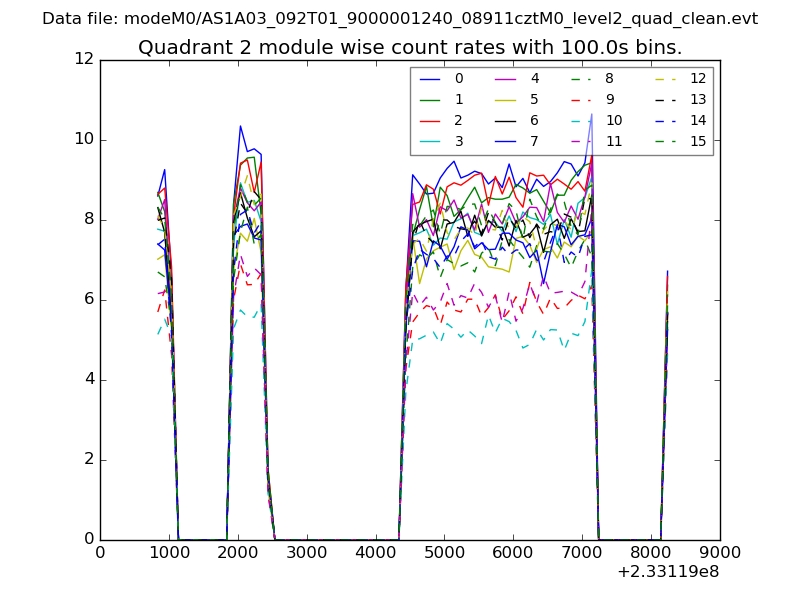
| Module-wise count rates for Quadrant B Data is divided into 100 sec bins |
 |
 |
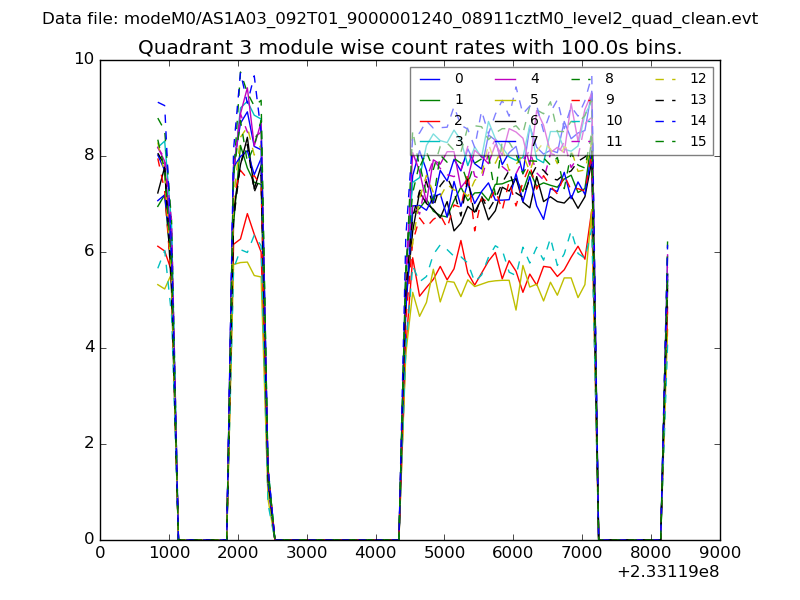
| Module-wise count rates for Quadrant C Data is divided into 100 sec bins |
 |
 |
| Module-wise count rates for Quadrant D Data is divided into 100 sec bins |
 |
 |
| Parameter | Plot |
|---|---|
| CZT HV Monitor | 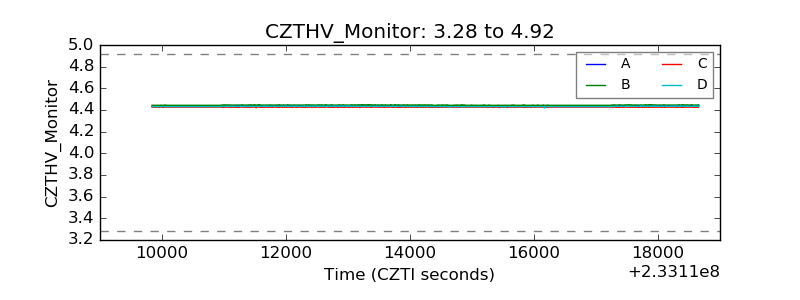 |
| D_VDD |  |
| Temperature 1 | 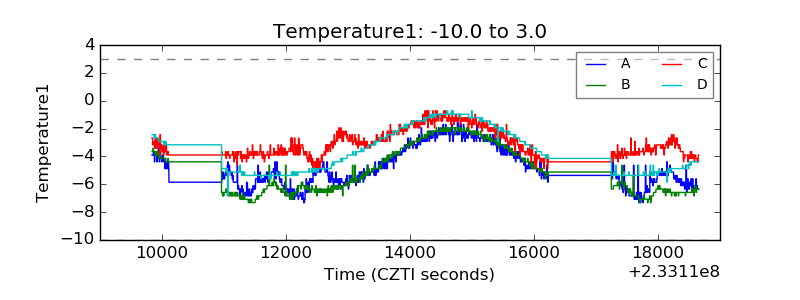 |
| Veto HV Monitor | 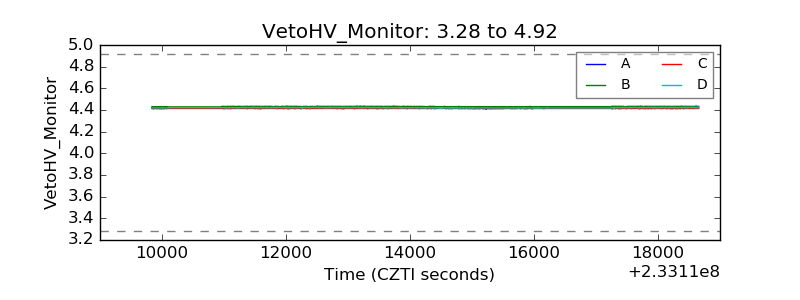 |
| Veto LLD | 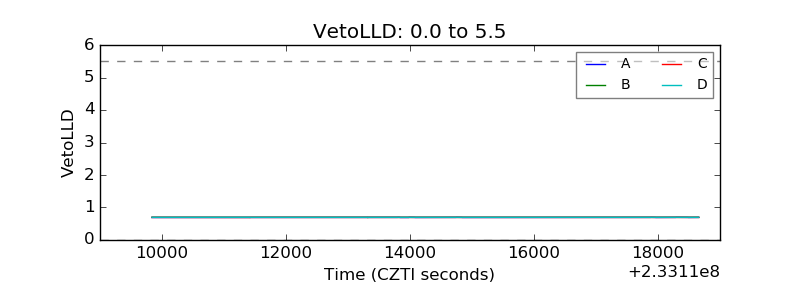 |
| Alpha Counter | 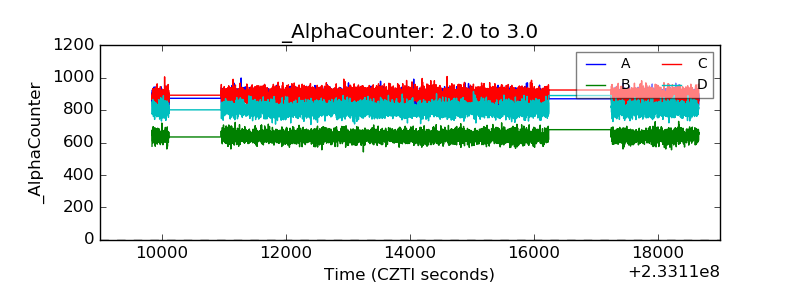 |
| _CPM_Rate | 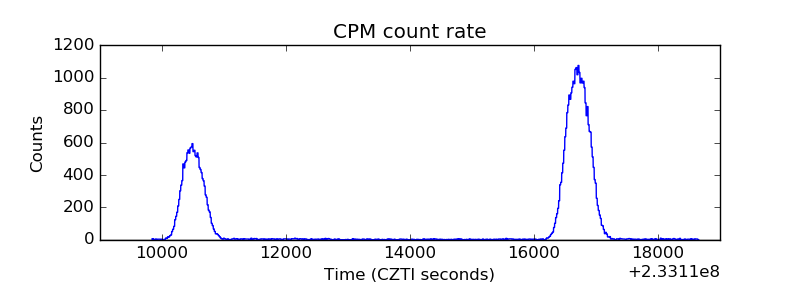 |
| CZT Counter | 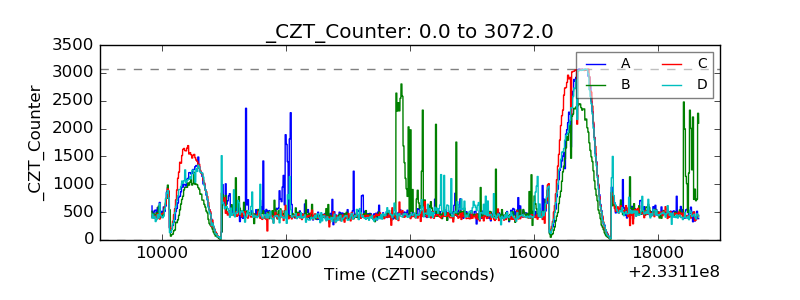 |
| +2.5 Volts monitor |  |
| +5 Volts monitor |  |
| _ROLL_ROT | 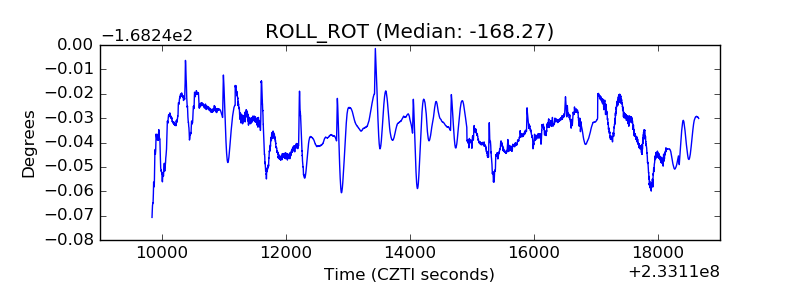 |
| _Roll_DEC |  |
| _Roll_RA | 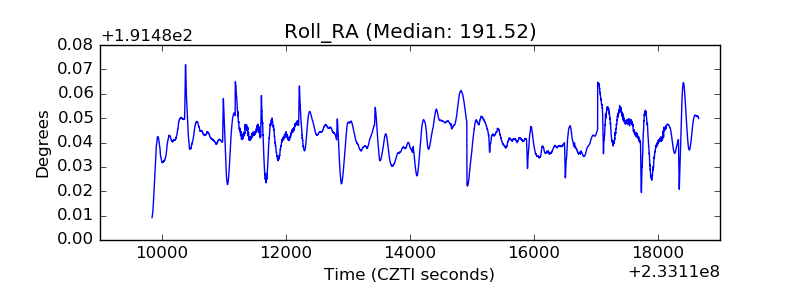 |
| Veto Counter | 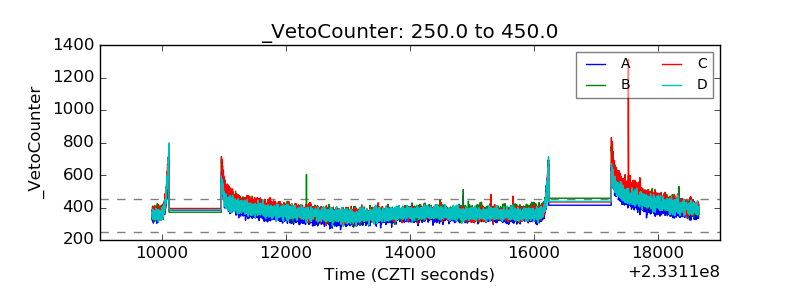 |