| Param | Original file | Final file |
|---|---|---|
| Filename | modeM0/AS1A03_092T01_9000001240_08913cztM0_level2.evt | modeM0/AS1A03_092T01_9000001240_08913cztM0_level2_quad_clean.evt |
| Size (bytes) | 469,123,200 | 65,707,200 |
| Size | 447.4 MB | 62.7 MB |
| Events in quadrant A | 3,383,166 | 387,748 |
| Events in quadrant B | 4,221,736 | 388,793 |
| Events in quadrant C | 3,008,804 | 386,168 |
| Events in quadrant D | 3,154,733 | 376,123 |
| Mode M9 | |||
|---|---|---|---|
| Quadrant | BADHDUFLAG | Total packets | Discarded packets |
| A | 0 | 17 | 0 |
| B | 0 | 17 | 0 |
| C | 0 | 17 | 0 |
| D | 0 | 18 | 0 |
| Mode SS | |||
|---|---|---|---|
| Quadrant | BADHDUFLAG | Total packets | Discarded packets |
| A | 0 | 132 | 0 |
| B | 0 | 132 | 0 |
| C | 0 | 132 | 0 |
| D | 0 | 132 | 0 |
| Mode M0 | |||
|---|---|---|---|
| Quadrant | BADHDUFLAG | Total packets | Discarded packets |
| A | 0 | 14027 | 7 |
| B | 0 | 16617 | 2 |
| C | 0 | 13278 | 2 |
| D | 0 | 13781 | 4 |
| Quadrant | Total seconds | Saturated seconds | Saturation percentage |
|---|---|---|---|
| A | 6456 | 80 | 1.239157% |
| B | 6458 | 411 | 6.364199% |
| C | 6458 | 61 | 0.944565% |
| D | 6457 | 82 | 1.269940% |
Noise dominated data is calculated using 1-second bins in cleaned event files. If a bin has >2000 counts, and if more than 50% of those come from <1% of pixels, then it is considered to be noise-dominated and hence unusable.
| Quadrant | # 1 sec bins | Bins with >0 counts | Bins with >2000 counts | High rate bins dominated by noise | Noise dominated (total time) | Noise dominated (detector-on time) | Marked lightcurve |
|---|---|---|---|---|---|---|---|
| A | 7553 | 6458 | 16 | 16 | 0.21% | 0.25% | 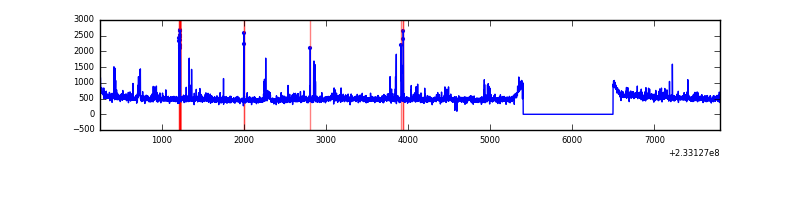 |
| B | 7553 | 6458 | 280 | 280 | 3.71% | 4.34% |  |
| C | 7553 | 6458 | 0 | 0 | 0.00% | 0.00% |  |
| D | 7553 | 6458 | 22 | 22 | 0.29% | 0.34% | 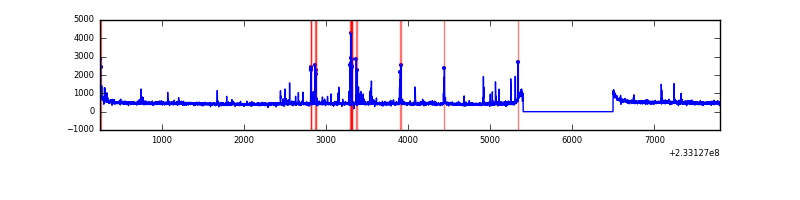 |
Top three noisy pixels from each quadrant. If the there are fewer than three noisy pixels in the level2.evt file, extra rows are filled as -1
| Pixel properties | Quadrant properties | ||||||
|---|---|---|---|---|---|---|---|
| Quadrant | DetID | PixID | Counts | Sigma | Mean | Median | Sigma |
| A | 8 | 5 | 253799 | 1578.45 | 788 | 769 | 160.3 |
| A | 15 | 174 | 41288 | 252.77 | 788 | 769 | 160.3 |
| A | 5 | 16 | 30881 | 187.84 | 788 | 769 | 160.3 |
| B | 10 | 16 | 1073097 | 7288.24 | 781 | 764 | 147.1 |
| B | 0 | 214 | 73304 | 493.03 | 781 | 764 | 147.1 |
| B | 4 | 173 | 19558 | 127.74 | 781 | 764 | 147.1 |
| C | 13 | 61 | 5943 | 29.0 | 771 | 774 | 178.3 |
| C | 12 | 4 | 2054 | 7.18 | 771 | 774 | 178.3 |
| C | 3 | 202 | 1921 | 6.43 | 771 | 774 | 178.3 |
| D | 1 | 52 | 90086 | 465.93 | 763 | 745 | 191.7 |
| D | 7 | 71 | 52450 | 269.65 | 763 | 745 | 191.7 |
| D | 2 | 14 | 45269 | 232.2 | 763 | 745 | 191.7 |
Histogram calculated using DETX and DETY for each event in the final _common_clean file
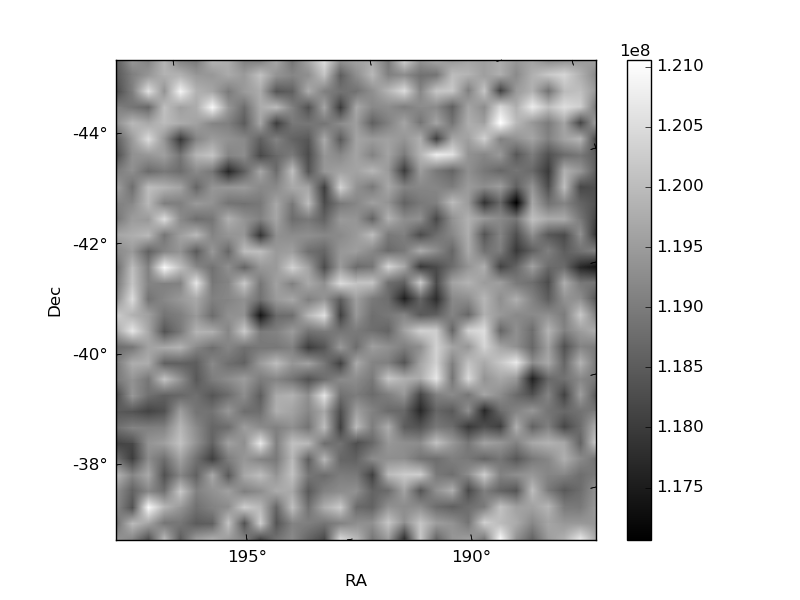
| Quadrant A | 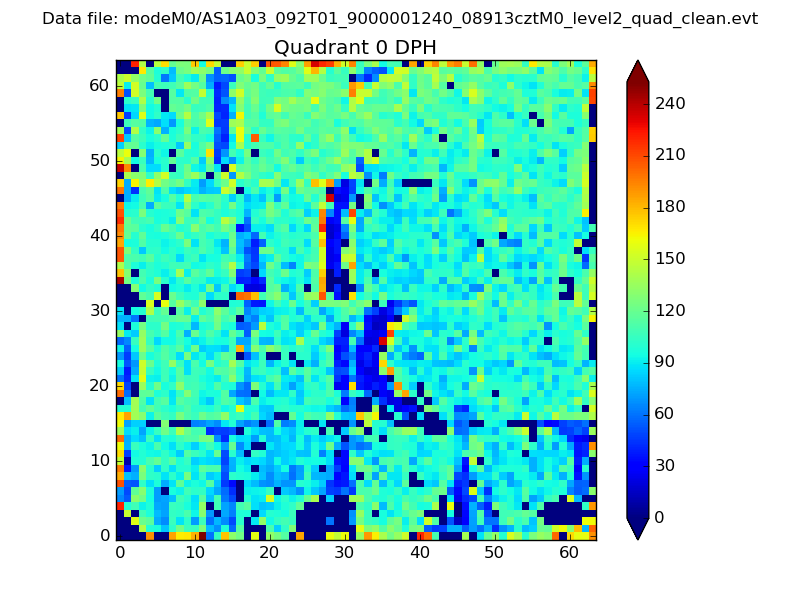 |
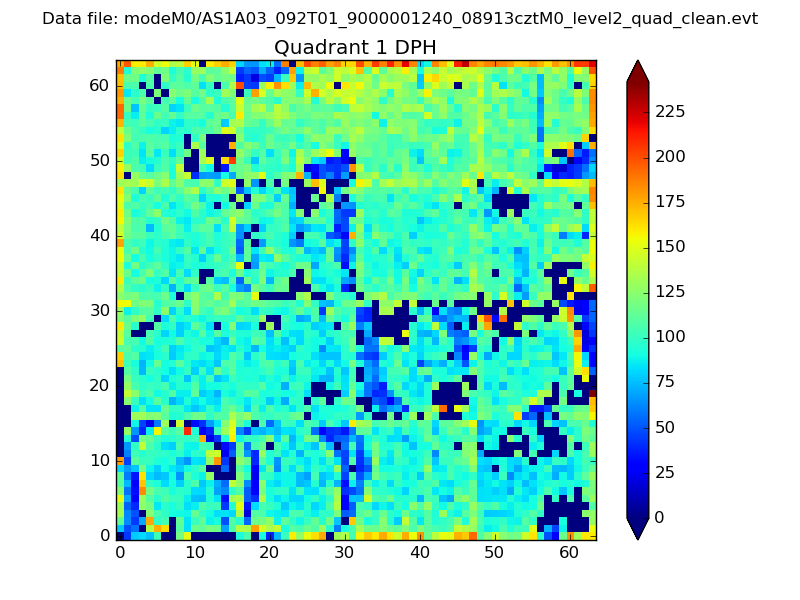 |
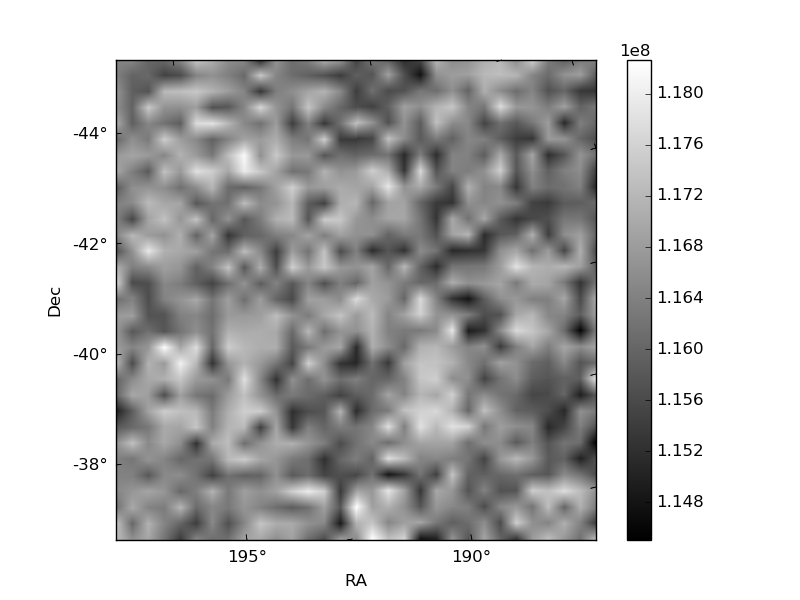
Quadrant B |
|---|---|---|---|
| Quadrant D | 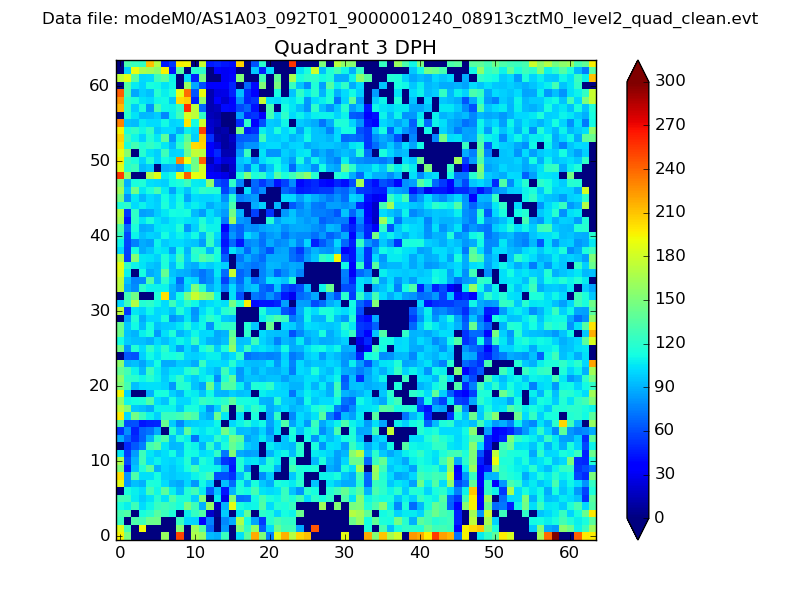 |
 |
Quadrant C |
| Plot type | Count rate plots | Images |
|---|---|---|
| Comparison with Poisson distribution Blue bars denote a histogram of data divided into 1 sec bins. Red curve is a Poisson curve with rate = median count rate of data. |
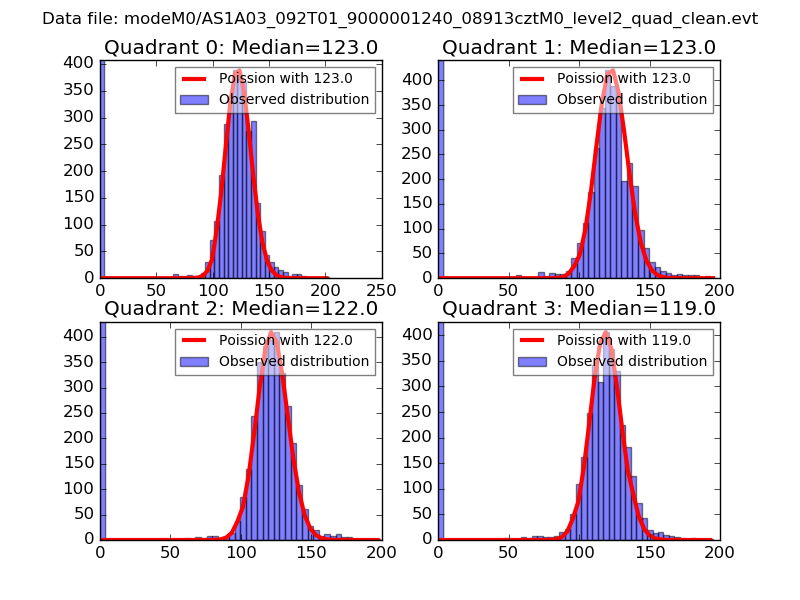 |
 |
| Quadrant-wise count rates Data is divided into 100 sec bins |
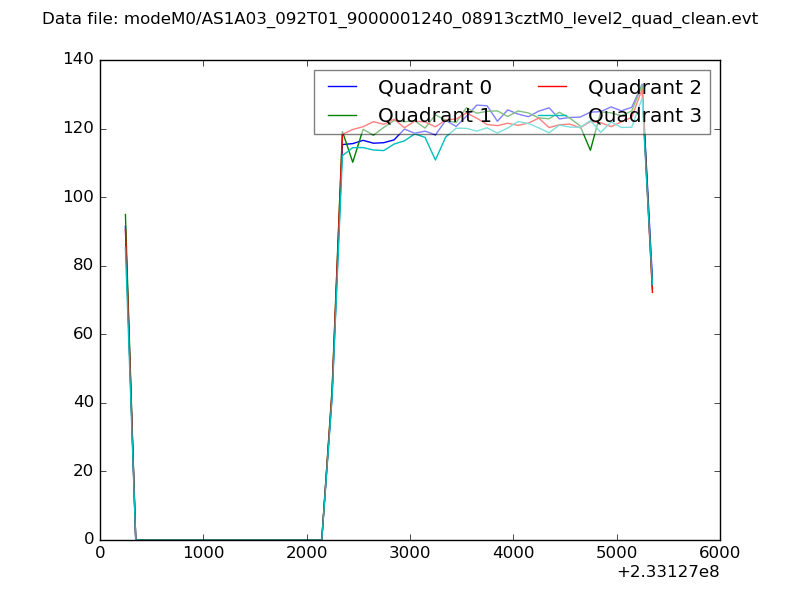 |
|
| Module-wise count rates for Quadrant A Data is divided into 100 sec bins |
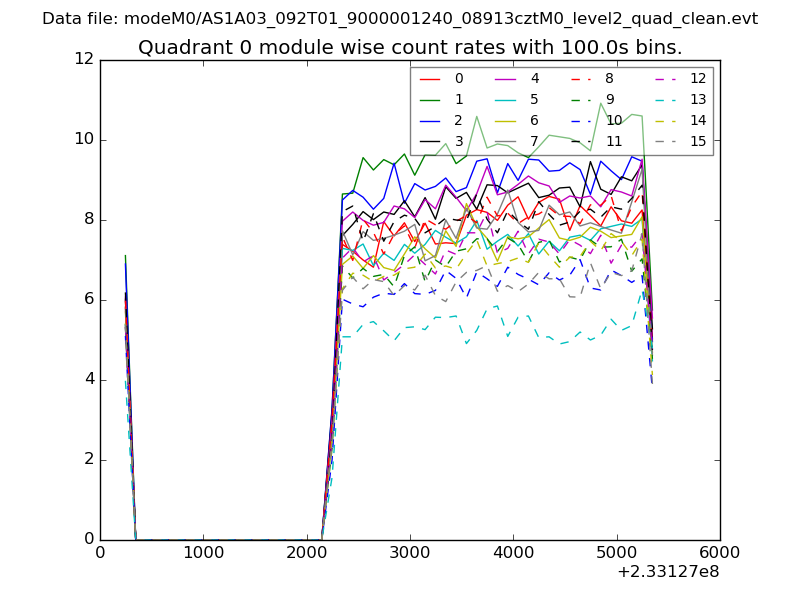 |
 |
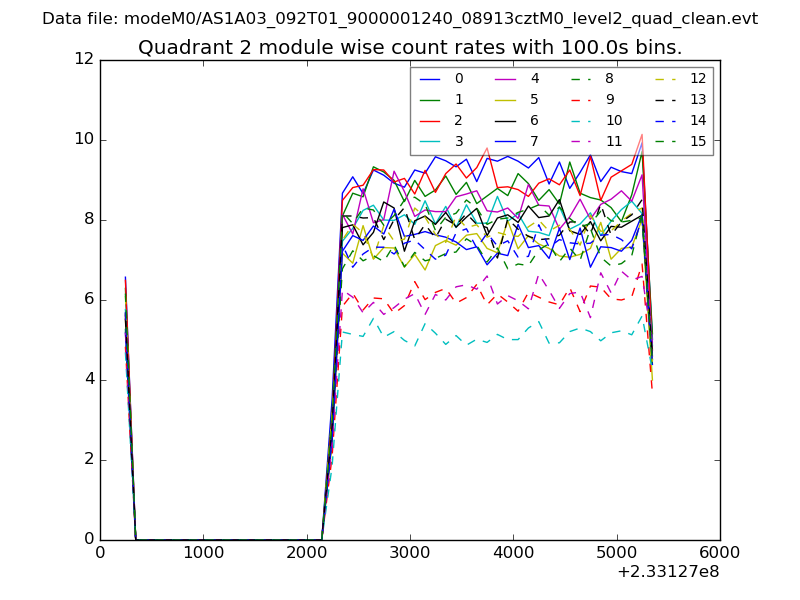
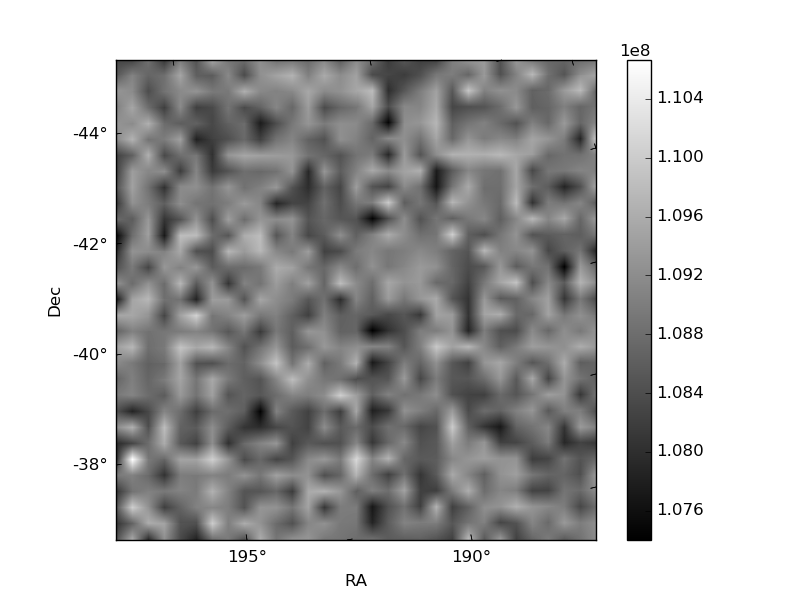
| Module-wise count rates for Quadrant B Data is divided into 100 sec bins |
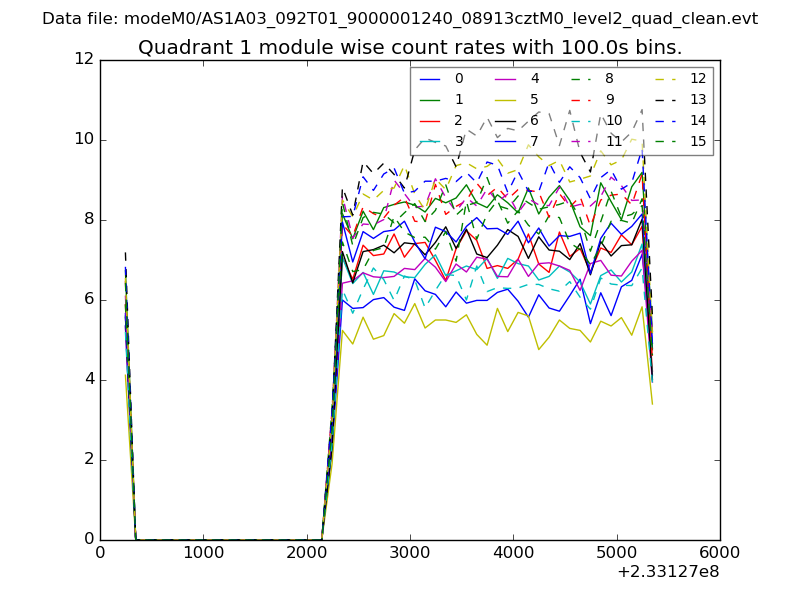 |
 |
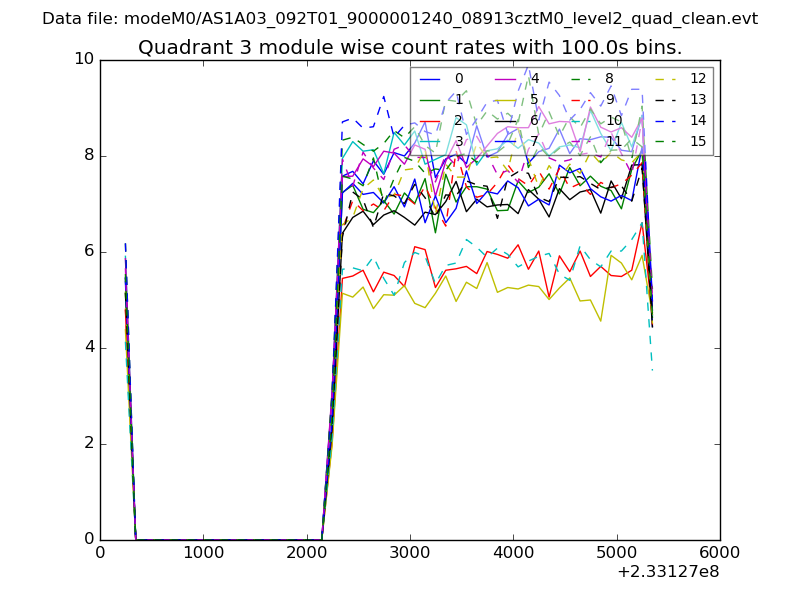
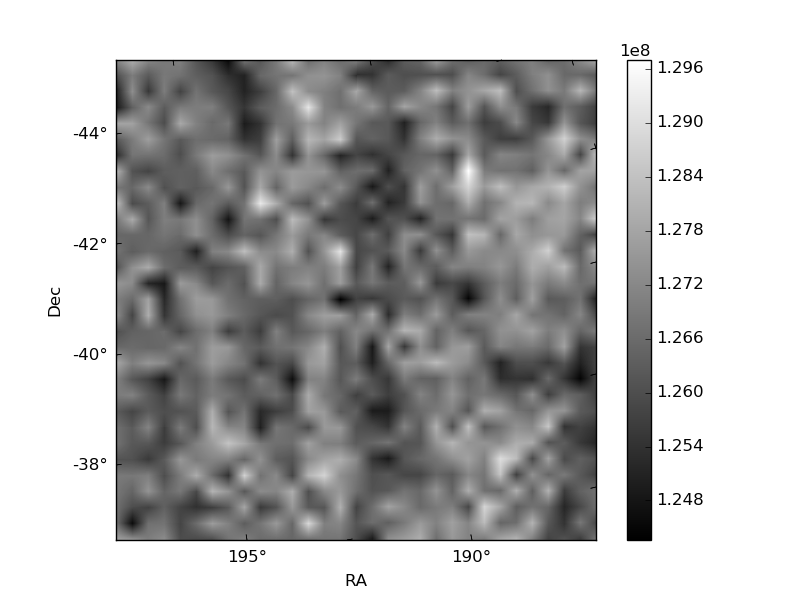
| Module-wise count rates for Quadrant C Data is divided into 100 sec bins |
 |
 |
| Module-wise count rates for Quadrant D Data is divided into 100 sec bins |
 |
 |
| Parameter | Plot |
|---|---|
| CZT HV Monitor | 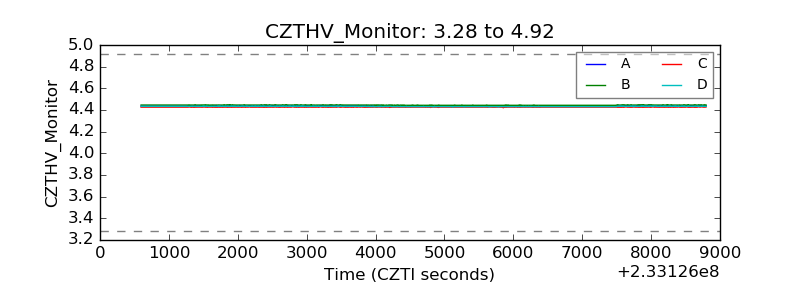 |
| D_VDD | 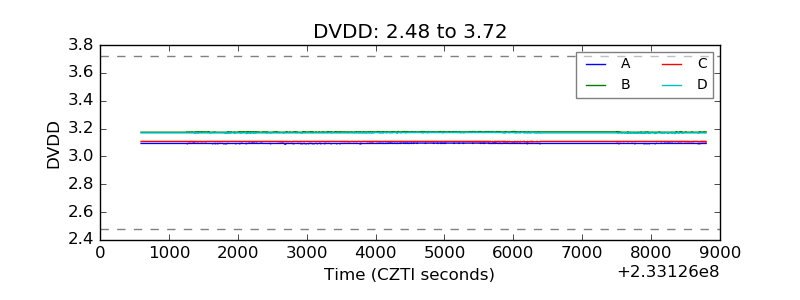 |
| Temperature 1 | 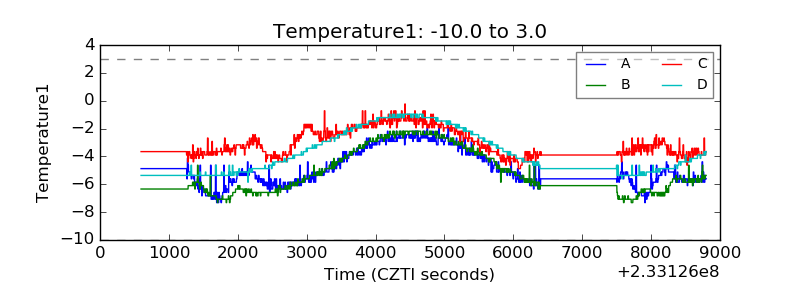 |
| Veto HV Monitor | 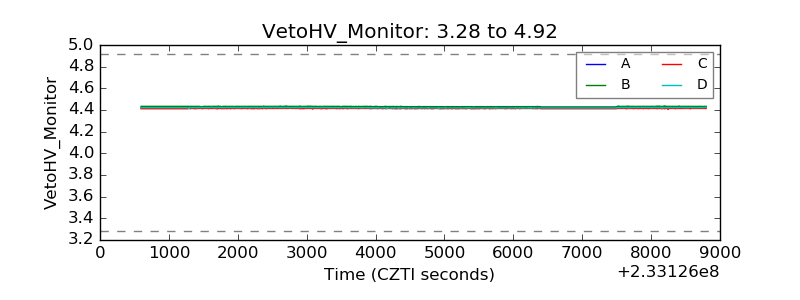 |
| Veto LLD | 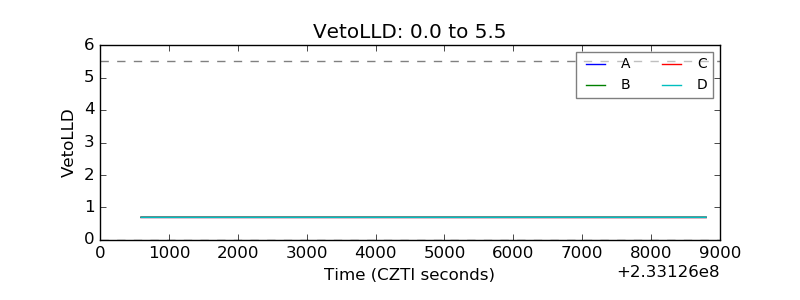 |
| Alpha Counter | 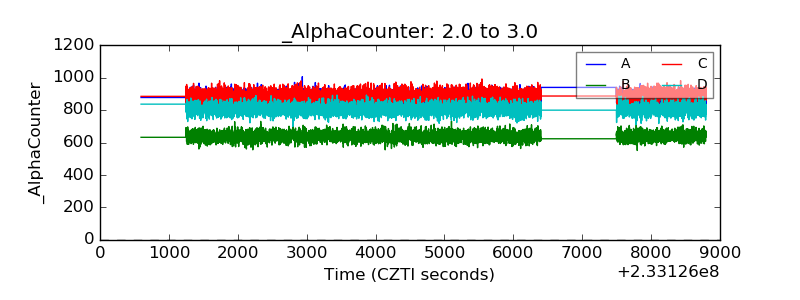 |
| _CPM_Rate | 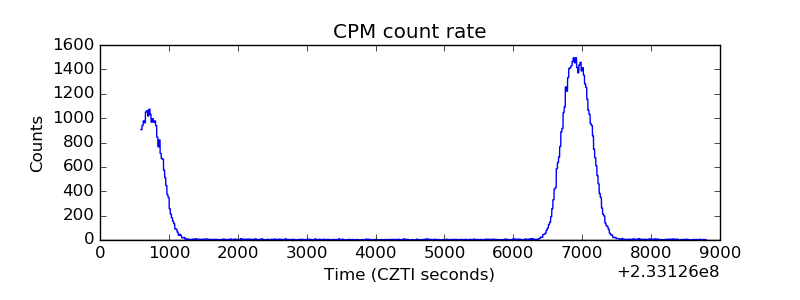 |
| CZT Counter | 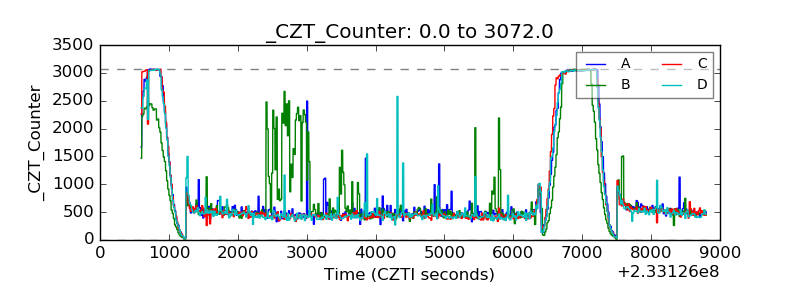 |
| +2.5 Volts monitor |  |
| +5 Volts monitor |  |
| _ROLL_ROT | 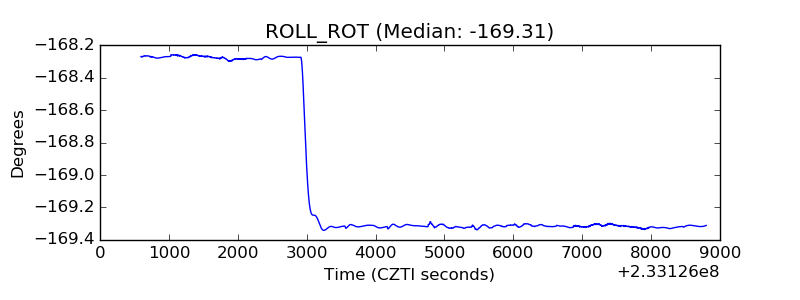 |
| _Roll_DEC | 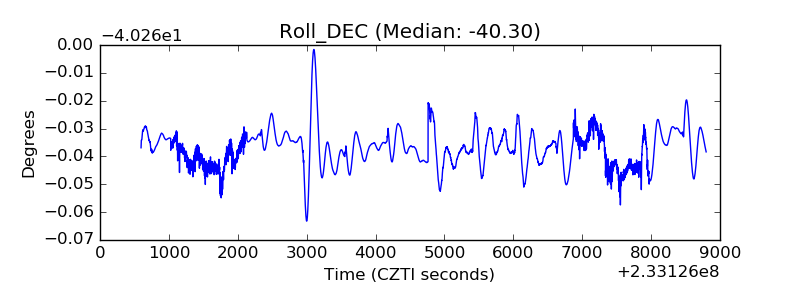 |
| _Roll_RA | 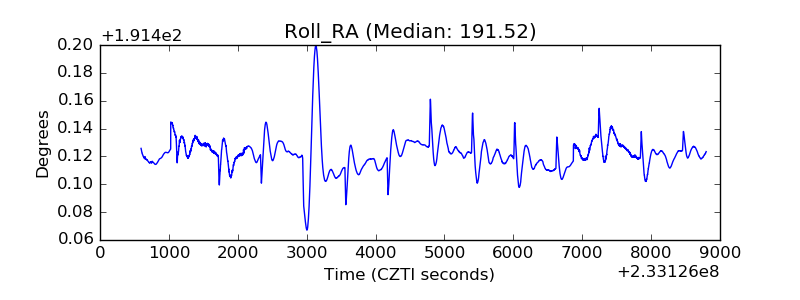 |
| Veto Counter | 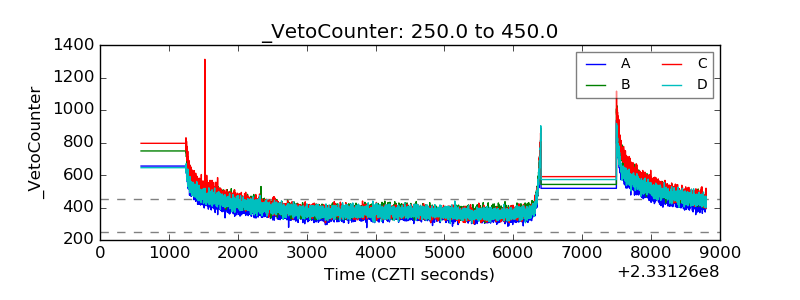 |