| Param | Original file | Final file |
|---|---|---|
| Filename | modeM0/AS1A03_092T01_9000001240_08914cztM0_level2.evt | modeM0/AS1A03_092T01_9000001240_08914cztM0_level2_quad_clean.evt |
| Size (bytes) | 447,258,240 | 72,060,480 |
| Size | 426.5 MB | 68.7 MB |
| Events in quadrant A | 3,328,932 | 439,485 |
| Events in quadrant B | 3,224,521 | 443,060 |
| Events in quadrant C | 3,054,443 | 434,973 |
| Events in quadrant D | 3,508,619 | 424,046 |
| Mode M9 | |||
|---|---|---|---|
| Quadrant | BADHDUFLAG | Total packets | Discarded packets |
| A | 0 | 17 | 0 |
| B | 0 | 17 | 0 |
| C | 0 | 17 | 0 |
| D | 0 | 18 | 0 |
| Mode SS | |||
|---|---|---|---|
| Quadrant | BADHDUFLAG | Total packets | Discarded packets |
| A | 0 | 128 | 0 |
| B | 0 | 128 | 0 |
| C | 0 | 128 | 0 |
| D | 0 | 128 | 0 |
| Mode M0 | |||
|---|---|---|---|
| Quadrant | BADHDUFLAG | Total packets | Discarded packets |
| A | 0 | 13850 | 5 |
| B | 0 | 13470 | 2 |
| C | 0 | 13207 | 4 |
| D | 0 | 14391 | 2 |
| Quadrant | Total seconds | Saturated seconds | Saturation percentage |
|---|---|---|---|
| A | 6310 | 74 | 1.172742% |
| B | 6311 | 97 | 1.536999% |
| C | 6310 | 56 | 0.887480% |
| D | 6311 | 71 | 1.125020% |
Noise dominated data is calculated using 1-second bins in cleaned event files. If a bin has >2000 counts, and if more than 50% of those come from <1% of pixels, then it is considered to be noise-dominated and hence unusable.
| Quadrant | # 1 sec bins | Bins with >0 counts | Bins with >2000 counts | High rate bins dominated by noise | Noise dominated (total time) | Noise dominated (detector-on time) | Marked lightcurve |
|---|---|---|---|---|---|---|---|
| A | 7531 | 6311 | 2 | 2 | 0.03% | 0.03% | 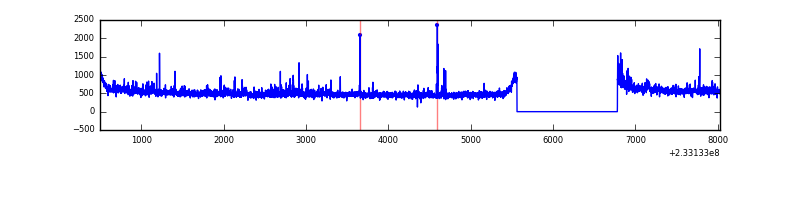 |
| B | 7531 | 6311 | 11 | 11 | 0.15% | 0.17% | 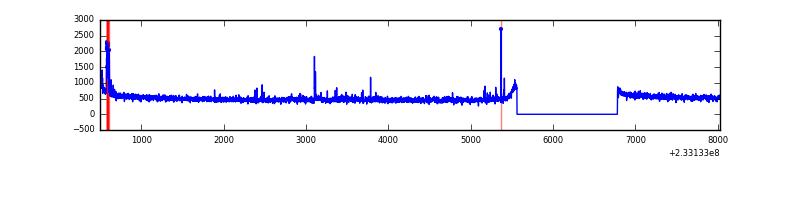 |
| C | 7531 | 6311 | 0 | 0 | 0.00% | 0.00% |  |
| D | 7531 | 6311 | 10 | 10 | 0.13% | 0.16% | 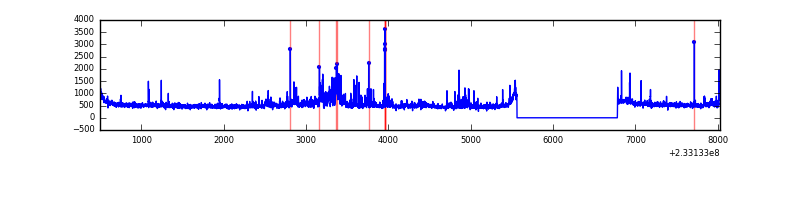 |
Top three noisy pixels from each quadrant. If the there are fewer than three noisy pixels in the level2.evt file, extra rows are filled as -1
| Pixel properties | Quadrant properties | ||||||
|---|---|---|---|---|---|---|---|
| Quadrant | DetID | PixID | Counts | Sigma | Mean | Median | Sigma |
| A | 8 | 5 | 197292 | 1228.91 | 802 | 788 | 159.9 |
| A | 5 | 16 | 21589 | 130.09 | 802 | 788 | 159.9 |
| A | 13 | 251 | 10689 | 61.92 | 802 | 788 | 159.9 |
| B | 0 | 214 | 57995 | 379.25 | 804 | 786 | 150.8 |
| B | 4 | 173 | 23802 | 152.58 | 804 | 786 | 150.8 |
| B | 0 | 219 | 17469 | 110.6 | 804 | 786 | 150.8 |
| C | 1 | 3 | 8357 | 42.61 | 780 | 786 | 177.7 |
| C | 13 | 61 | 6032 | 29.52 | 780 | 786 | 177.7 |
| C | 12 | 4 | 2422 | 9.21 | 780 | 786 | 177.7 |
| D | 12 | 233 | 232780 | 1204.99 | 779 | 760 | 192.5 |
| D | 1 | 52 | 134175 | 692.89 | 779 | 760 | 192.5 |
| D | 8 | 195 | 92429 | 476.08 | 779 | 760 | 192.5 |
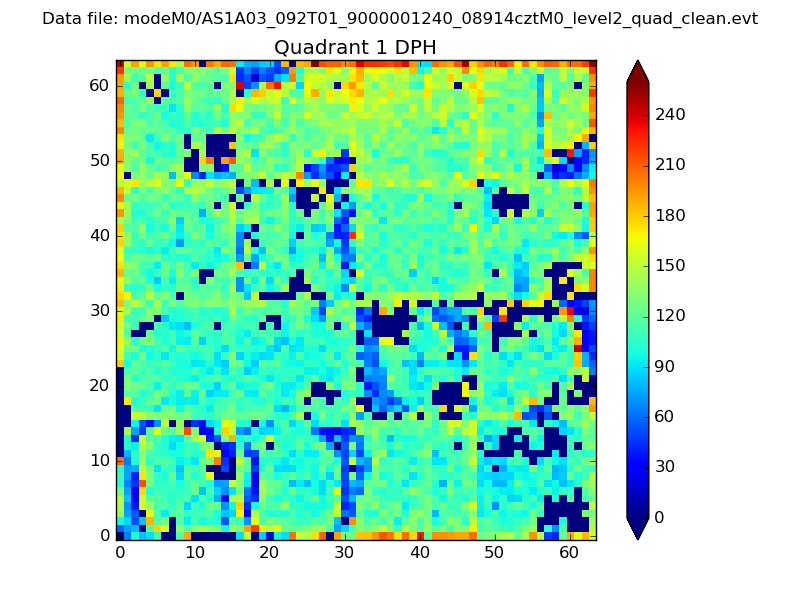
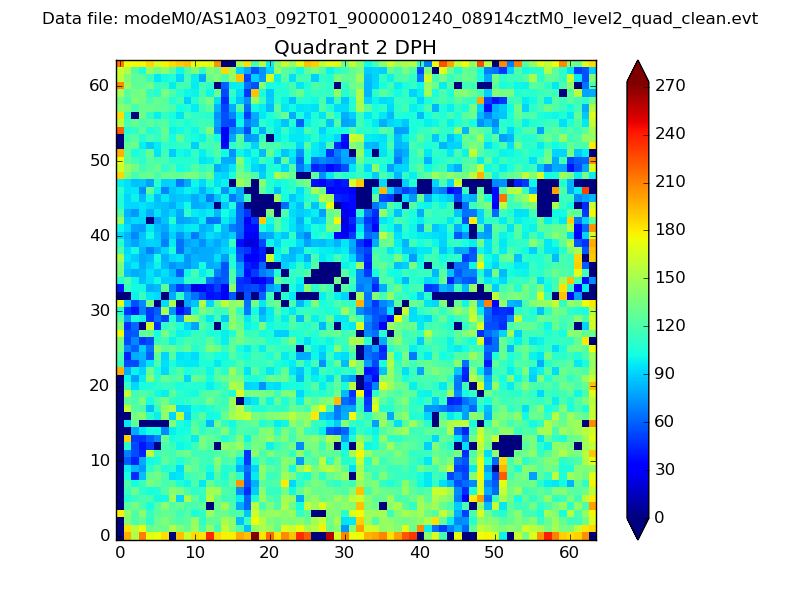
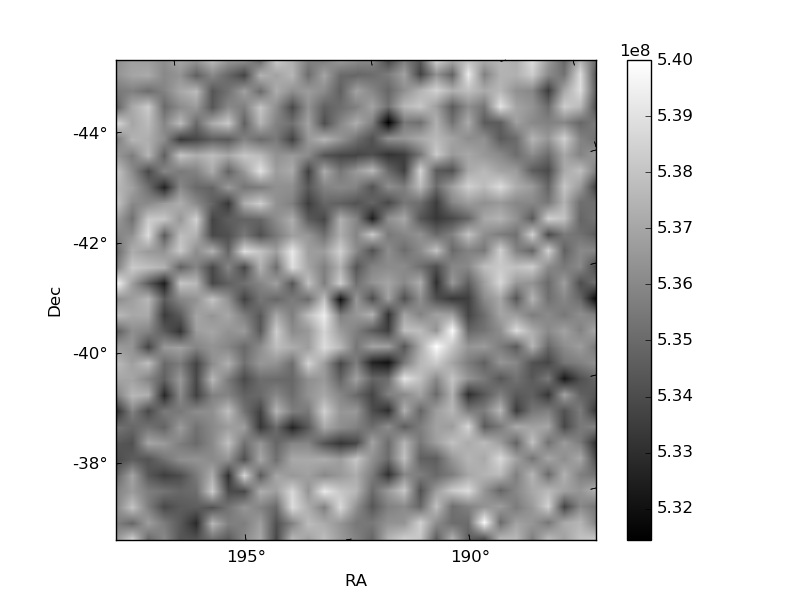
Histogram calculated using DETX and DETY for each event in the final _common_clean file
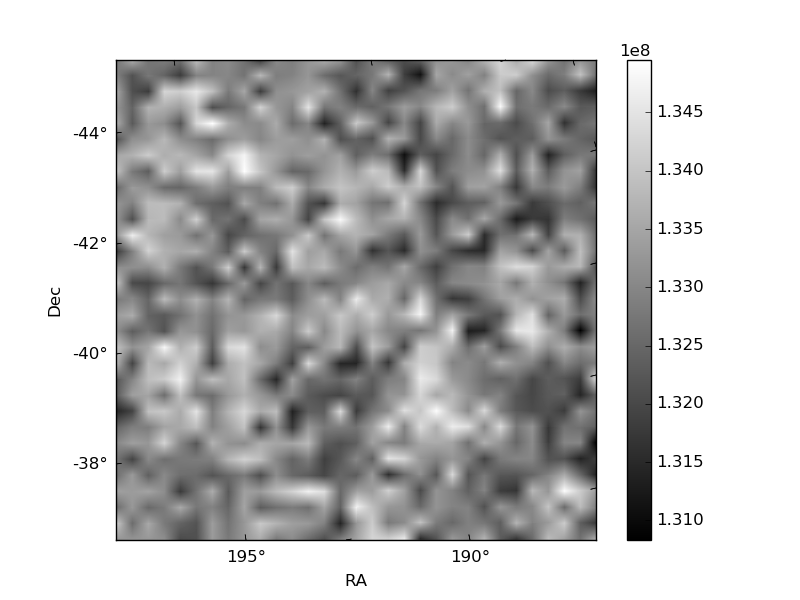
| Quadrant A | 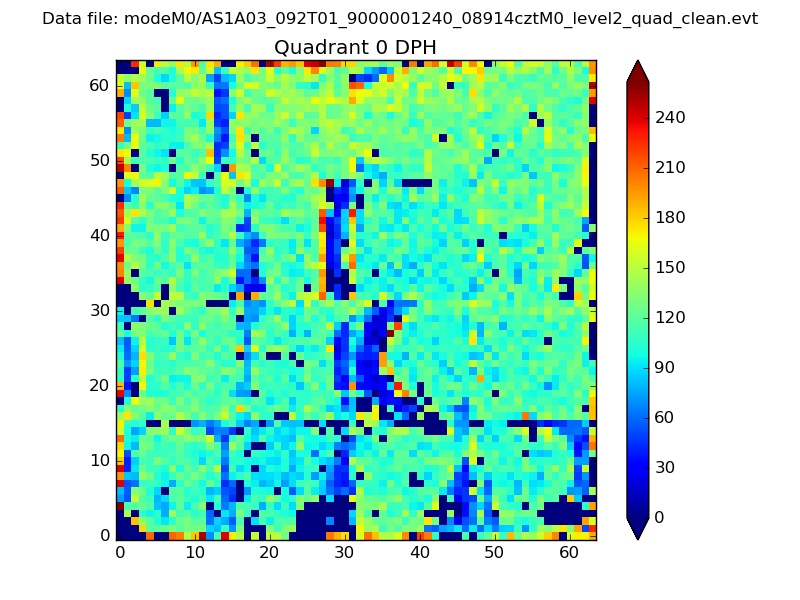 |
 |
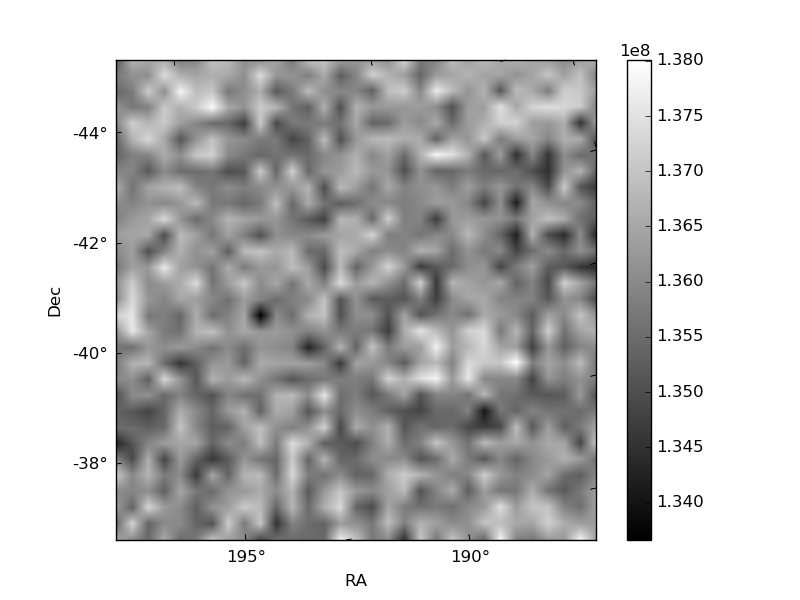
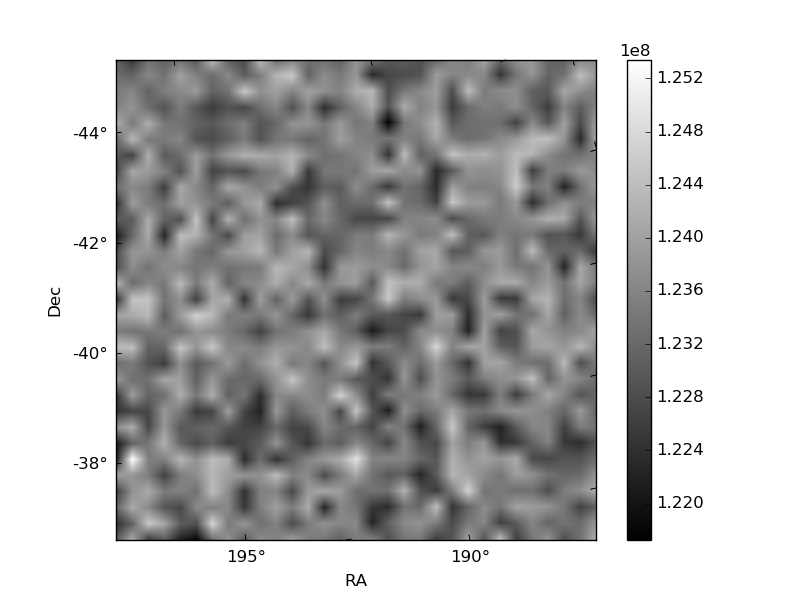
Quadrant B |
|---|---|---|---|
| Quadrant D | 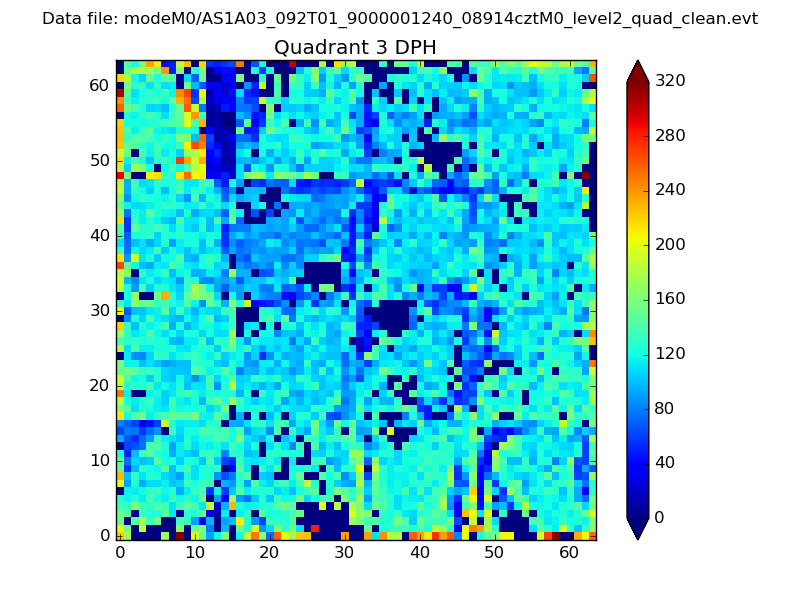 |
 |
Quadrant C |
| Plot type | Count rate plots | Images |
|---|---|---|
| Comparison with Poisson distribution Blue bars denote a histogram of data divided into 1 sec bins. Red curve is a Poisson curve with rate = median count rate of data. |
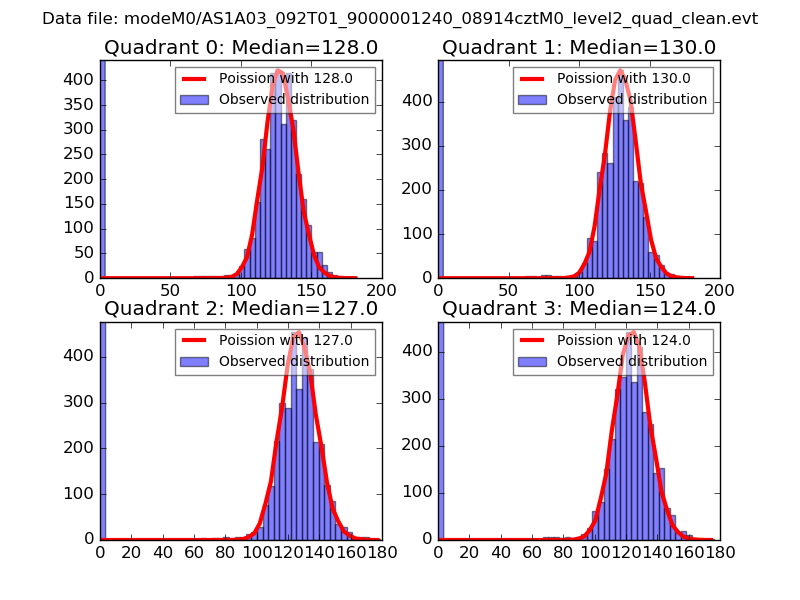 |
 |
| Quadrant-wise count rates Data is divided into 100 sec bins |
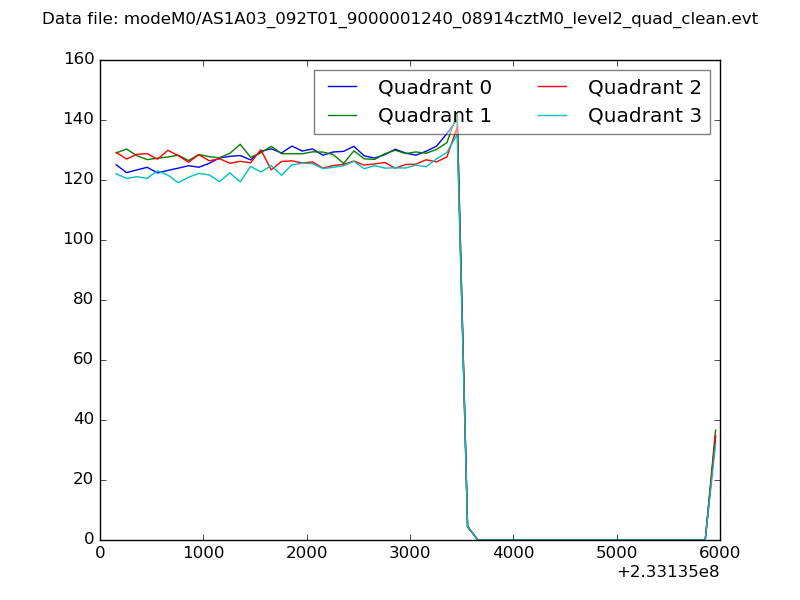 |
|
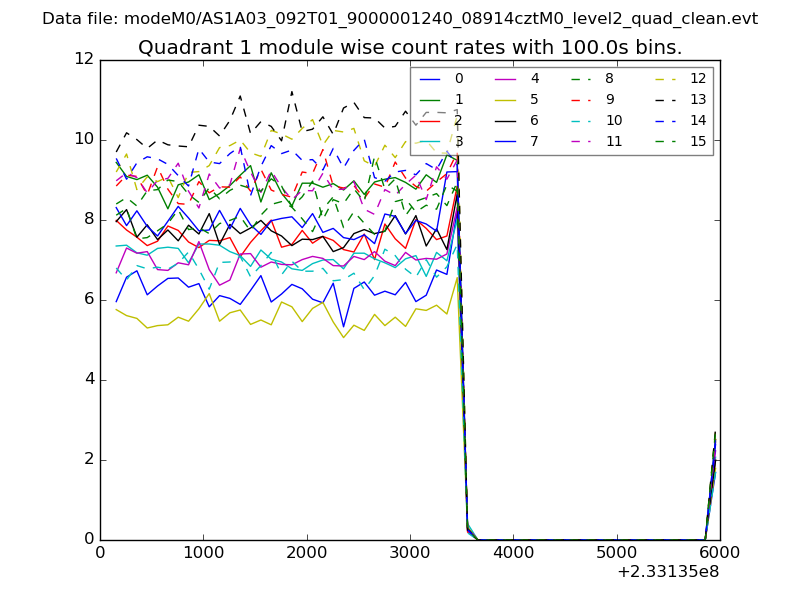
| Module-wise count rates for Quadrant A Data is divided into 100 sec bins |
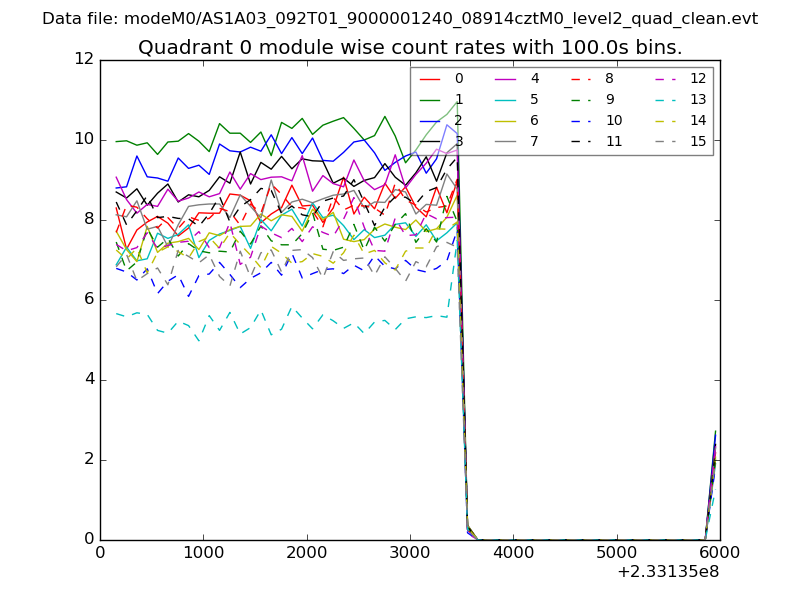 |
 |
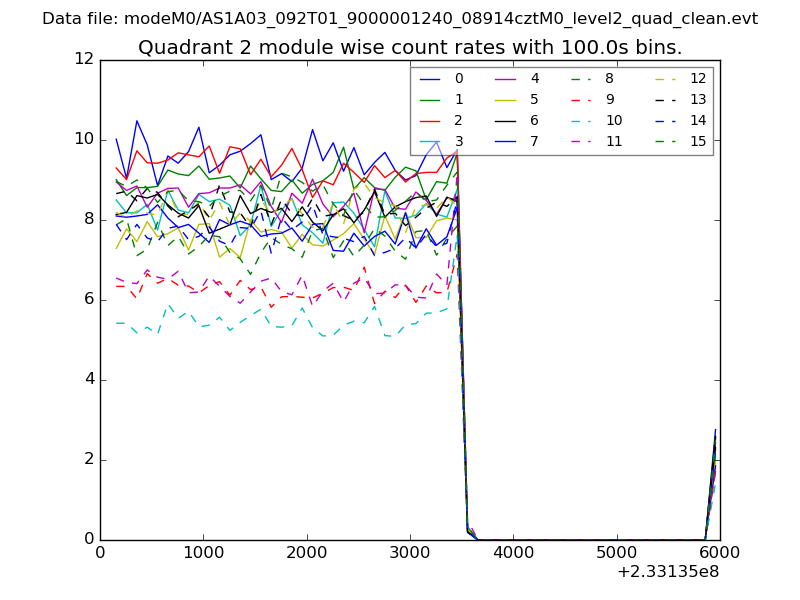
| Module-wise count rates for Quadrant B Data is divided into 100 sec bins |
 |
 |
| Module-wise count rates for Quadrant C Data is divided into 100 sec bins |
 |
 |
| Module-wise count rates for Quadrant D Data is divided into 100 sec bins |
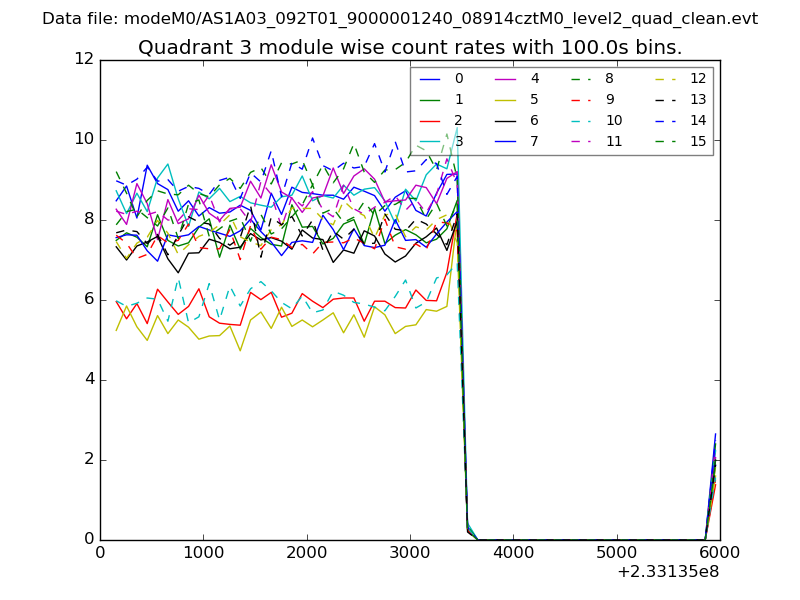 |
 |
| Parameter | Plot |
|---|---|
| CZT HV Monitor | 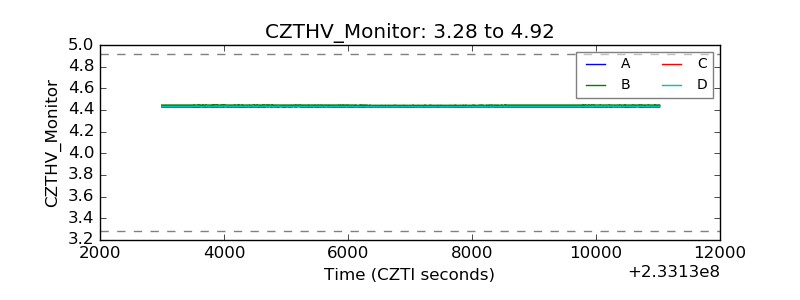 |
| D_VDD | 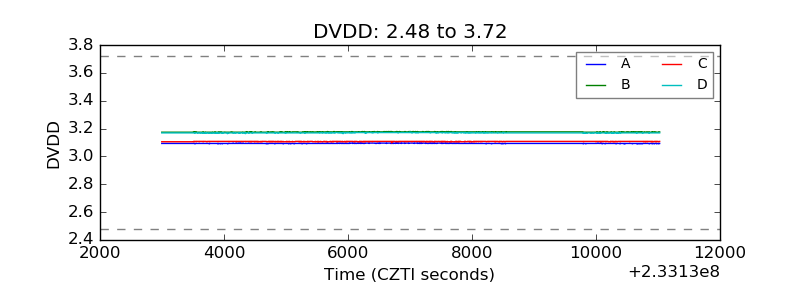 |
| Temperature 1 | 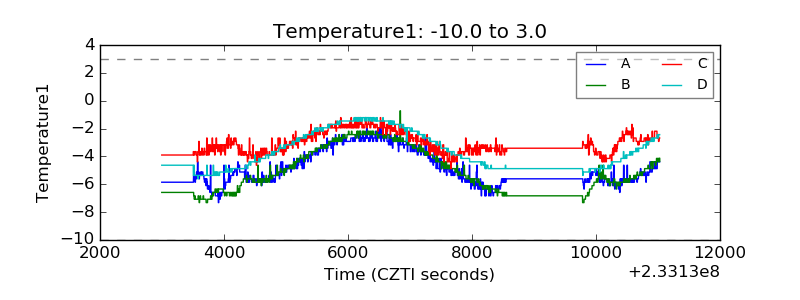 |
| Veto HV Monitor | 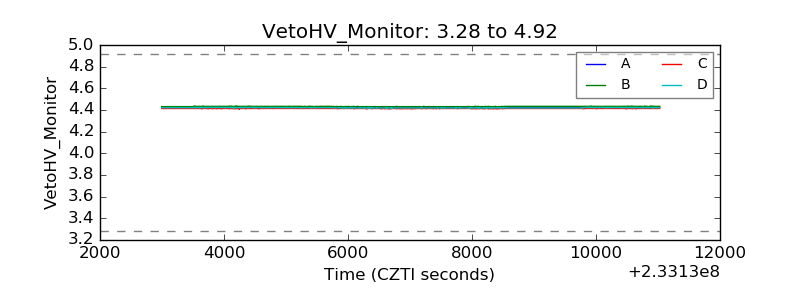 |
| Veto LLD | 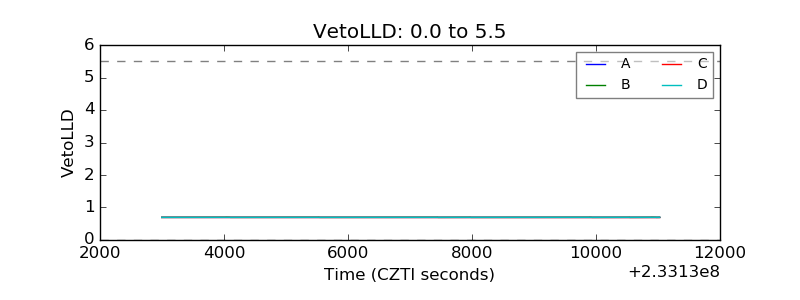 |
| Alpha Counter | 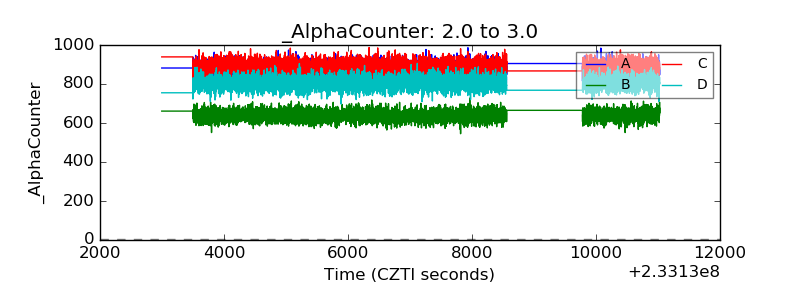 |
| _CPM_Rate | 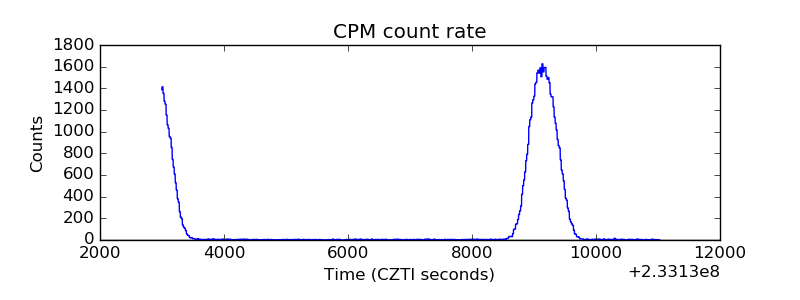 |
| CZT Counter | 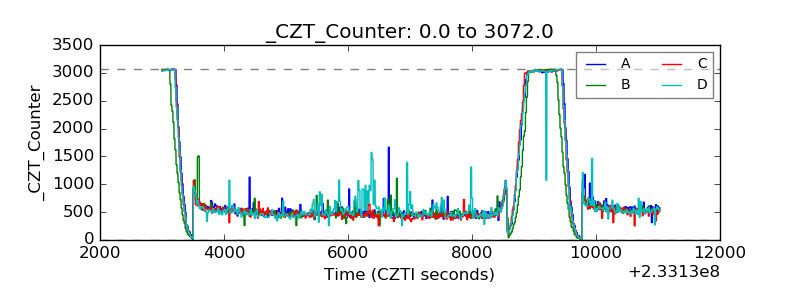 |
| +2.5 Volts monitor |  |
| +5 Volts monitor |  |
| _ROLL_ROT |  |
| _Roll_DEC | 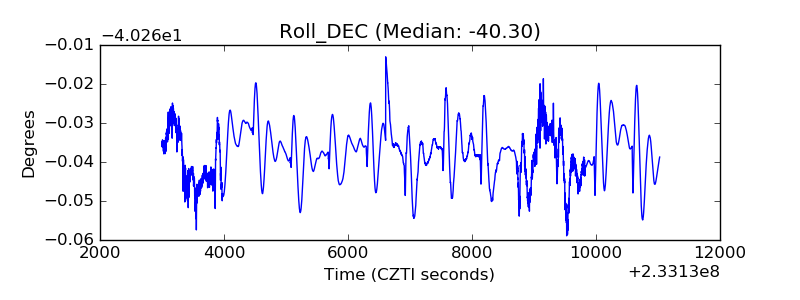 |
| _Roll_RA |  |
| Veto Counter | 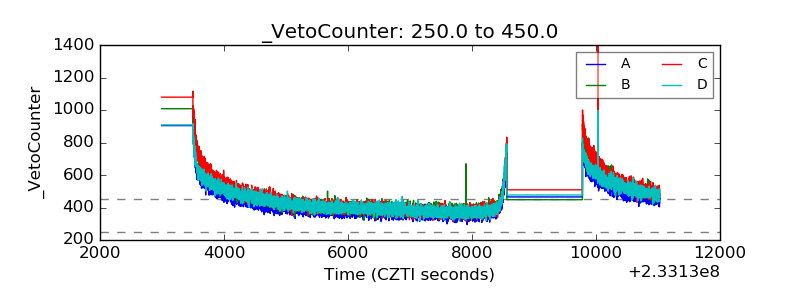 |