| Param | Original file | Final file |
|---|---|---|
| Filename | modeM0/AS1A03_092T01_9000001240_08916cztM0_level2.evt | modeM0/AS1A03_092T01_9000001240_08916cztM0_level2_quad_clean.evt |
| Size (bytes) | 441,322,560 | 98,233,920 |
| Size | 420.9 MB | 93.7 MB |
| Events in quadrant A | 3,506,413 | 640,759 |
| Events in quadrant B | 3,174,314 | 649,857 |
| Events in quadrant C | 3,003,019 | 632,633 |
| Events in quadrant D | 3,261,425 | 619,929 |
| Mode M9 | |||
|---|---|---|---|
| Quadrant | BADHDUFLAG | Total packets | Discarded packets |
| A | 0 | 26 | 0 |
| B | 0 | 26 | 0 |
| C | 0 | 26 | 0 |
| D | 0 | 26 | 0 |
| Mode SS | |||
|---|---|---|---|
| Quadrant | BADHDUFLAG | Total packets | Discarded packets |
| A | 0 | 128 | 0 |
| B | 0 | 128 | 2 |
| C | 0 | 128 | 0 |
| D | 0 | 128 | 0 |
| Mode M0 | |||
|---|---|---|---|
| Quadrant | BADHDUFLAG | Total packets | Discarded packets |
| A | 0 | 14184 | 3 |
| B | 0 | 13146 | 4 |
| C | 0 | 12932 | 2 |
| D | 0 | 13513 | 2 |
| Quadrant | Total seconds | Saturated seconds | Saturation percentage |
|---|---|---|---|
| A | 6185 | 107 | 1.729992% |
| B | 6184 | 71 | 1.148124% |
| C | 6185 | 57 | 0.921584% |
| D | 6185 | 62 | 1.002425% |
Noise dominated data is calculated using 1-second bins in cleaned event files. If a bin has >2000 counts, and if more than 50% of those come from <1% of pixels, then it is considered to be noise-dominated and hence unusable.
| Quadrant | # 1 sec bins | Bins with >0 counts | Bins with >2000 counts | High rate bins dominated by noise | Noise dominated (total time) | Noise dominated (detector-on time) | Marked lightcurve |
|---|---|---|---|---|---|---|---|
| A | 8805 | 6185 | 20 | 20 | 0.23% | 0.32% | 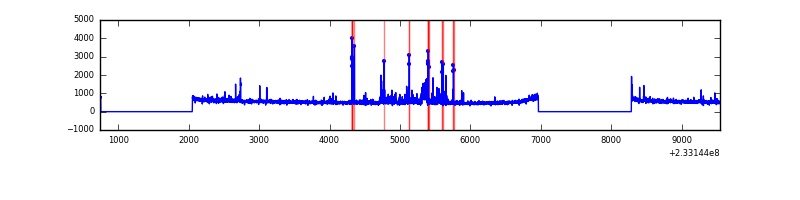 |
| B | 8805 | 6186 | 0 | 0 | 0.00% | 0.00% | 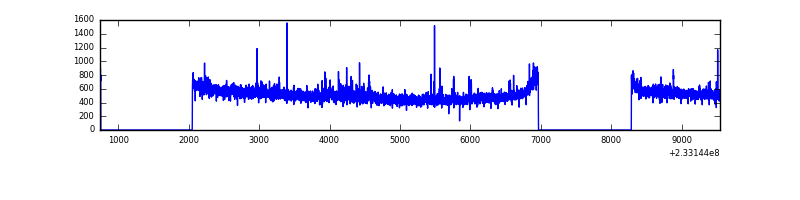 |
| C | 8805 | 6186 | 0 | 0 | 0.00% | 0.00% | 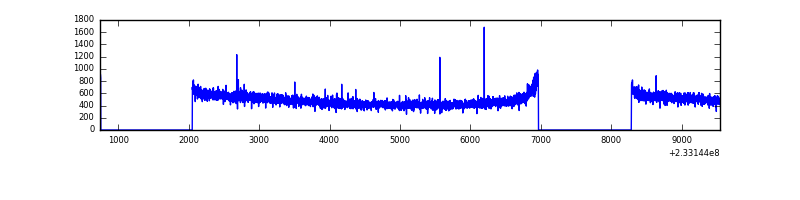 |
| D | 8805 | 6186 | 7 | 7 | 0.08% | 0.11% | 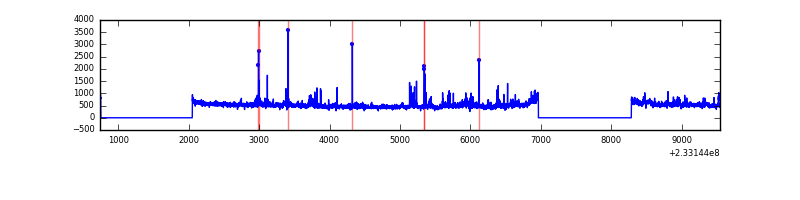 |
Top three noisy pixels from each quadrant. If the there are fewer than three noisy pixels in the level2.evt file, extra rows are filled as -1
| Pixel properties | Quadrant properties | ||||||
|---|---|---|---|---|---|---|---|
| Quadrant | DetID | PixID | Counts | Sigma | Mean | Median | Sigma |
| A | 8 | 5 | 370488 | 2297.6 | 799 | 784 | 160.9 |
| A | 15 | 174 | 27902 | 168.53 | 799 | 784 | 160.9 |
| A | 5 | 16 | 24849 | 149.56 | 799 | 784 | 160.9 |
| B | 0 | 214 | 42768 | 281.71 | 795 | 781 | 149.0 |
| B | 4 | 173 | 19750 | 127.27 | 795 | 781 | 149.0 |
| B | 12 | 111 | 15619 | 99.55 | 795 | 781 | 149.0 |
| C | 13 | 61 | 5749 | 28.36 | 769 | 774 | 175.4 |
| C | 12 | 4 | 4794 | 22.92 | 769 | 774 | 175.4 |
| C | 3 | 202 | 2037 | 7.2 | 769 | 774 | 175.4 |
| D | 1 | 52 | 101361 | 525.2 | 773 | 755 | 191.6 |
| D | 8 | 195 | 80201 | 414.74 | 773 | 755 | 191.6 |
| D | 7 | 71 | 53971 | 277.81 | 773 | 755 | 191.6 |
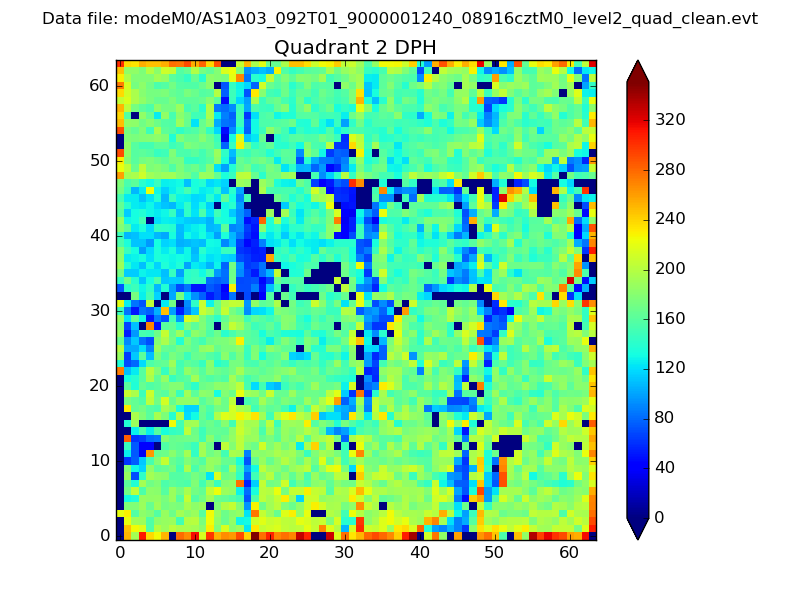
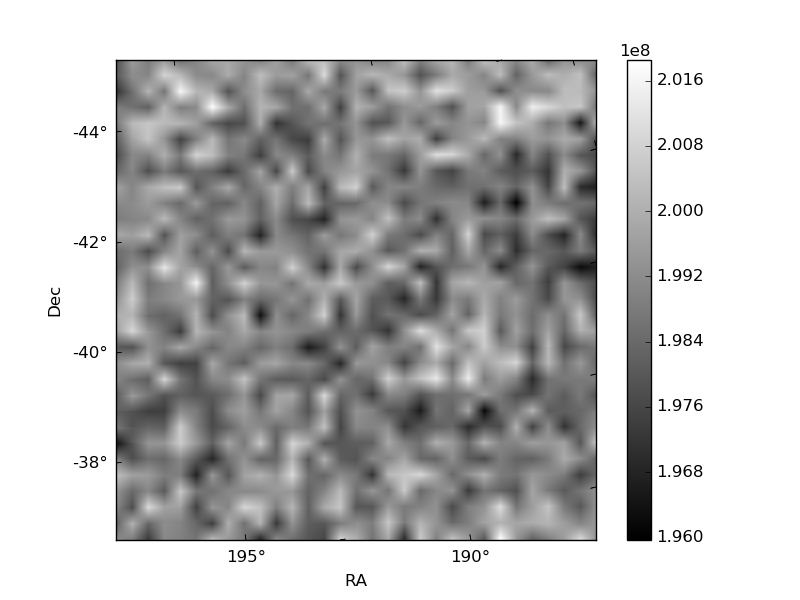
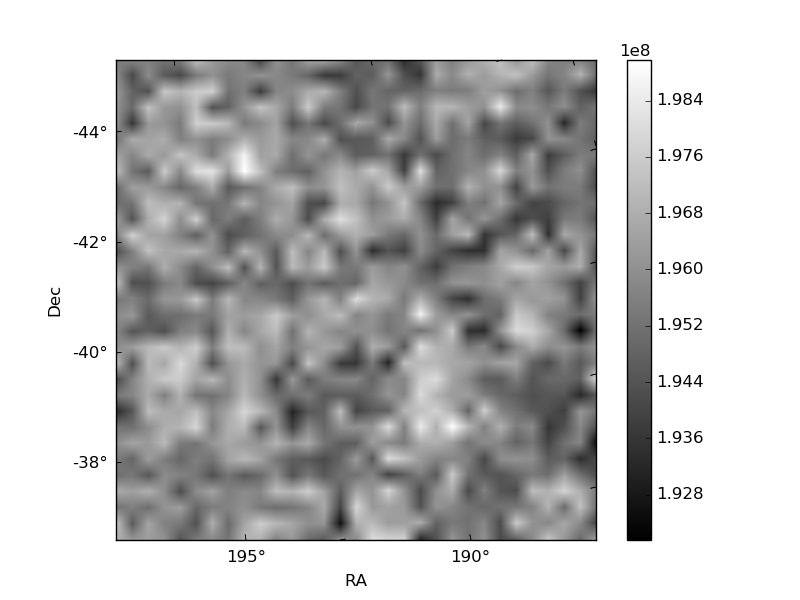
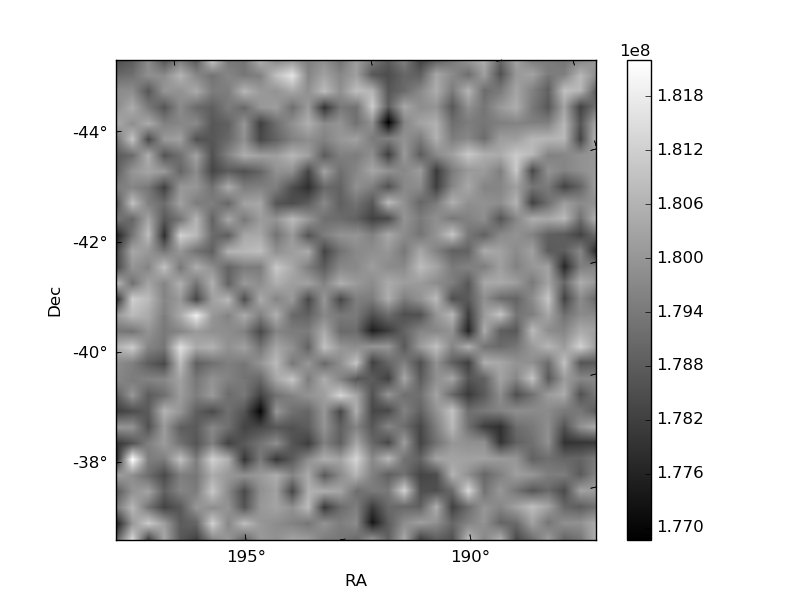
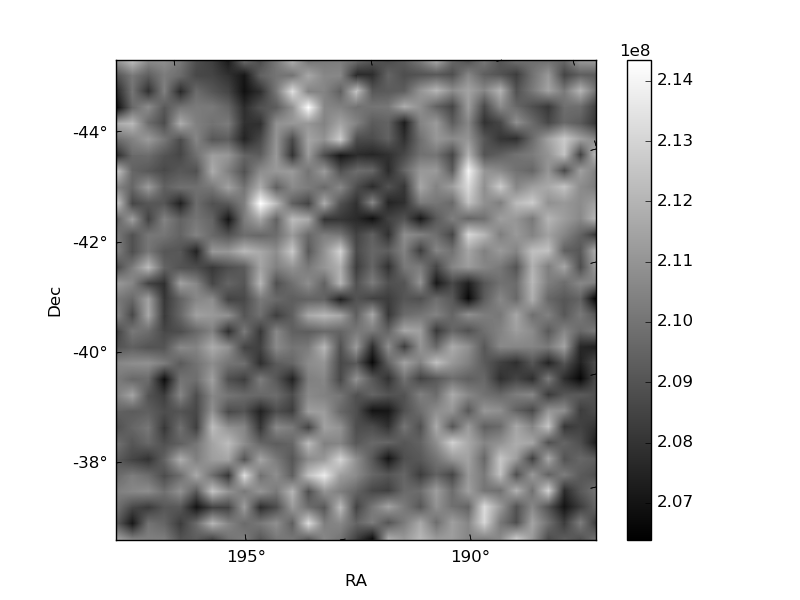
Histogram calculated using DETX and DETY for each event in the final _common_clean file
| Quadrant A | 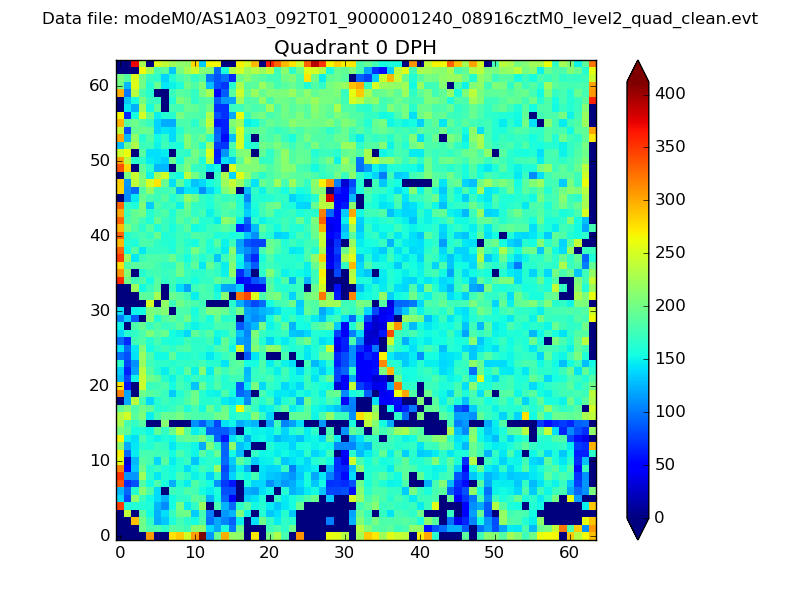 |
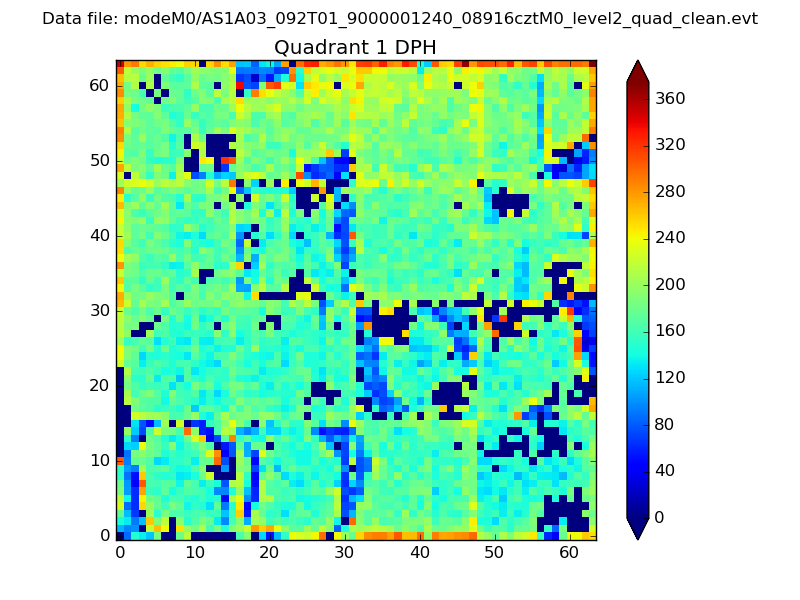 |
Quadrant B |
|---|---|---|---|
| Quadrant D | 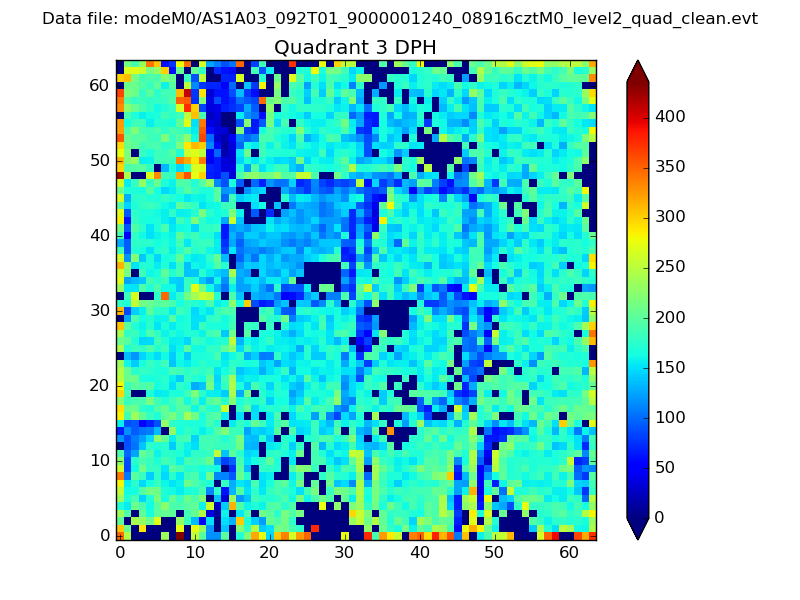 |
 |
Quadrant C |
| Plot type | Count rate plots | Images |
|---|---|---|
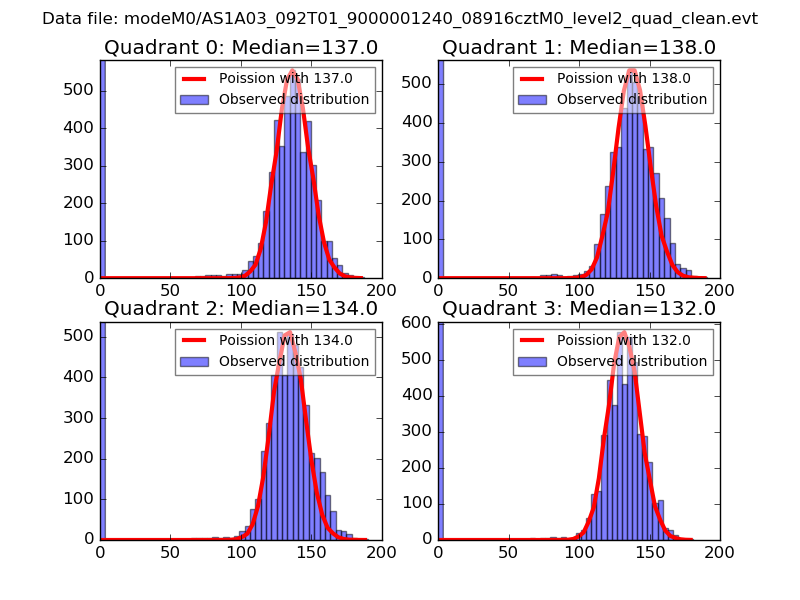
| Comparison with Poisson distribution Blue bars denote a histogram of data divided into 1 sec bins. Red curve is a Poisson curve with rate = median count rate of data. |
 |
 |
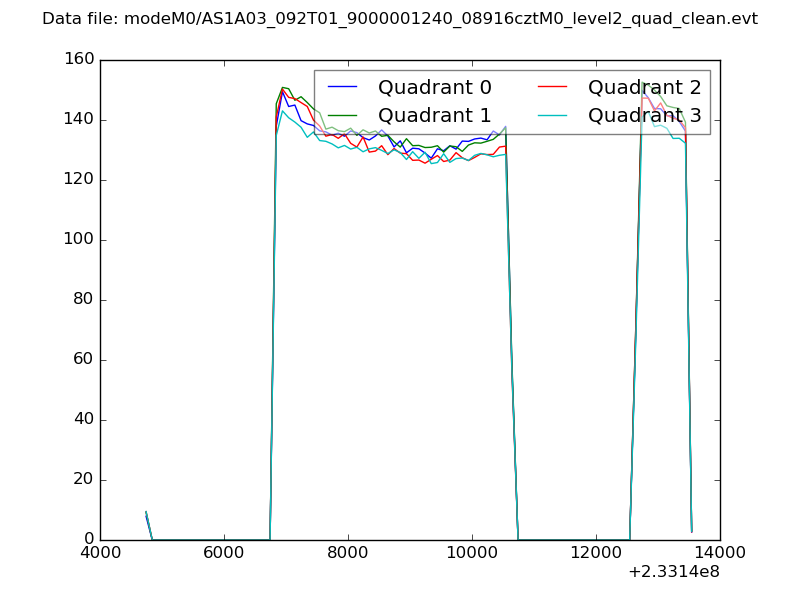
| Quadrant-wise count rates Data is divided into 100 sec bins |
 |
|
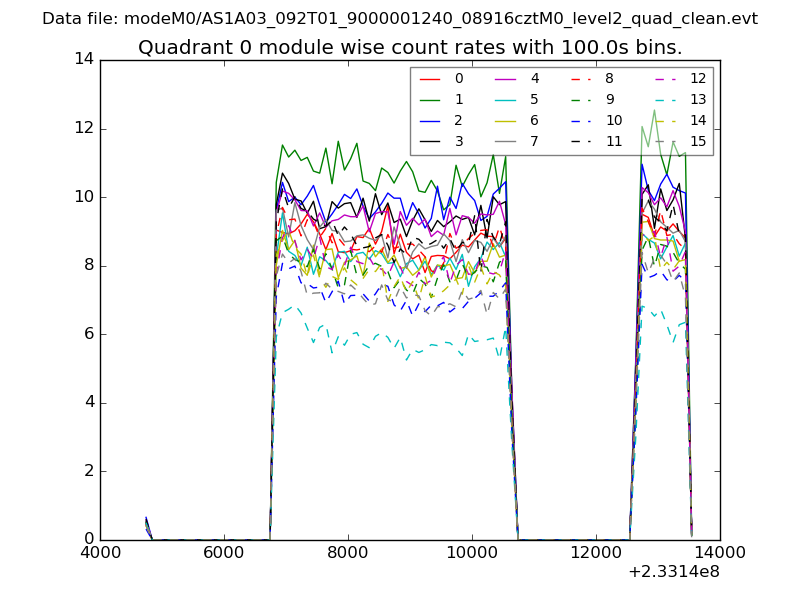
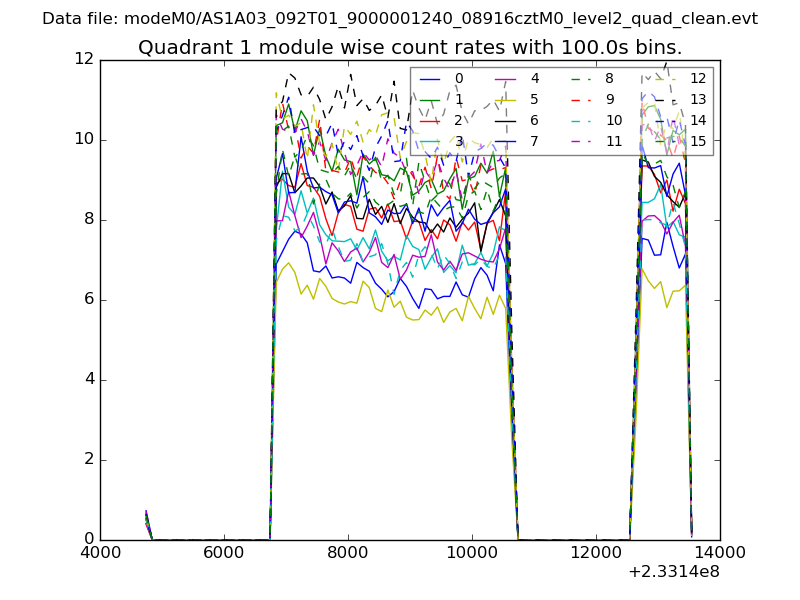
| Module-wise count rates for Quadrant A Data is divided into 100 sec bins |
 |
 |
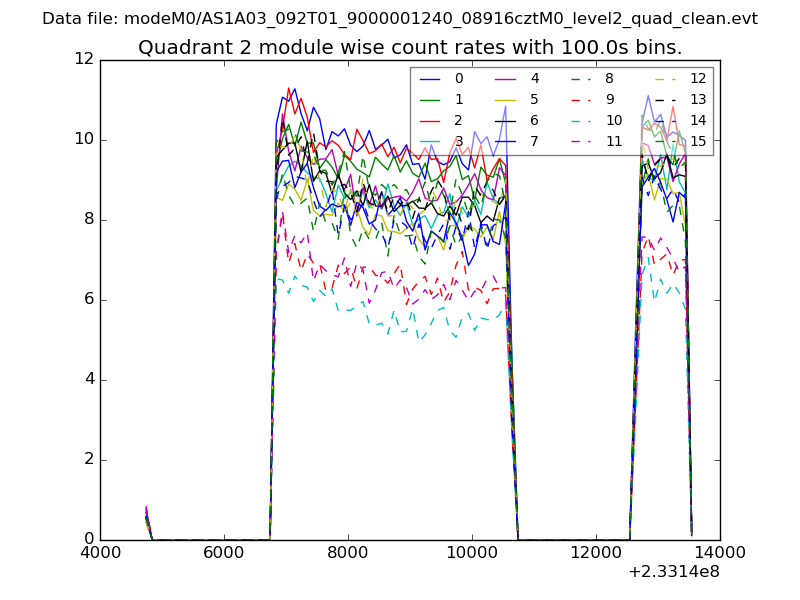
| Module-wise count rates for Quadrant B Data is divided into 100 sec bins |
 |
 |
| Module-wise count rates for Quadrant C Data is divided into 100 sec bins |
 |
 |
| Module-wise count rates for Quadrant D Data is divided into 100 sec bins |
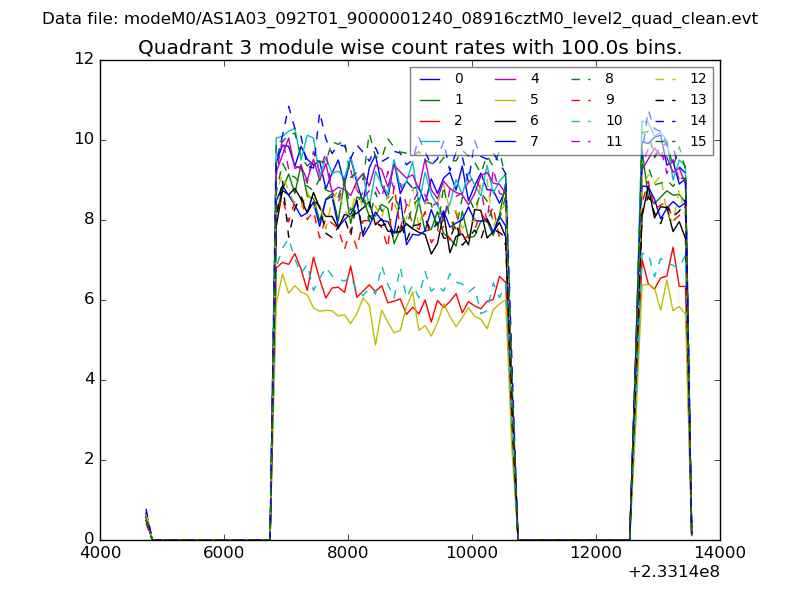 |
 |
| Parameter | Plot |
|---|---|
| CZT HV Monitor | 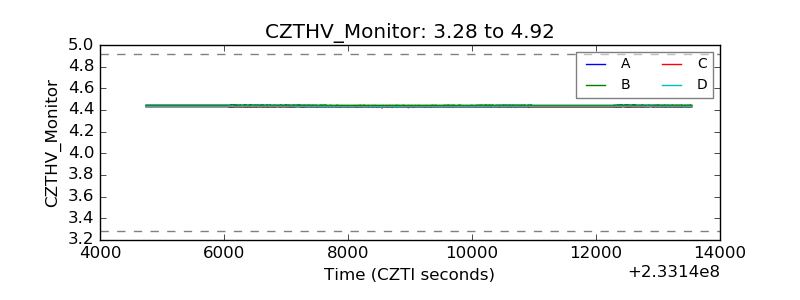 |
| D_VDD | 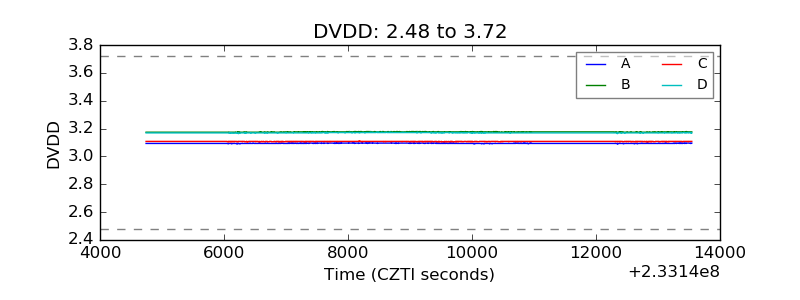 |
| Temperature 1 | 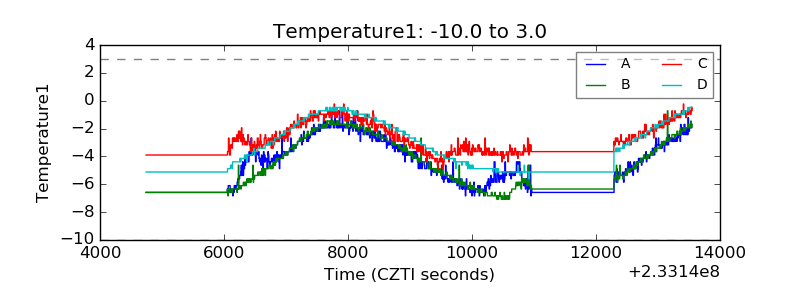 |
| Veto HV Monitor | 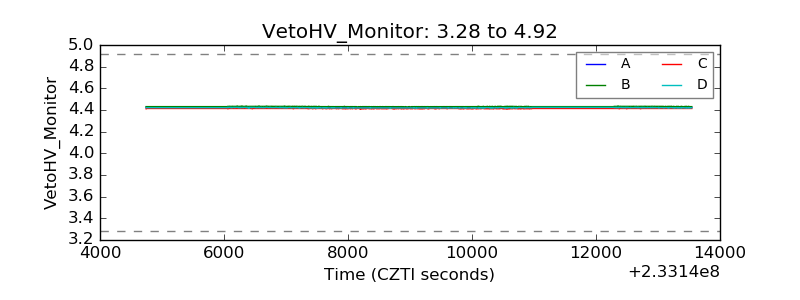 |
| Veto LLD | 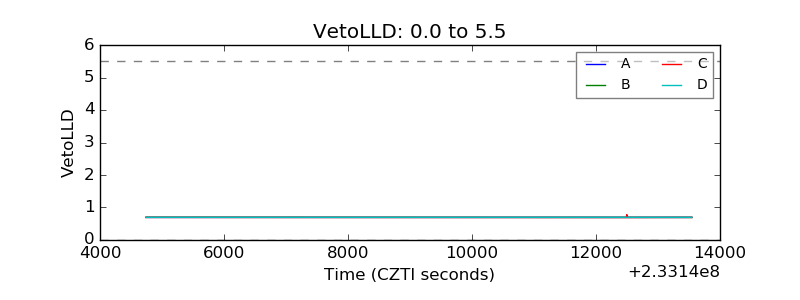 |
| Alpha Counter | 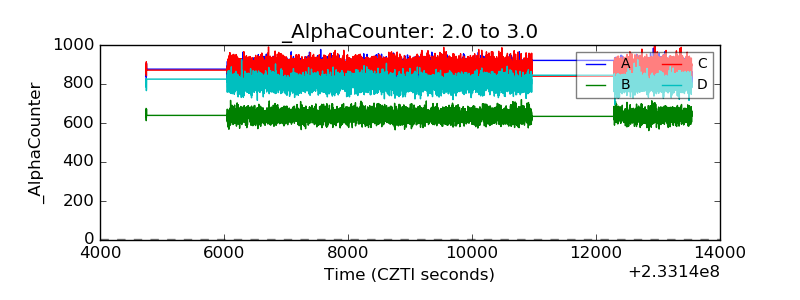 |
| _CPM_Rate | 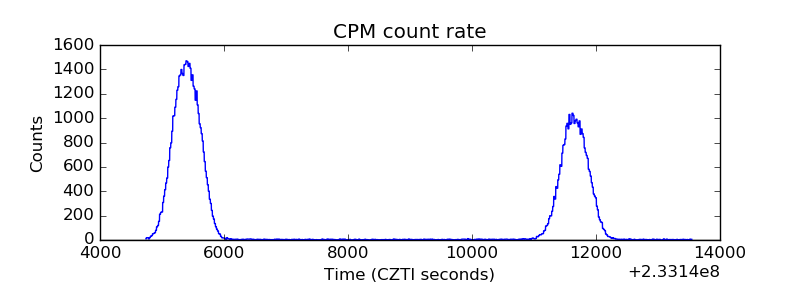 |
| CZT Counter | 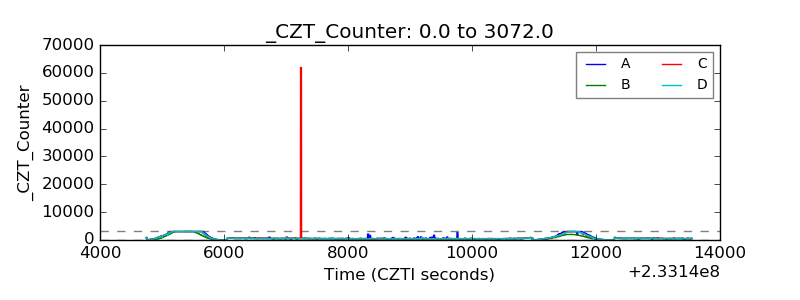 |
| +2.5 Volts monitor |  |
| +5 Volts monitor | 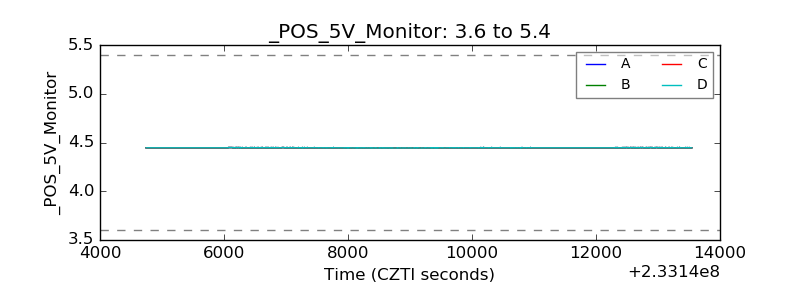 |
| _ROLL_ROT | 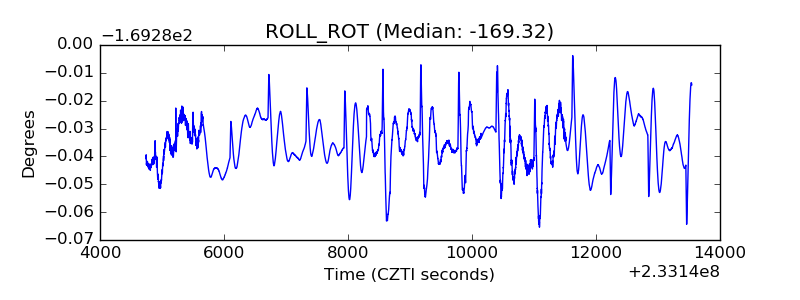 |
| _Roll_DEC | 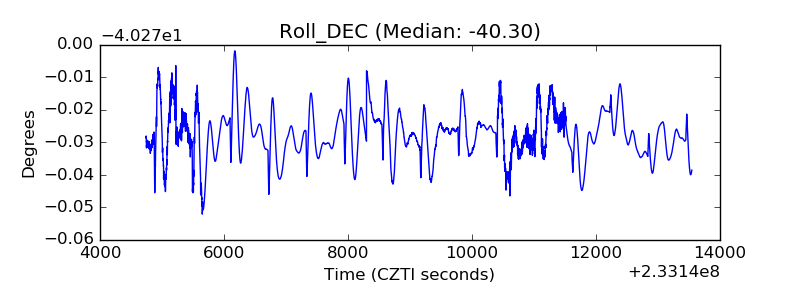 |
| _Roll_RA | 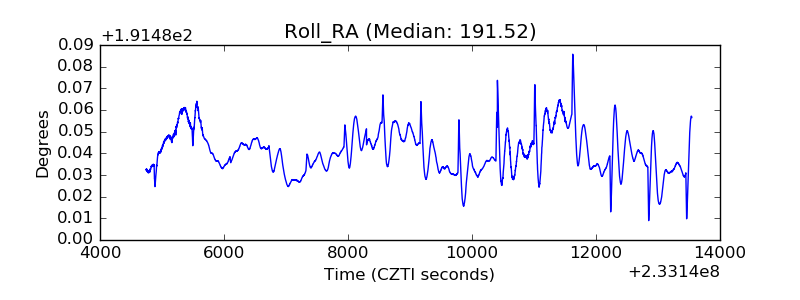 |
| Veto Counter | 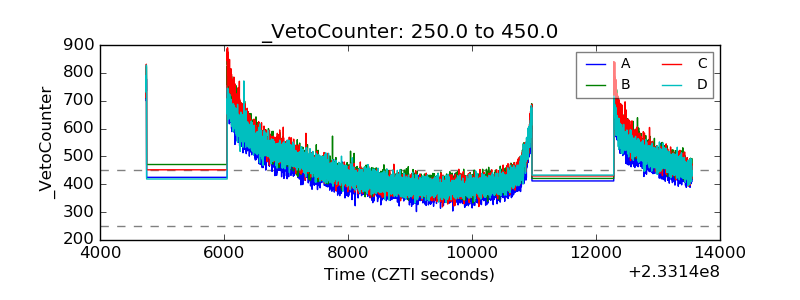 |