| Param | Original file | Final file |
|---|---|---|
| Filename | modeM0/AS1A03_092T01_9000001240_08917cztM0_level2.evt | modeM0/AS1A03_092T01_9000001240_08917cztM0_level2_quad_clean.evt |
| Size (bytes) | 433,748,160 | 104,601,600 |
| Size | 413.7 MB | 99.8 MB |
| Events in quadrant A | 3,287,277 | 691,018 |
| Events in quadrant B | 3,170,596 | 696,964 |
| Events in quadrant C | 2,972,437 | 676,845 |
| Events in quadrant D | 3,274,467 | 660,663 |
| Mode M9 | |||
|---|---|---|---|
| Quadrant | BADHDUFLAG | Total packets | Discarded packets |
| A | 0 | 12 | 0 |
| B | 0 | 12 | 0 |
| C | 0 | 12 | 0 |
| D | 0 | 12 | 0 |
| Mode SS | |||
|---|---|---|---|
| Quadrant | BADHDUFLAG | Total packets | Discarded packets |
| A | 0 | 128 | 0 |
| B | 0 | 128 | 0 |
| C | 0 | 128 | 0 |
| D | 0 | 128 | 0 |
| Mode M0 | |||
|---|---|---|---|
| Quadrant | BADHDUFLAG | Total packets | Discarded packets |
| A | 0 | 13748 | 5 |
| B | 0 | 13367 | 7 |
| C | 0 | 13113 | 5 |
| D | 0 | 13906 | 9 |
| Quadrant | Total seconds | Saturated seconds | Saturation percentage |
|---|---|---|---|
| A | 6344 | 136 | 2.143758% |
| B | 6342 | 117 | 1.844844% |
| C | 6343 | 79 | 1.245467% |
| D | 6342 | 121 | 1.907915% |
Noise dominated data is calculated using 1-second bins in cleaned event files. If a bin has >2000 counts, and if more than 50% of those come from <1% of pixels, then it is considered to be noise-dominated and hence unusable.
| Quadrant | # 1 sec bins | Bins with >0 counts | Bins with >2000 counts | High rate bins dominated by noise | Noise dominated (total time) | Noise dominated (detector-on time) | Marked lightcurve |
|---|---|---|---|---|---|---|---|
| A | 7520 | 6345 | 12 | 12 | 0.16% | 0.19% | 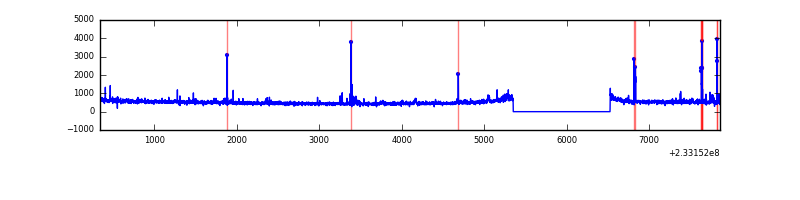 |
| B | 7520 | 6345 | 0 | 0 | 0.00% | 0.00% | 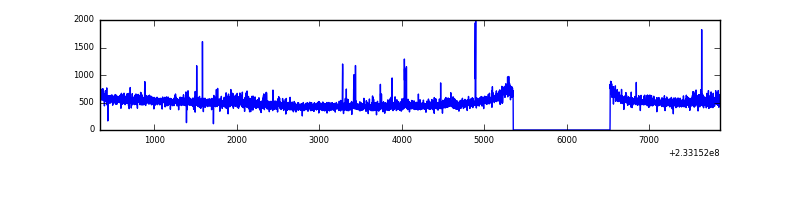 |
| C | 7520 | 6345 | 0 | 0 | 0.00% | 0.00% |  |
| D | 7520 | 6345 | 17 | 17 | 0.23% | 0.27% | 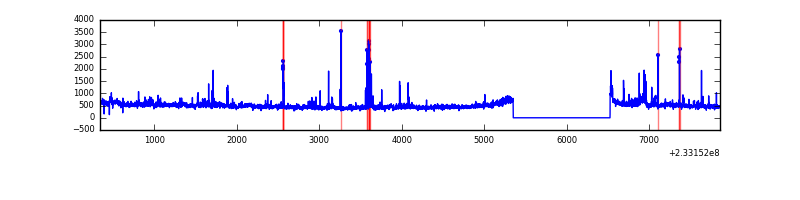 |
Top three noisy pixels from each quadrant. If the there are fewer than three noisy pixels in the level2.evt file, extra rows are filled as -1
| Pixel properties | Quadrant properties | ||||||
|---|---|---|---|---|---|---|---|
| Quadrant | DetID | PixID | Counts | Sigma | Mean | Median | Sigma |
| A | 8 | 5 | 148244 | 923.59 | 794 | 778 | 159.7 |
| A | 5 | 16 | 43391 | 266.89 | 794 | 778 | 159.7 |
| A | 15 | 174 | 28570 | 174.06 | 794 | 778 | 159.7 |
| B | 0 | 214 | 57504 | 382.23 | 791 | 775 | 148.4 |
| B | 12 | 111 | 15476 | 99.05 | 791 | 775 | 148.4 |
| B | 0 | 197 | 13838 | 88.02 | 791 | 775 | 148.4 |
| C | 13 | 61 | 5799 | 28.93 | 761 | 765 | 174.0 |
| C | 3 | 254 | 1988 | 7.03 | 761 | 765 | 174.0 |
| C | 14 | 67 | 1984 | 7.01 | 761 | 765 | 174.0 |
| D | 1 | 52 | 155150 | 763.25 | 765 | 746 | 202.3 |
| D | 8 | 195 | 66737 | 326.21 | 765 | 746 | 202.3 |
| D | 2 | 14 | 51386 | 250.32 | 765 | 746 | 202.3 |
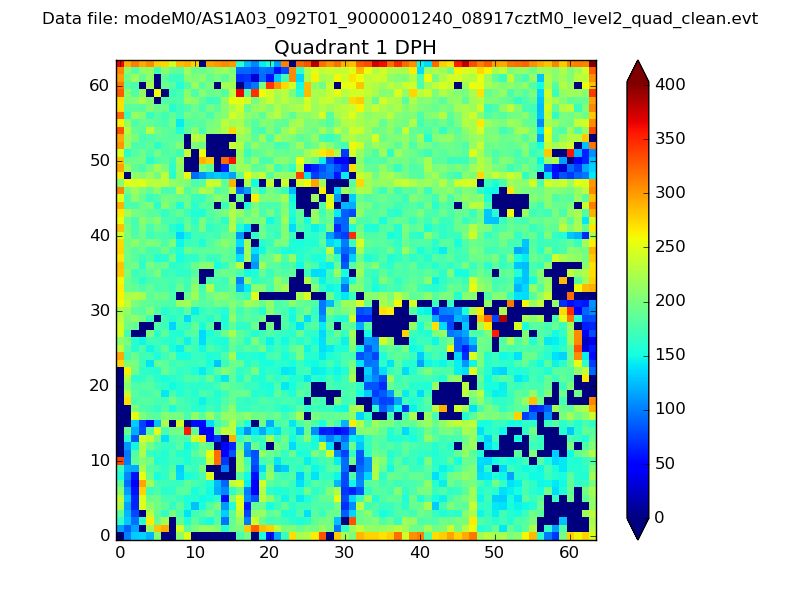
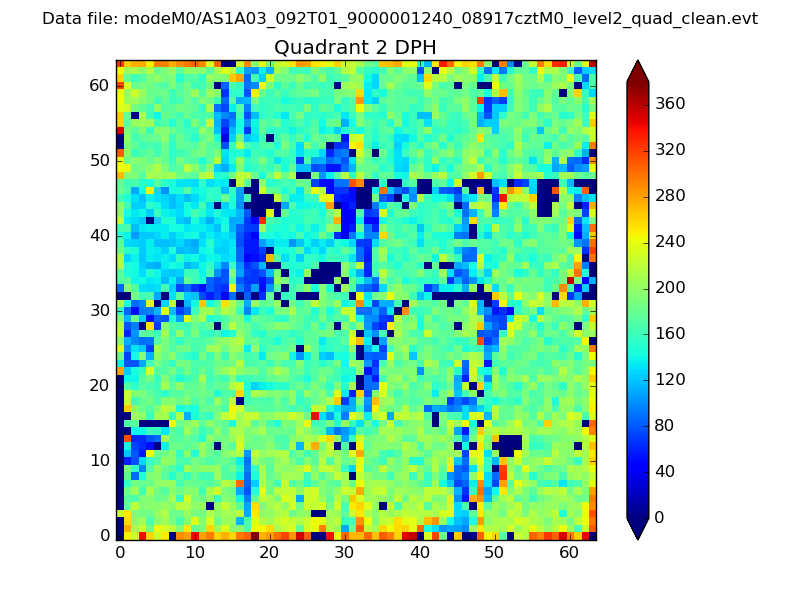
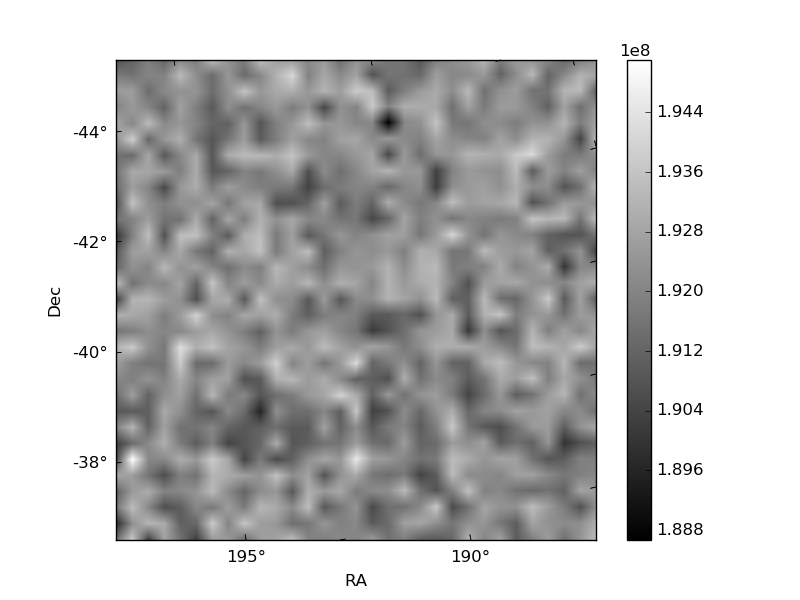
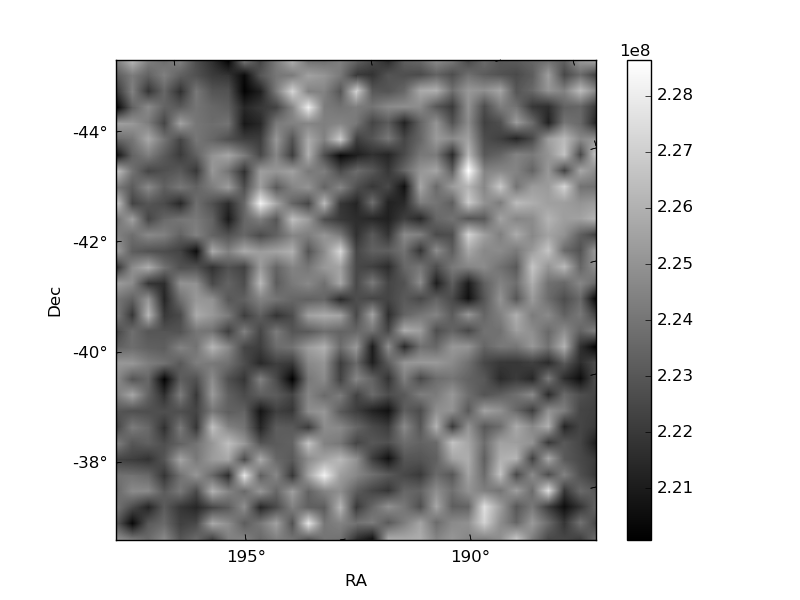
Histogram calculated using DETX and DETY for each event in the final _common_clean file
| Quadrant A | 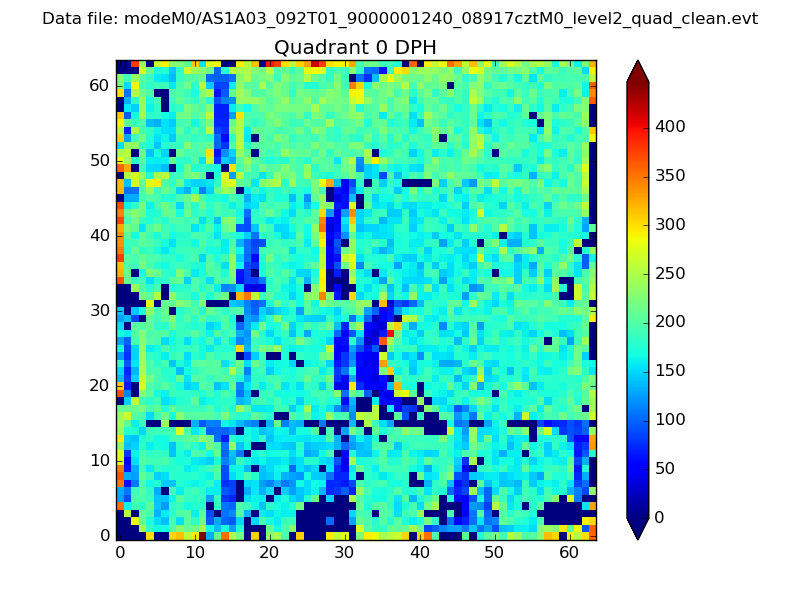 |
 |
Quadrant B |
|---|---|---|---|
| Quadrant D |  |
 |
Quadrant C |
| Plot type | Count rate plots | Images |
|---|---|---|
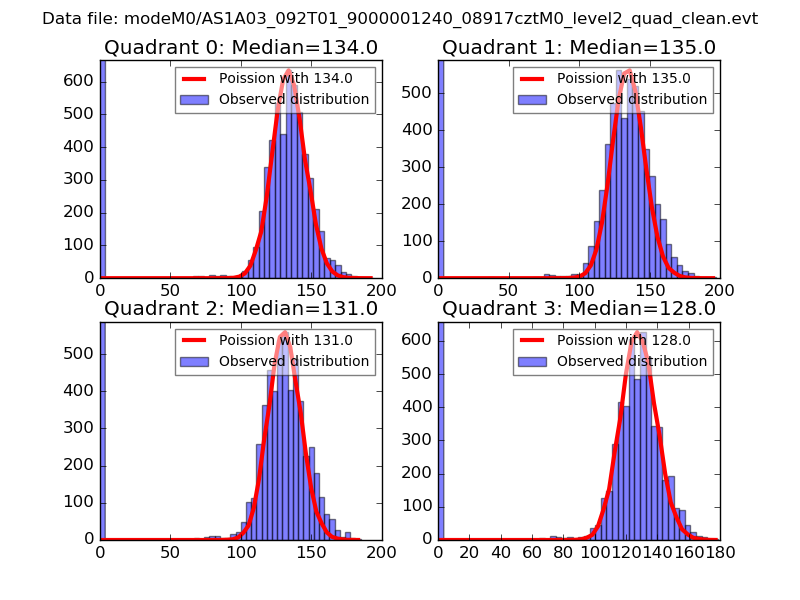
| Comparison with Poisson distribution Blue bars denote a histogram of data divided into 1 sec bins. Red curve is a Poisson curve with rate = median count rate of data. |
 |
 |
| Quadrant-wise count rates Data is divided into 100 sec bins |
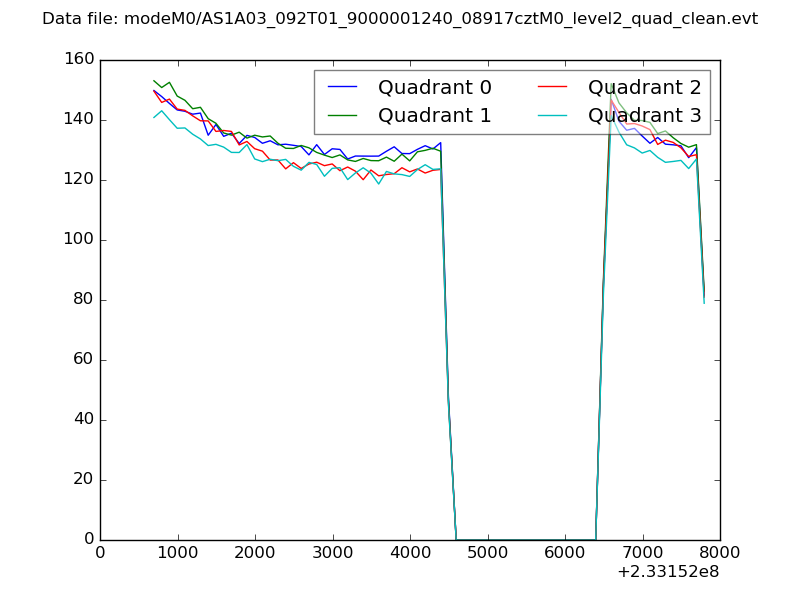 |
|
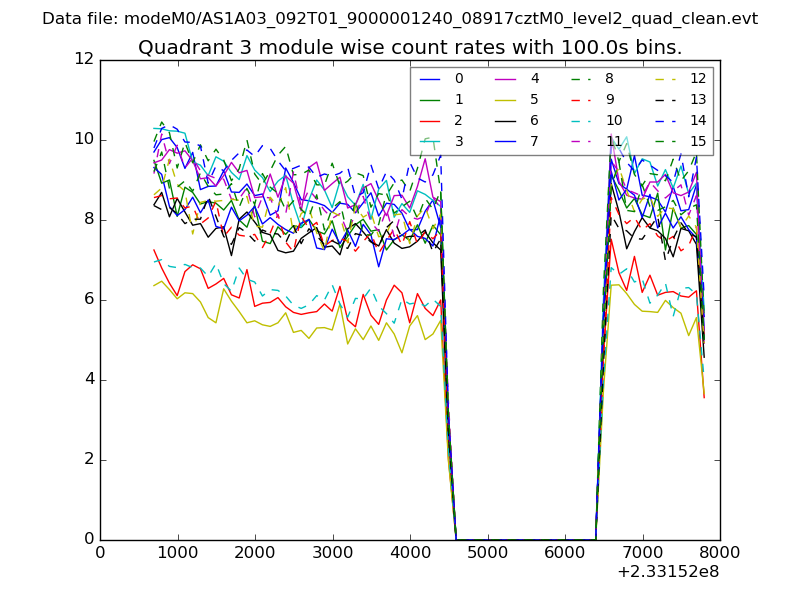
| Module-wise count rates for Quadrant A Data is divided into 100 sec bins |
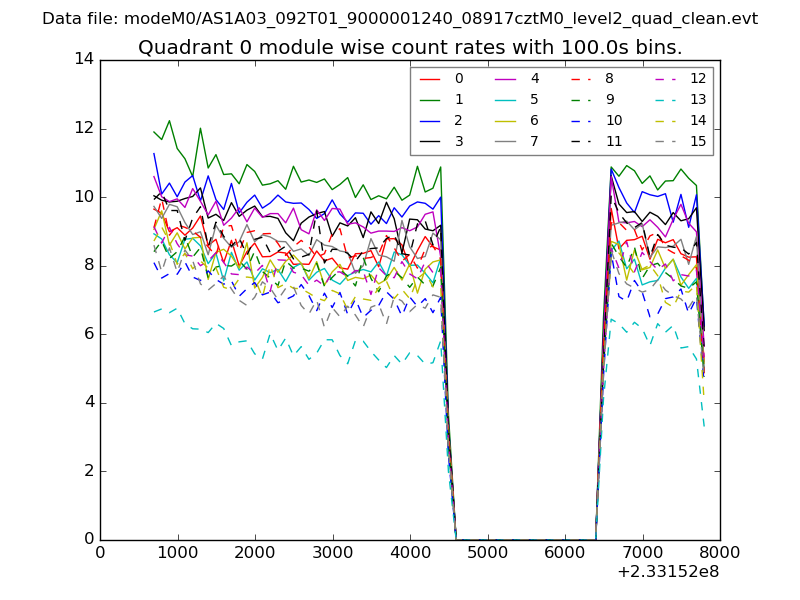 |
 |
| Module-wise count rates for Quadrant B Data is divided into 100 sec bins |
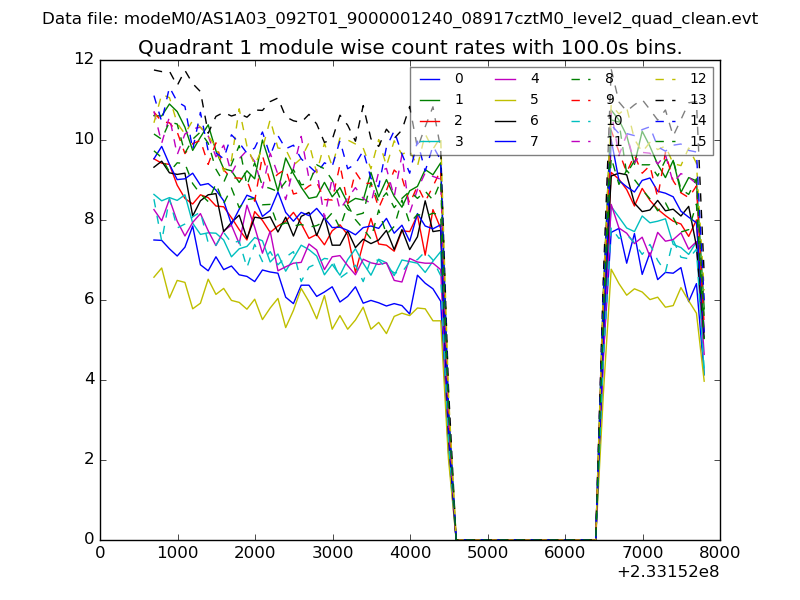 |
 |
| Module-wise count rates for Quadrant C Data is divided into 100 sec bins |
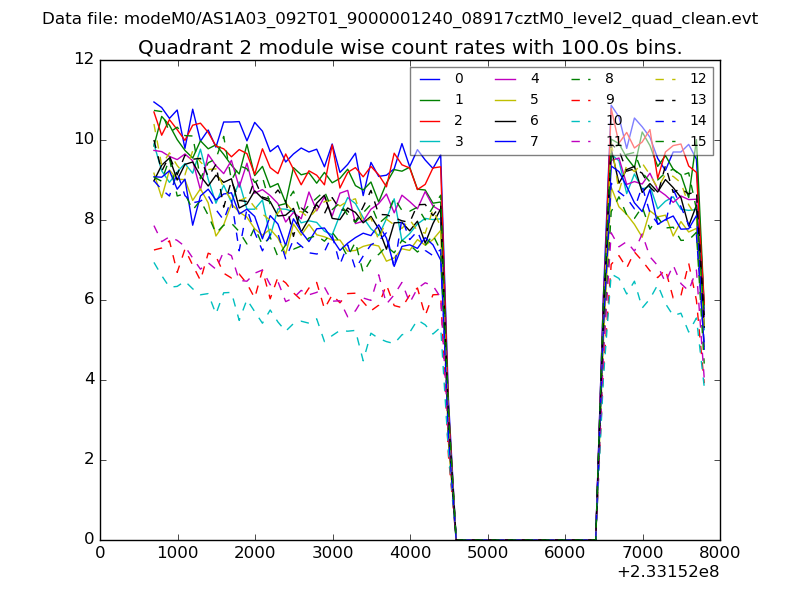 |
 |
| Module-wise count rates for Quadrant D Data is divided into 100 sec bins |
 |
 |
| Parameter | Plot |
|---|---|
| CZT HV Monitor | 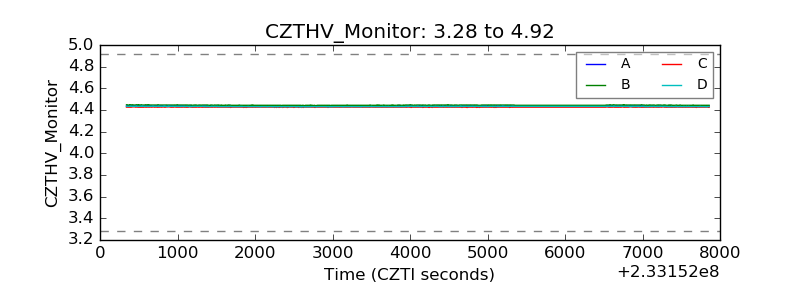 |
| D_VDD | 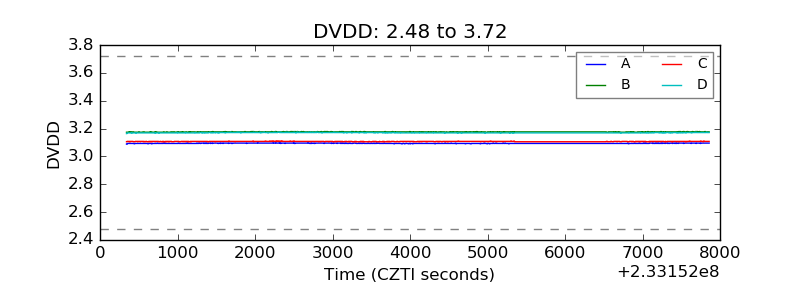 |
| Temperature 1 | 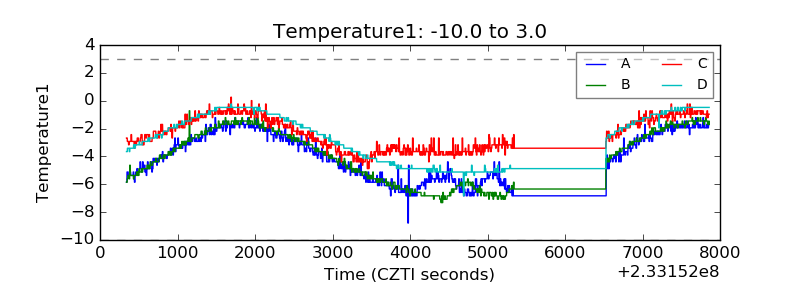 |
| Veto HV Monitor | 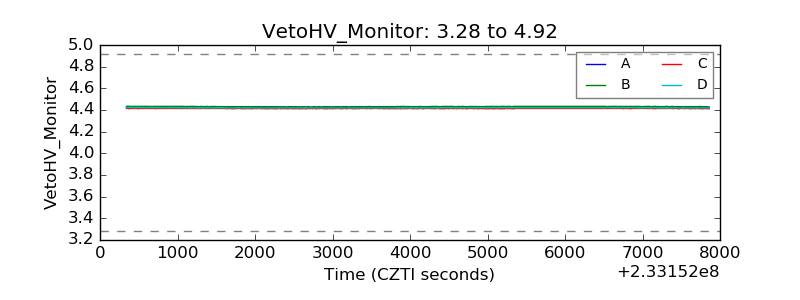 |
| Veto LLD | 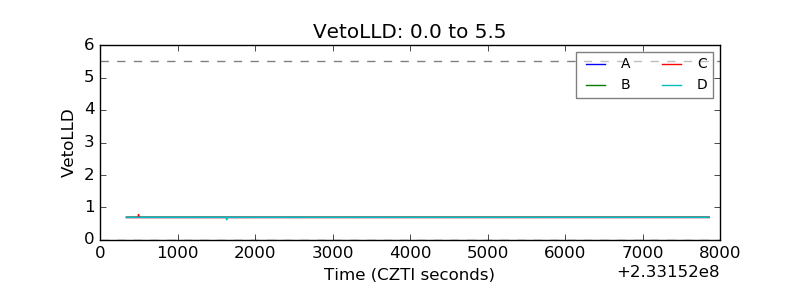 |
| Alpha Counter | 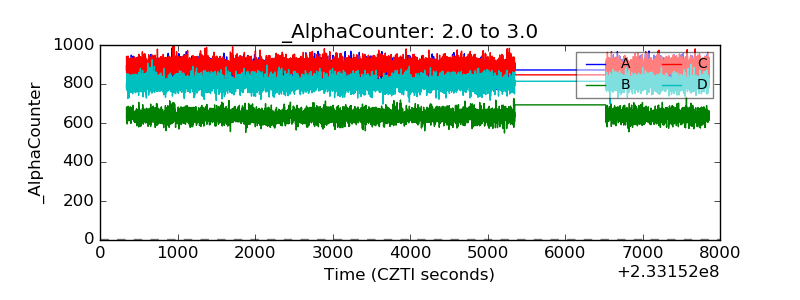 |
| _CPM_Rate | 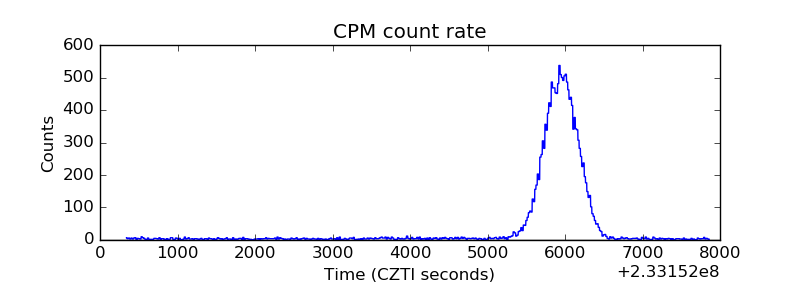 |
| CZT Counter | 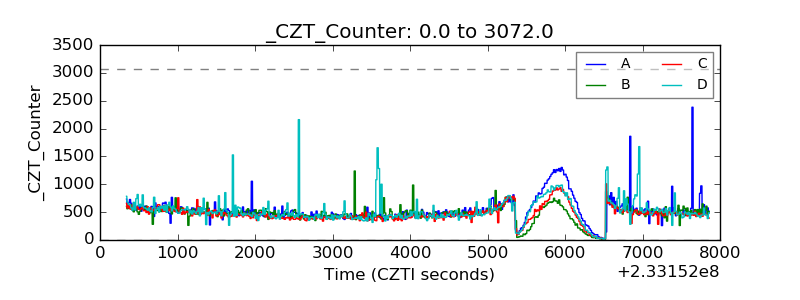 |
| +2.5 Volts monitor |  |
| +5 Volts monitor | 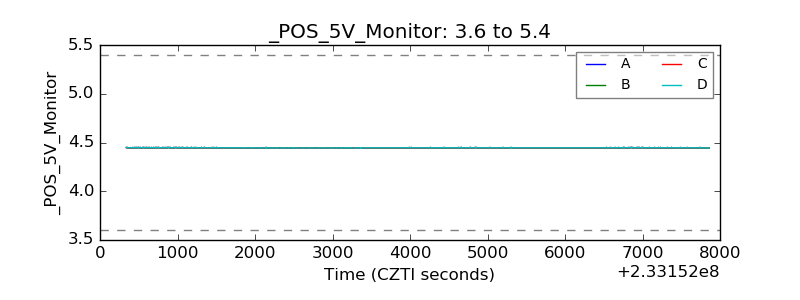 |
| _ROLL_ROT | 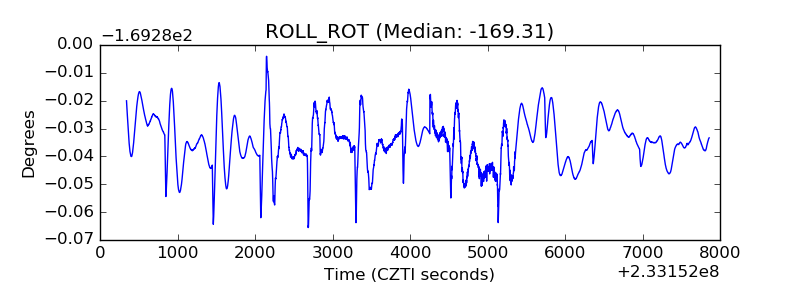 |
| _Roll_DEC | 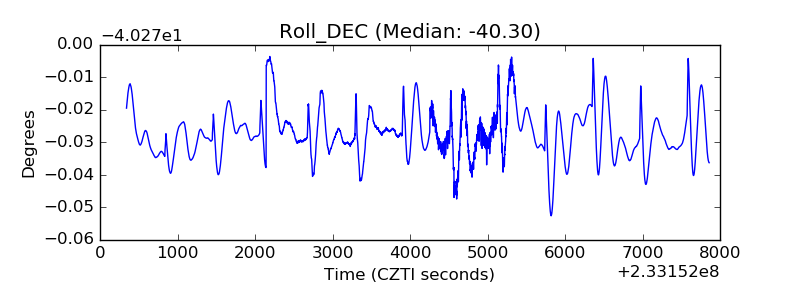 |
| _Roll_RA | 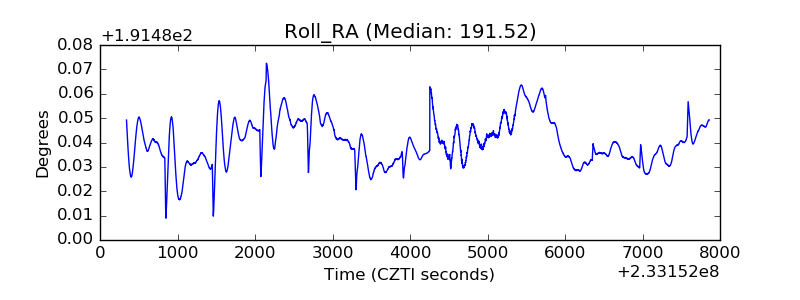 |
| Veto Counter | 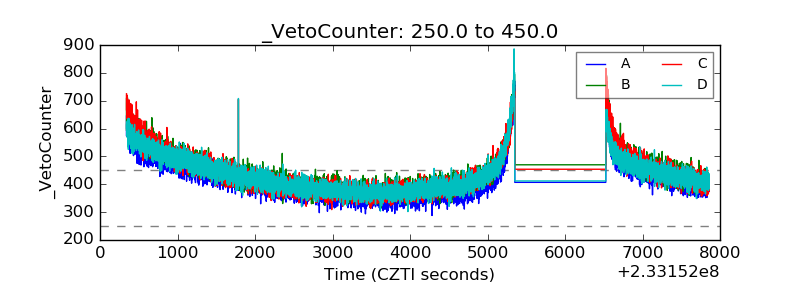 |