| Param | Original file | Final file |
|---|---|---|
| Filename | modeM0/AS1A03_092T01_9000001240_08918cztM0_level2.evt | modeM0/AS1A03_092T01_9000001240_08918cztM0_level2_quad_clean.evt |
| Size (bytes) | 436,438,080 | 100,670,400 |
| Size | 416.2 MB | 96.0 MB |
| Events in quadrant A | 3,298,599 | 658,668 |
| Events in quadrant B | 3,241,138 | 661,451 |
| Events in quadrant C | 2,953,971 | 639,937 |
| Events in quadrant D | 3,274,722 | 628,354 |
| Mode M9 | |||
|---|---|---|---|
| Quadrant | BADHDUFLAG | Total packets | Discarded packets |
| A | 0 | 9 | 0 |
| B | 0 | 9 | 0 |
| C | 0 | 9 | 0 |
| D | 0 | 9 | 0 |
| Mode SS | |||
|---|---|---|---|
| Quadrant | BADHDUFLAG | Total packets | Discarded packets |
| A | 0 | 134 | 0 |
| B | 0 | 134 | 0 |
| C | 0 | 134 | 0 |
| D | 0 | 134 | 0 |
| Mode M0 | |||
|---|---|---|---|
| Quadrant | BADHDUFLAG | Total packets | Discarded packets |
| A | 0 | 14024 | 2 |
| B | 0 | 13852 | 1 |
| C | 0 | 13508 | 1 |
| D | 0 | 14378 | 1 |
| Quadrant | Total seconds | Saturated seconds | Saturation percentage |
|---|---|---|---|
| A | 6603 | 115 | 1.741633% |
| B | 6603 | 85 | 1.287294% |
| C | 6603 | 52 | 0.787521% |
| D | 6603 | 101 | 1.529608% |
Noise dominated data is calculated using 1-second bins in cleaned event files. If a bin has >2000 counts, and if more than 50% of those come from <1% of pixels, then it is considered to be noise-dominated and hence unusable.
| Quadrant | # 1 sec bins | Bins with >0 counts | Bins with >2000 counts | High rate bins dominated by noise | Noise dominated (total time) | Noise dominated (detector-on time) | Marked lightcurve |
|---|---|---|---|---|---|---|---|
| A | 7538 | 6603 | 10 | 10 | 0.13% | 0.15% | 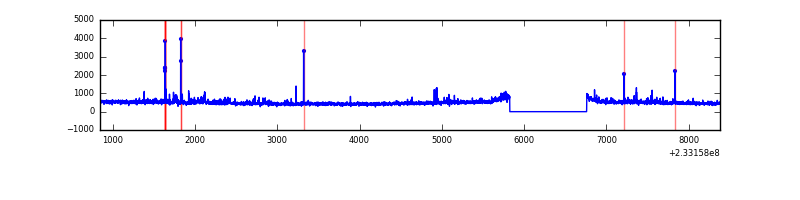 |
| B | 7538 | 6603 | 5 | 5 | 0.07% | 0.08% | 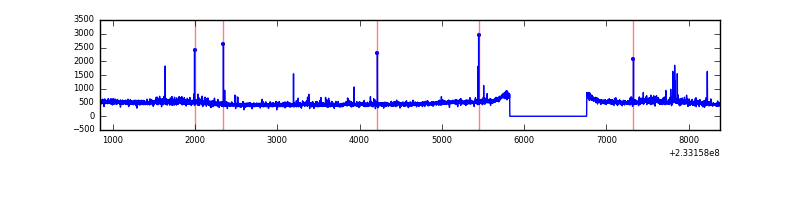 |
| C | 7538 | 6603 | 0 | 0 | 0.00% | 0.00% |  |
| D | 7538 | 6603 | 44 | 44 | 0.58% | 0.67% | 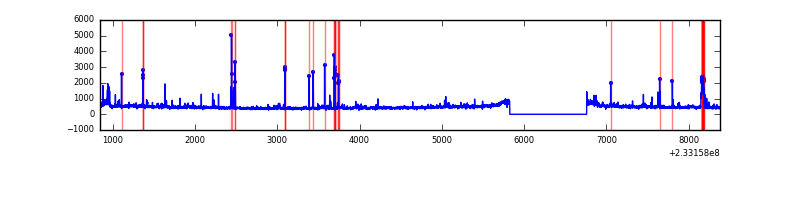 |
Top three noisy pixels from each quadrant. If the there are fewer than three noisy pixels in the level2.evt file, extra rows are filled as -1
| Pixel properties | Quadrant properties | ||||||
|---|---|---|---|---|---|---|---|
| Quadrant | DetID | PixID | Counts | Sigma | Mean | Median | Sigma |
| A | 8 | 5 | 175836 | 1085.9 | 793 | 775 | 161.2 |
| A | 5 | 16 | 44697 | 272.45 | 793 | 775 | 161.2 |
| A | 15 | 174 | 16747 | 99.07 | 793 | 775 | 161.2 |
| B | 0 | 214 | 113533 | 750.01 | 791 | 773 | 150.3 |
| B | 12 | 111 | 15246 | 96.26 | 791 | 773 | 150.3 |
| B | 0 | 219 | 12456 | 77.71 | 791 | 773 | 150.3 |
| C | 9 | 68 | 7311 | 37.74 | 755 | 757 | 173.7 |
| C | 13 | 61 | 5804 | 29.06 | 755 | 757 | 173.7 |
| C | 3 | 202 | 1827 | 6.16 | 755 | 757 | 173.7 |
| D | 1 | 52 | 156636 | 763.2 | 759 | 742 | 204.3 |
| D | 7 | 71 | 95939 | 466.05 | 759 | 742 | 204.3 |
| D | 2 | 14 | 63998 | 309.68 | 759 | 742 | 204.3 |
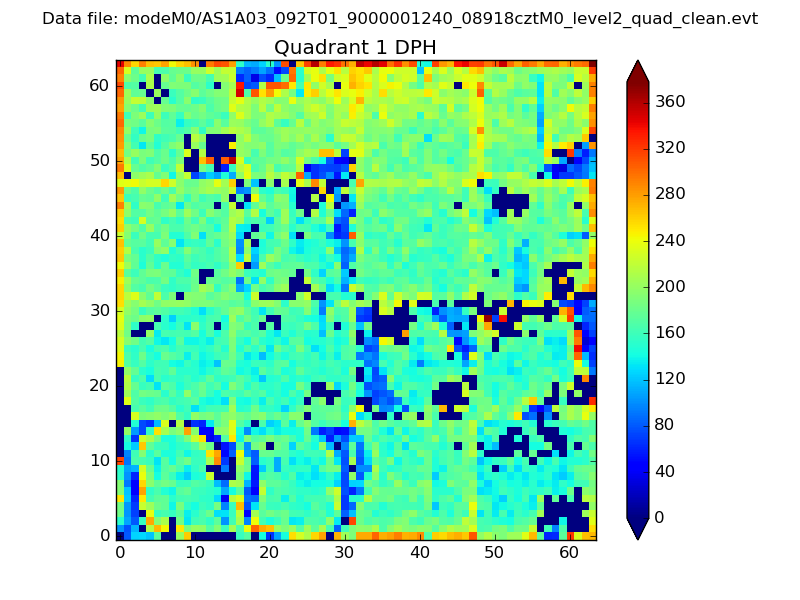
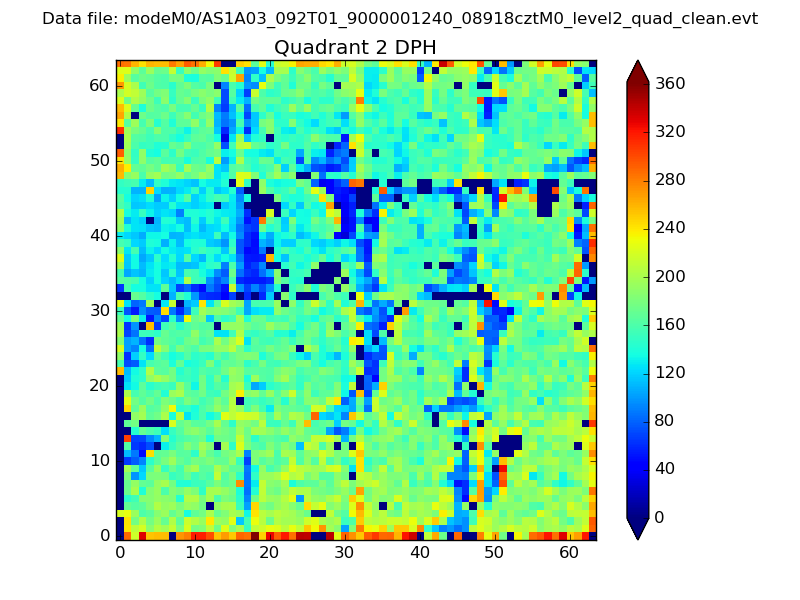
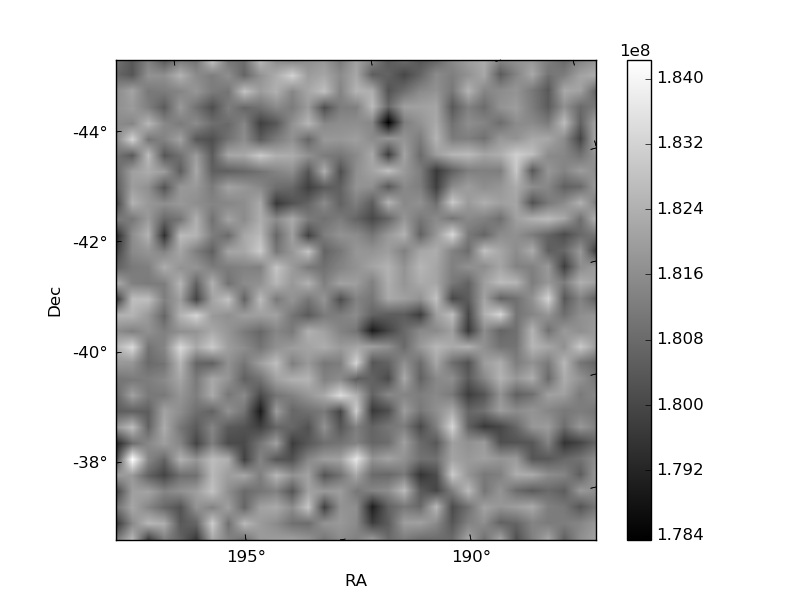
Histogram calculated using DETX and DETY for each event in the final _common_clean file
| Quadrant A | 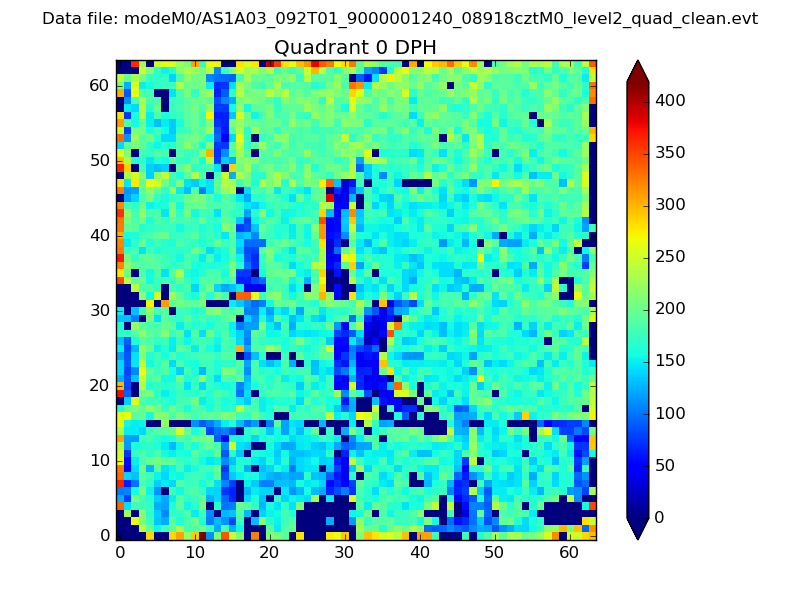 |
 |
Quadrant B |
|---|---|---|---|
| Quadrant D | 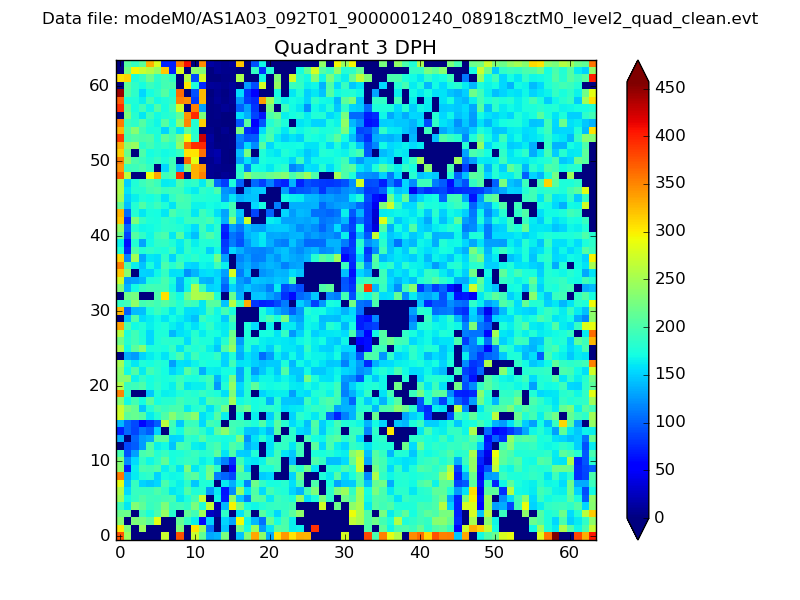 |
 |
Quadrant C |
| Plot type | Count rate plots | Images |
|---|---|---|
| Comparison with Poisson distribution Blue bars denote a histogram of data divided into 1 sec bins. Red curve is a Poisson curve with rate = median count rate of data. |
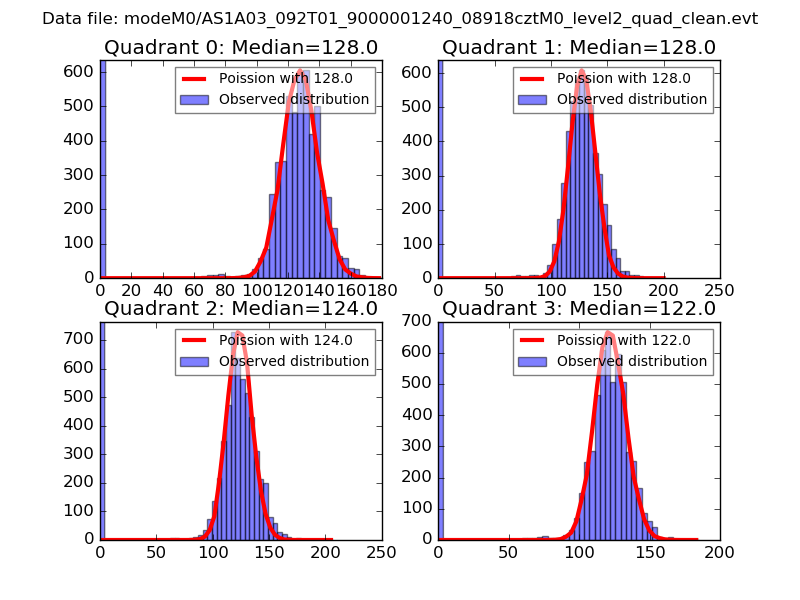 |
 |
| Quadrant-wise count rates Data is divided into 100 sec bins |
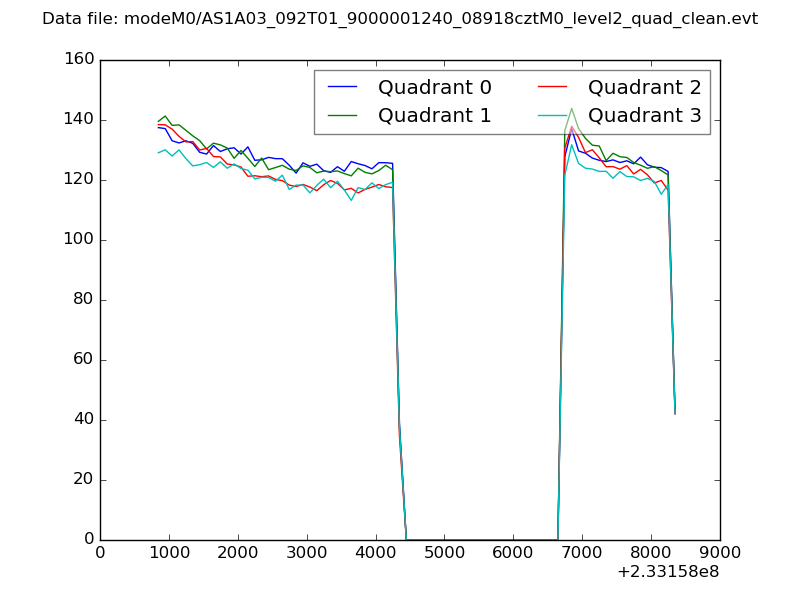 |
|
| Module-wise count rates for Quadrant A Data is divided into 100 sec bins |
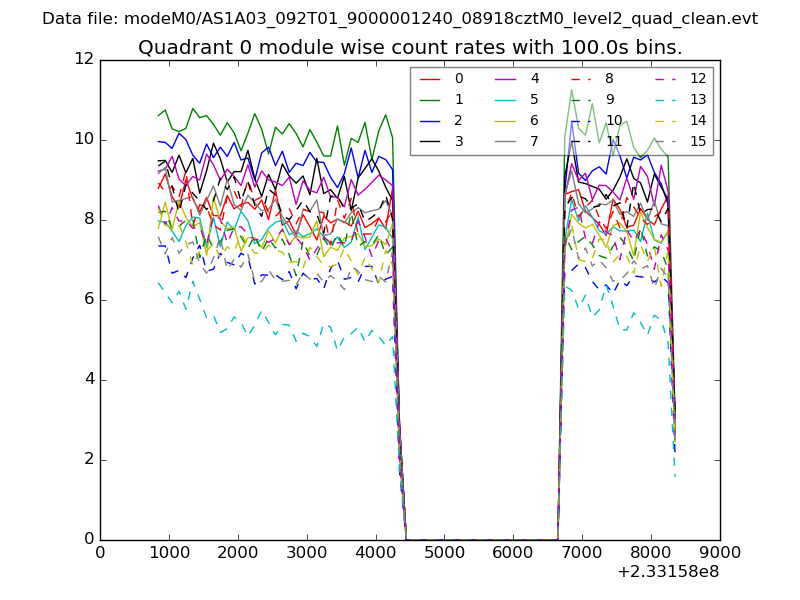 |
 |
| Module-wise count rates for Quadrant B Data is divided into 100 sec bins |
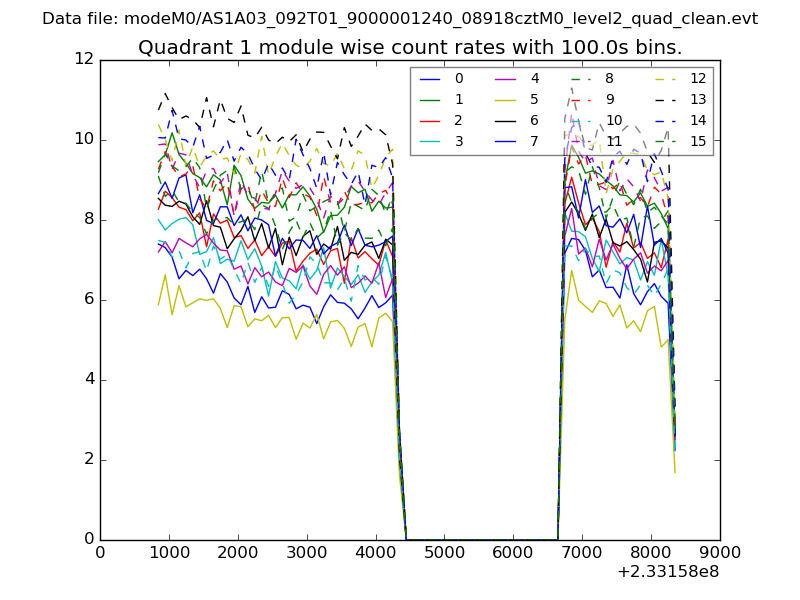 |
 |
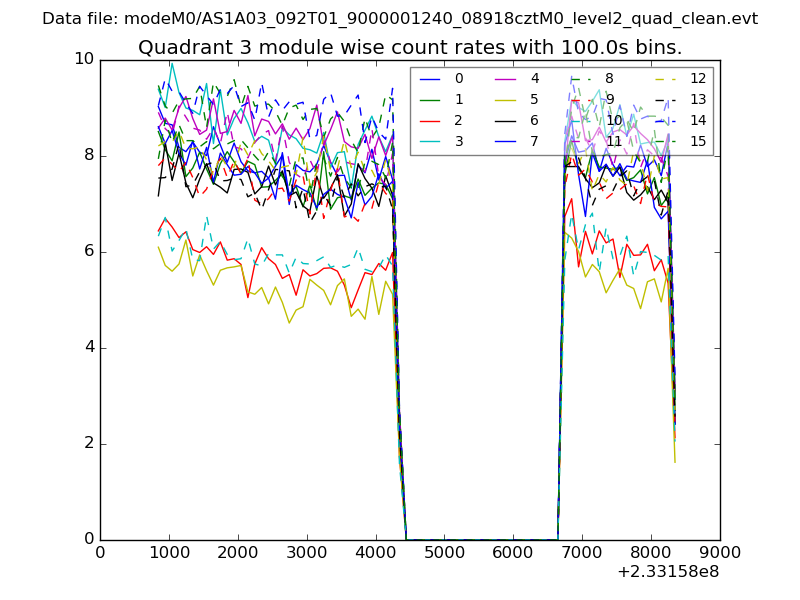
| Module-wise count rates for Quadrant C Data is divided into 100 sec bins |
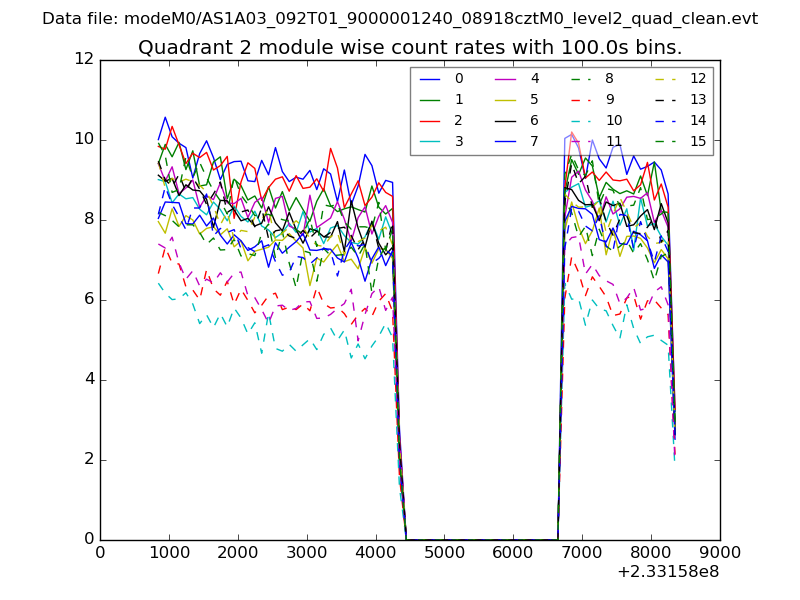 |
 |
| Module-wise count rates for Quadrant D Data is divided into 100 sec bins |
 |
 |
| Parameter | Plot |
|---|---|
| CZT HV Monitor | 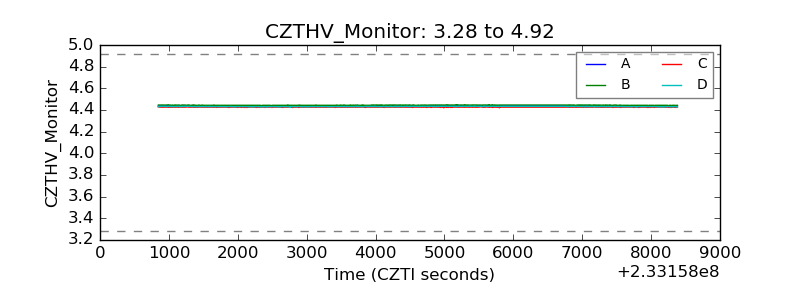 |
| D_VDD | 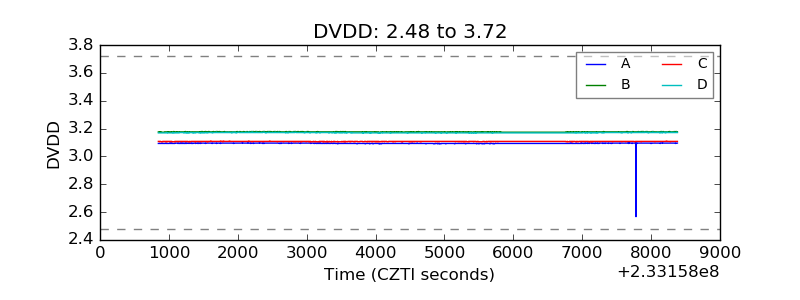 |
| Temperature 1 | 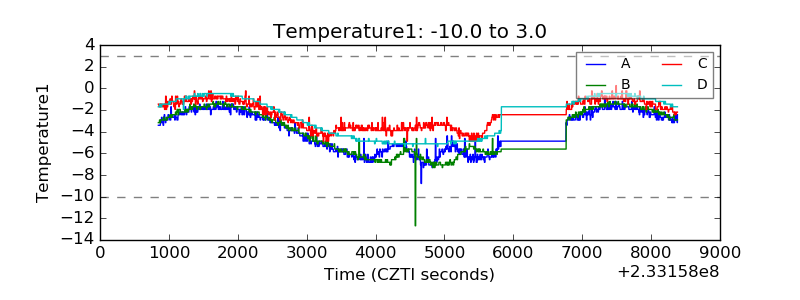 |
| Veto HV Monitor | 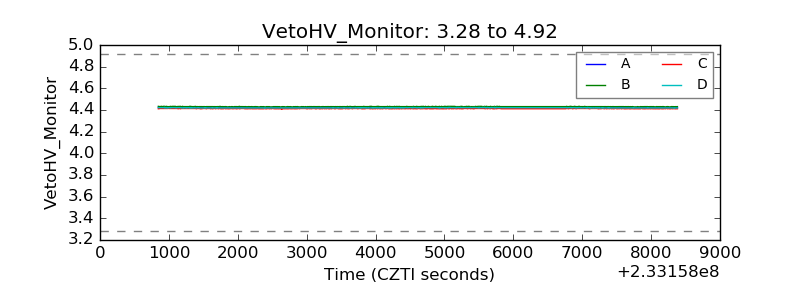 |
| Veto LLD | 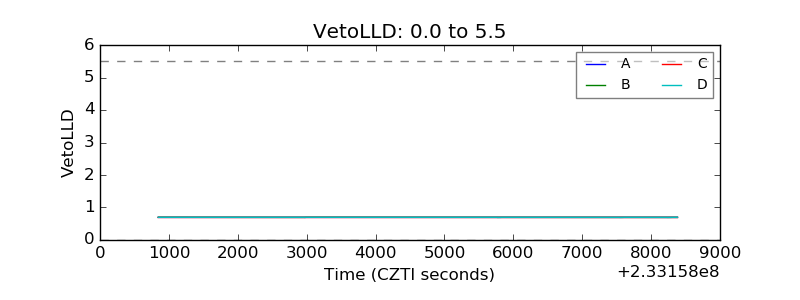 |
| Alpha Counter | 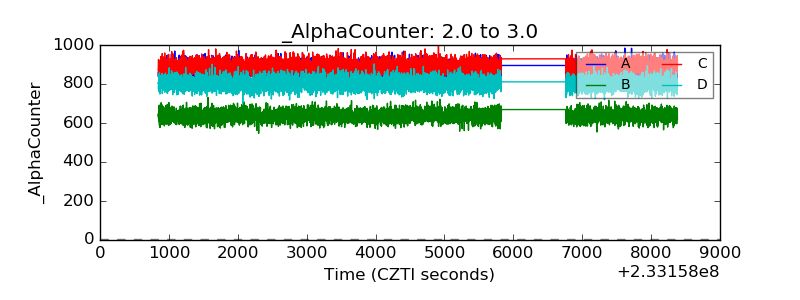 |
| _CPM_Rate | 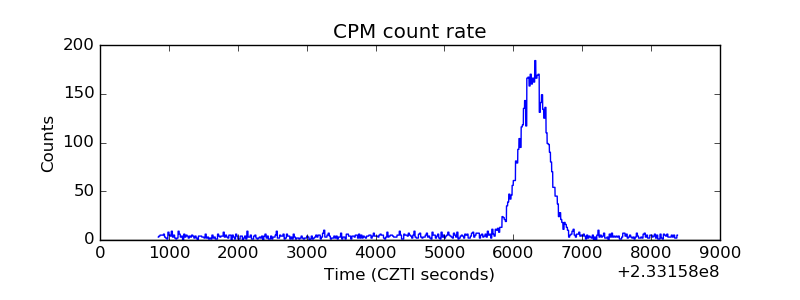 |
| CZT Counter | 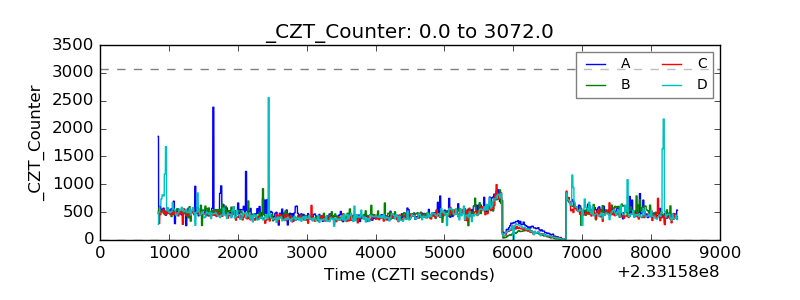 |
| +2.5 Volts monitor |  |
| +5 Volts monitor |  |
| _ROLL_ROT | 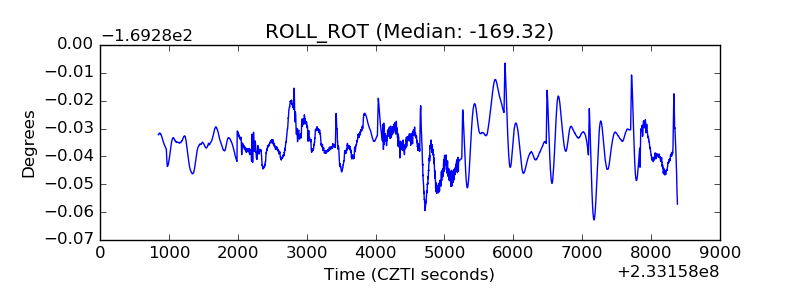 |
| _Roll_DEC | 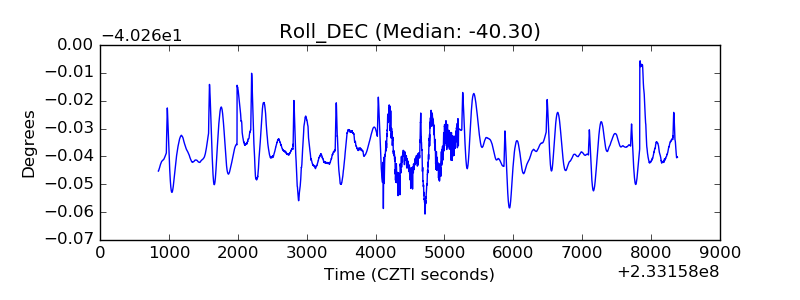 |
| _Roll_RA | 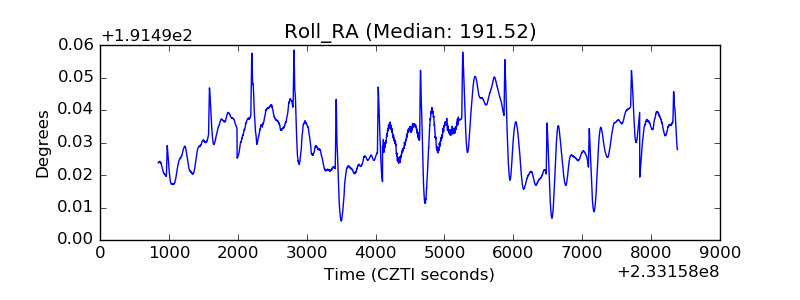 |
| Veto Counter | 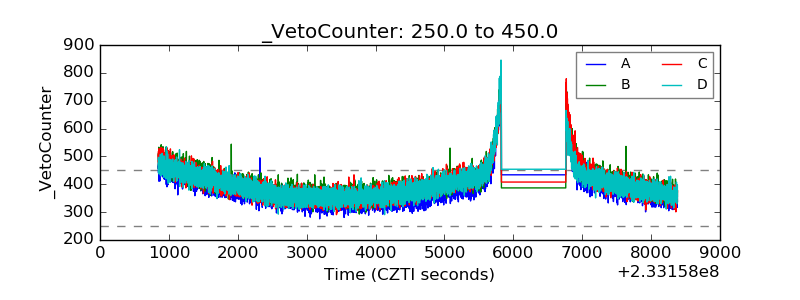 |