| Param | Original file | Final file |
|---|---|---|
| Filename | modeM0/AS1A03_092T01_9000001240_08919cztM0_level2.evt | modeM0/AS1A03_092T01_9000001240_08919cztM0_level2_quad_clean.evt |
| Size (bytes) | 16,367,040 | 4,832,640 |
| Size | 15.6 MB | 4.6 MB |
| Events in quadrant A | 129,677 | 31,003 |
| Events in quadrant B | 116,432 | 30,946 |
| Events in quadrant C | 99,685 | 28,882 |
| Events in quadrant D | 129,107 | 29,151 |
| Mode M9 | |||
|---|---|---|---|
| Quadrant | BADHDUFLAG | Total packets | Discarded packets |
| A | 0 | 1 | 1 |
| B | 1 | 1 | 1 |
| C | 1 | -1 | -1 |
| D | 1 | -1 | -1 |
| Mode SS | |||
|---|---|---|---|
| Quadrant | BADHDUFLAG | Total packets | Discarded packets |
| A | 0 | 14 | 8 |
| B | 0 | 12 | 8 |
| C | 0 | 11 | 7 |
| D | 0 | 12 | 6 |
| Mode M0 | |||
|---|---|---|---|
| Quadrant | BADHDUFLAG | Total packets | Discarded packets |
| A | 0 | 1250 | 721 |
| B | 0 | 1232 | 721 |
| C | 0 | 1226 | 740 |
| D | 0 | 1414 | 874 |
| Quadrant | Total seconds | Saturated seconds | Saturation percentage |
|---|---|---|---|
| A | 255 | 1 | 0.392157% |
| B | 253 | 0 | 0.000000% |
| C | 243 | 0 | 0.000000% |
| D | 246 | 0 | 0.000000% |
Noise dominated data is calculated using 1-second bins in cleaned event files. If a bin has >2000 counts, and if more than 50% of those come from <1% of pixels, then it is considered to be noise-dominated and hence unusable.
| Quadrant | # 1 sec bins | Bins with >0 counts | Bins with >2000 counts | High rate bins dominated by noise | Noise dominated (total time) | Noise dominated (detector-on time) | Marked lightcurve |
|---|---|---|---|---|---|---|---|
| A | 394 | 328 | 0 | 0 | 0.00% | 0.00% | 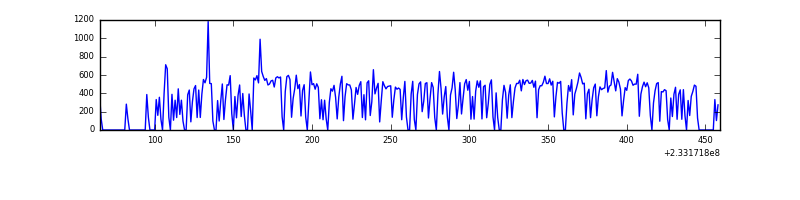 |
| B | 359 | 324 | 0 | 0 | 0.00% | 0.00% | 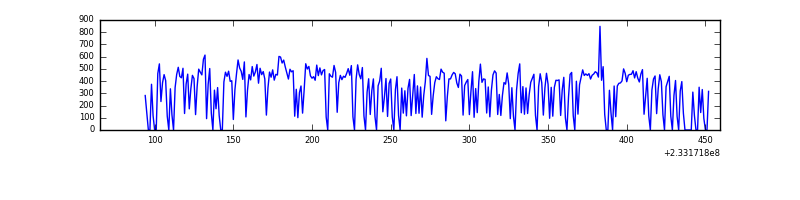 |
| C | 385 | 320 | 0 | 0 | 0.00% | 0.00% | 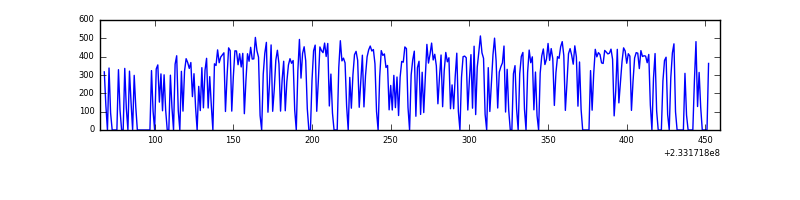 |
| D | 377 | 320 | 1 | 1 | 0.27% | 0.31% | 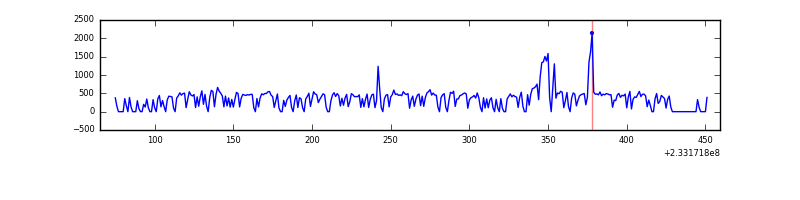 |
Top three noisy pixels from each quadrant. If the there are fewer than three noisy pixels in the level2.evt file, extra rows are filled as -1
| Pixel properties | Quadrant properties | ||||||
|---|---|---|---|---|---|---|---|
| Quadrant | DetID | PixID | Counts | Sigma | Mean | Median | Sigma |
| A | 8 | 5 | 18290 | 2285.48 | 28 | 28 | 8.0 |
| A | 12 | 194 | 246 | 27.28 | 28 | 28 | 8.0 |
| A | 0 | 226 | 246 | 27.28 | 28 | 28 | 8.0 |
| B | 0 | 213 | 1797 | 227.77 | 28 | 28 | 7.8 |
| B | 0 | 214 | 1711 | 216.7 | 28 | 28 | 7.8 |
| B | 4 | 173 | 1392 | 175.62 | 28 | 28 | 7.8 |
| C | 13 | 61 | 203 | 22.73 | 25 | 25 | 7.8 |
| C | 9 | 68 | 66 | 5.24 | 25 | 25 | 7.8 |
| C | -1 | -1 | -1 | -1.0 | 25 | 25 | 7.8 |
| D | 8 | 195 | 9751 | 1145.99 | 26 | 25 | 8.5 |
| D | 2 | 14 | 9543 | 1121.49 | 26 | 25 | 8.5 |
| D | 1 | 52 | 6414 | 752.8 | 26 | 25 | 8.5 |
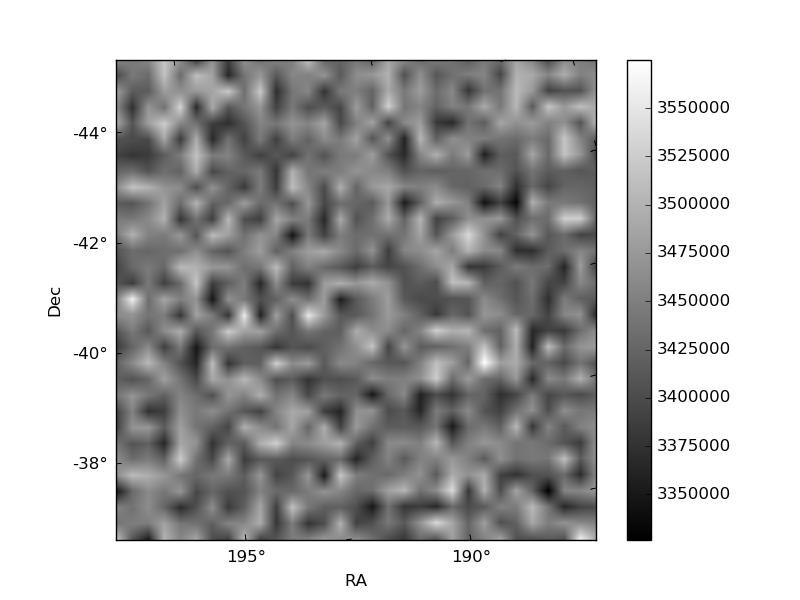
Histogram calculated using DETX and DETY for each event in the final _common_clean file
| Quadrant A |  |
 |
Quadrant B |
|---|---|---|---|
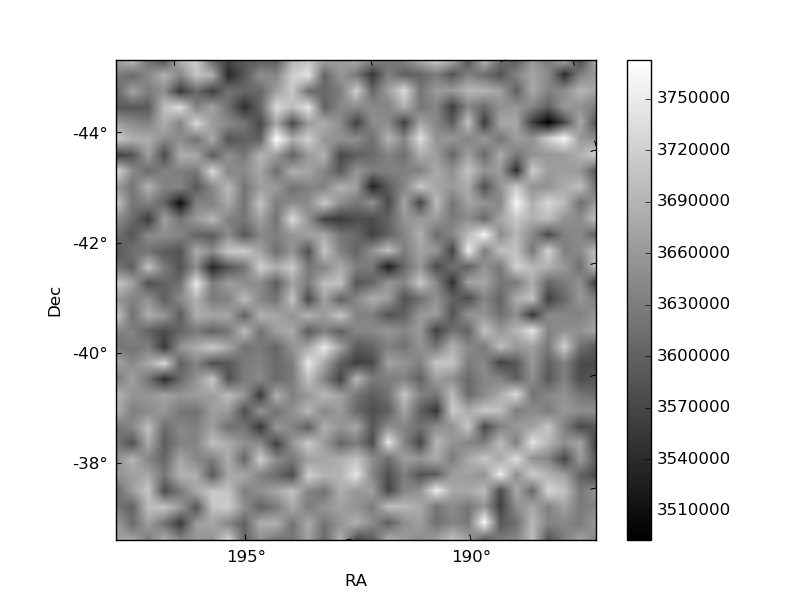
| Quadrant D | 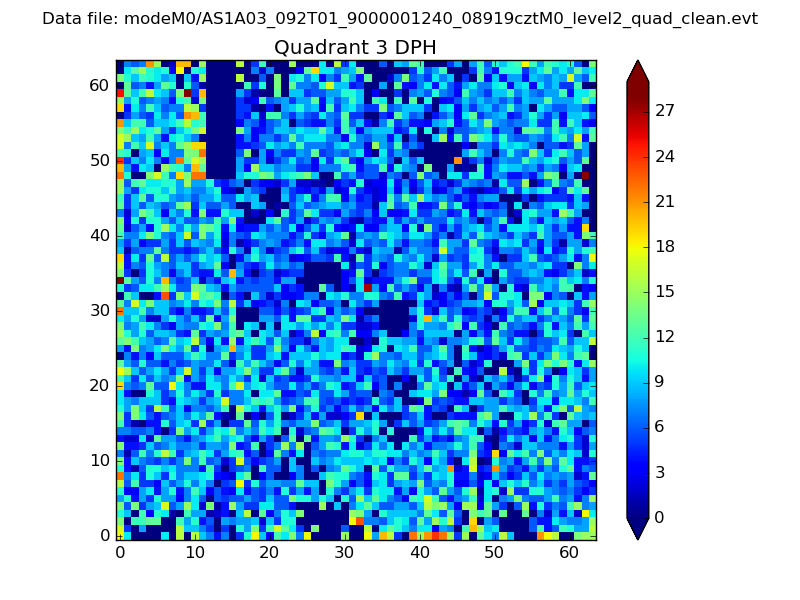 |
 |
Quadrant C |
| Plot type | Count rate plots | Images |
|---|---|---|
| Comparison with Poisson distribution Blue bars denote a histogram of data divided into 1 sec bins. Red curve is a Poisson curve with rate = median count rate of data. |
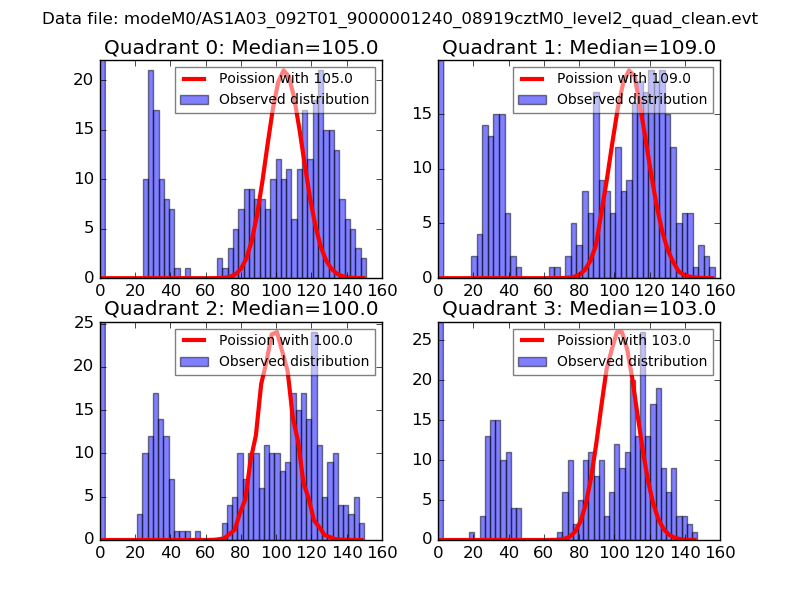 |
 |
| Quadrant-wise count rates Data is divided into 100 sec bins |
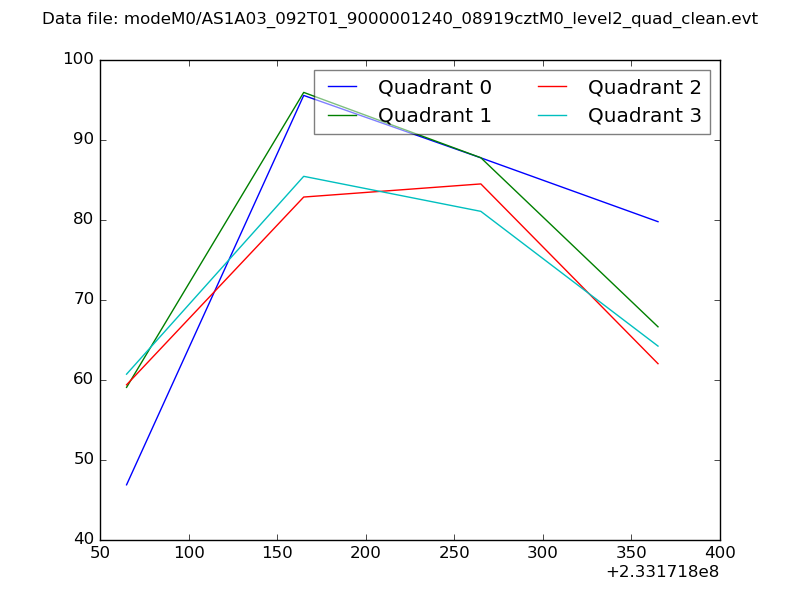 |
|
| Module-wise count rates for Quadrant A Data is divided into 100 sec bins |
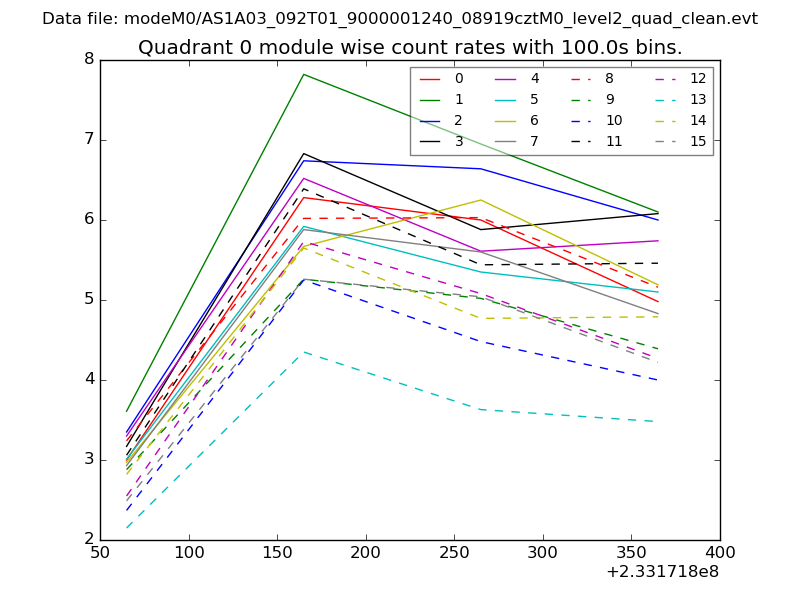 |
 |
| Module-wise count rates for Quadrant B Data is divided into 100 sec bins |
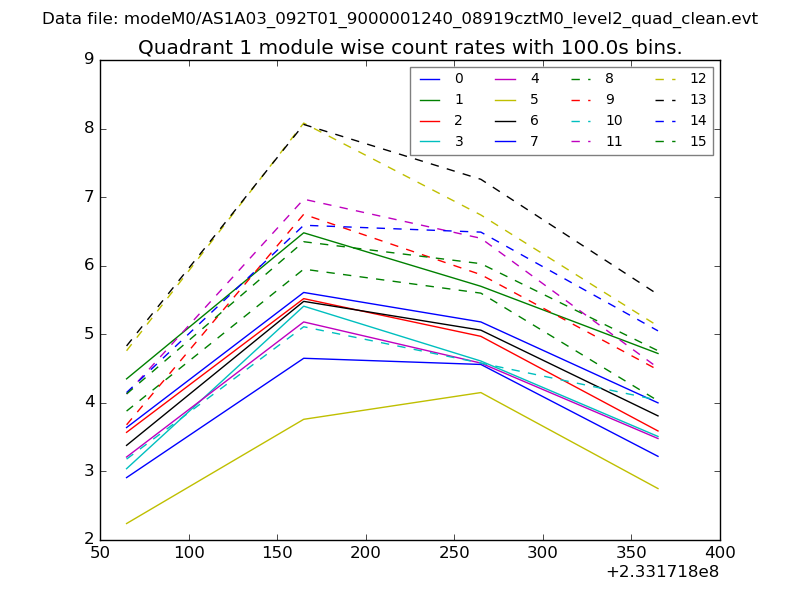 |
 |
| Module-wise count rates for Quadrant C Data is divided into 100 sec bins |
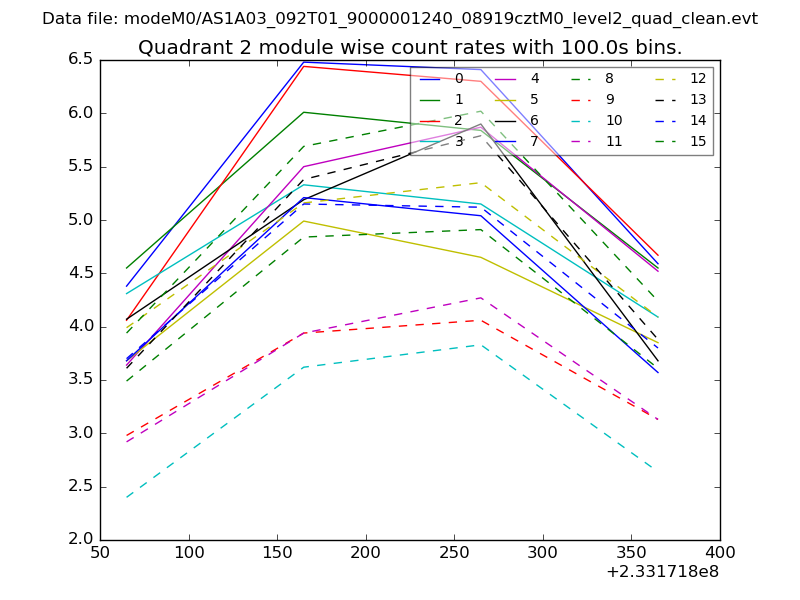 |
 |
| Module-wise count rates for Quadrant D Data is divided into 100 sec bins |
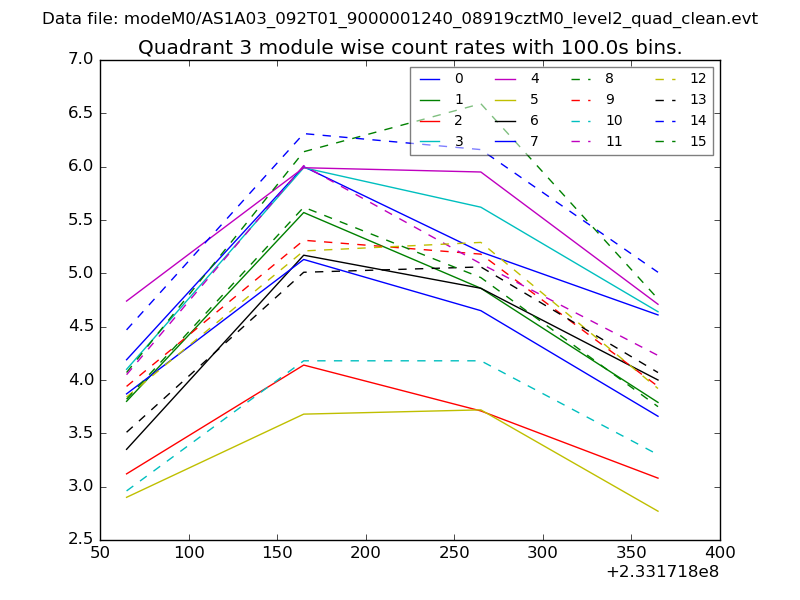 |
 |
| Parameter | Plot |
|---|---|
| CZT HV Monitor | 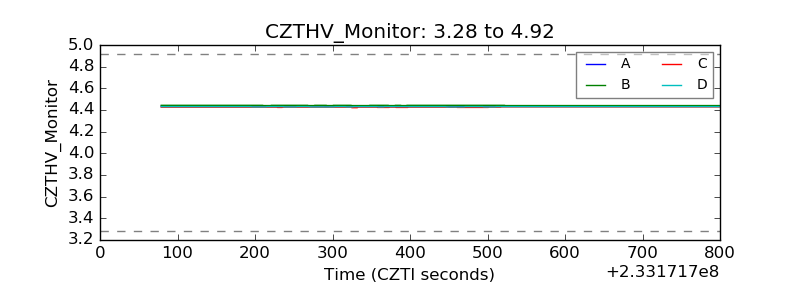 |
| D_VDD | 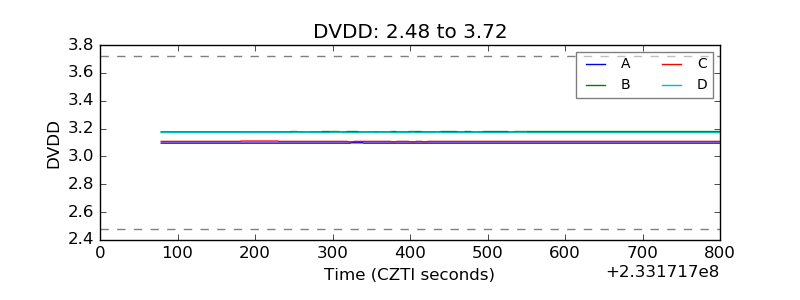 |
| Temperature 1 | 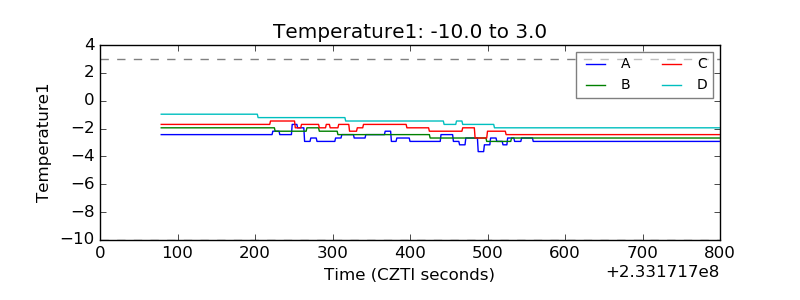 |
| Veto HV Monitor | 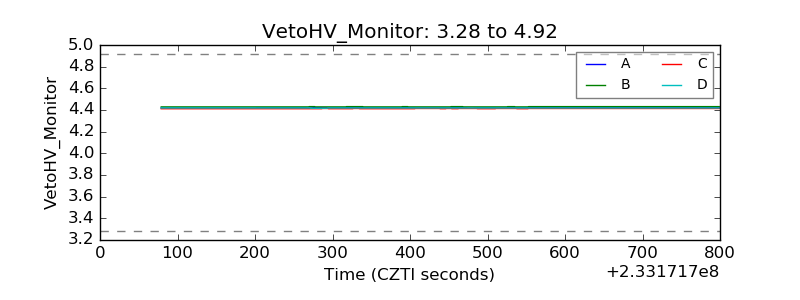 |
| Veto LLD | 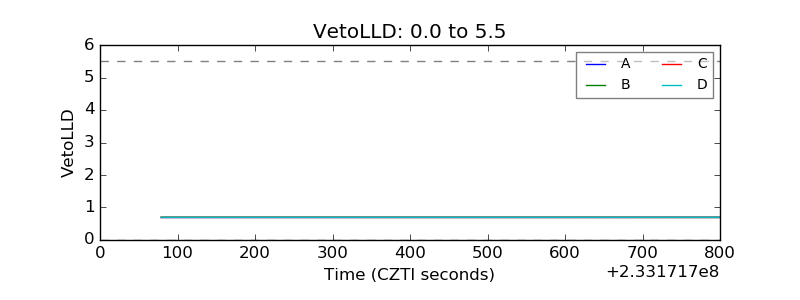 |
| Alpha Counter | 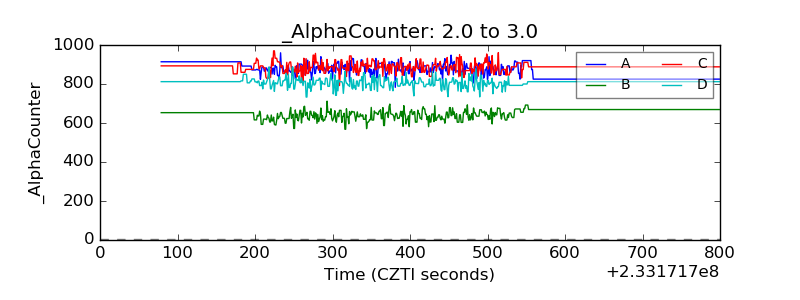 |
| _CPM_Rate | 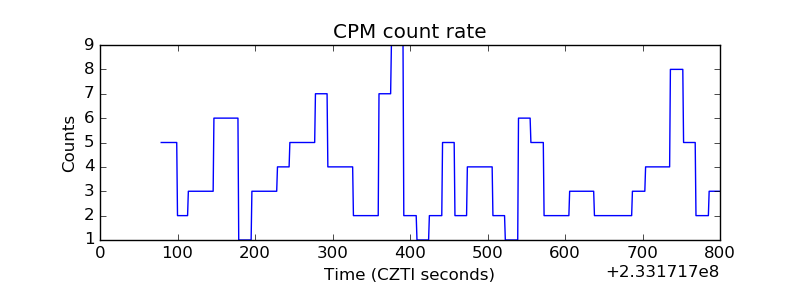 |
| CZT Counter |  |
| +2.5 Volts monitor |  |
| +5 Volts monitor | 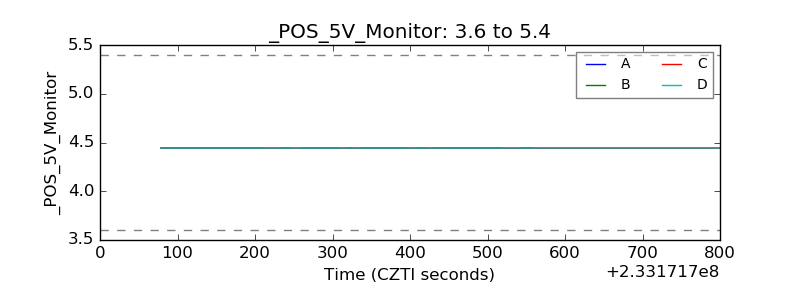 |
| _ROLL_ROT | 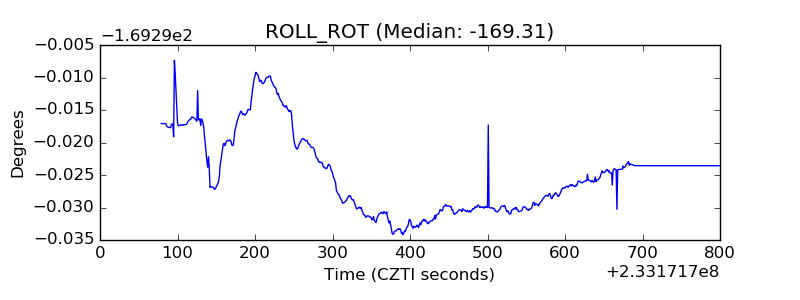 |
| _Roll_DEC | 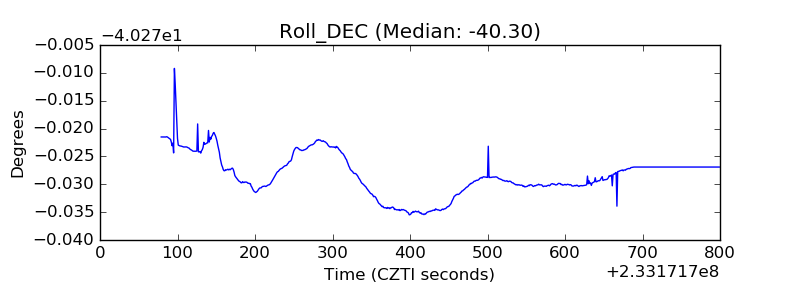 |
| _Roll_RA | 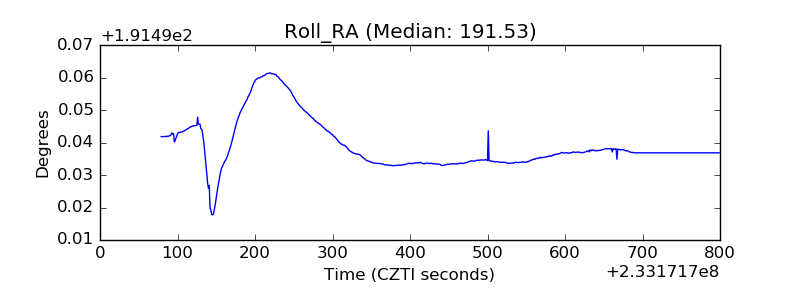 |
| Veto Counter | 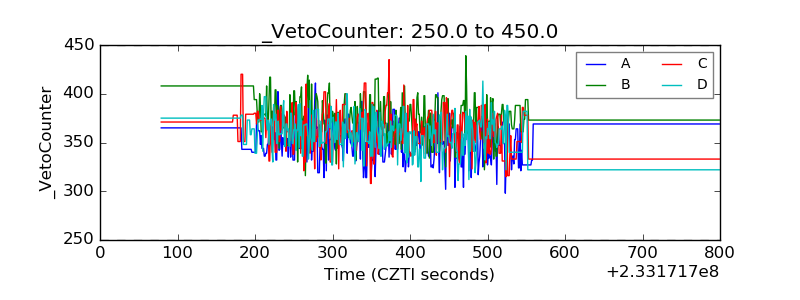 |