| Param | Original file | Final file |
|---|---|---|
| Filename | modeM0/AS1A03_092T01_9000001240_08921cztM0_level2.evt | modeM0/AS1A03_092T01_9000001240_08921cztM0_level2_quad_clean.evt |
| Size (bytes) | 511,836,480 | 106,462,080 |
| Size | 488.1 MB | 101.5 MB |
| Events in quadrant A | 4,231,911 | 681,128 |
| Events in quadrant B | 3,704,656 | 689,507 |
| Events in quadrant C | 3,365,166 | 668,533 |
| Events in quadrant D | 3,683,860 | 657,144 |
| Mode M9 | |||
|---|---|---|---|
| Quadrant | BADHDUFLAG | Total packets | Discarded packets |
| A | 0 | 6 | 0 |
| B | 0 | 6 | 0 |
| C | 0 | 6 | 0 |
| D | 0 | 6 | 0 |
| Mode SS | |||
|---|---|---|---|
| Quadrant | BADHDUFLAG | Total packets | Discarded packets |
| A | 0 | 156 | 0 |
| B | 0 | 156 | 0 |
| C | 0 | 156 | 0 |
| D | 0 | 156 | 0 |
| Mode M0 | |||
|---|---|---|---|
| Quadrant | BADHDUFLAG | Total packets | Discarded packets |
| A | 0 | 17632 | 6 |
| B | 0 | 16171 | 5 |
| C | 0 | 15618 | 6 |
| D | 0 | 16344 | 3 |
| Quadrant | Total seconds | Saturated seconds | Saturation percentage |
|---|---|---|---|
| A | 7589 | 135 | 1.778890% |
| B | 7589 | 74 | 0.975096% |
| C | 7589 | 41 | 0.540256% |
| D | 7590 | 29 | 0.382082% |
Noise dominated data is calculated using 1-second bins in cleaned event files. If a bin has >2000 counts, and if more than 50% of those come from <1% of pixels, then it is considered to be noise-dominated and hence unusable.
| Quadrant | # 1 sec bins | Bins with >0 counts | Bins with >2000 counts | High rate bins dominated by noise | Noise dominated (total time) | Noise dominated (detector-on time) | Marked lightcurve |
|---|---|---|---|---|---|---|---|
| A | 8210 | 7594 | 46 | 46 | 0.56% | 0.61% | 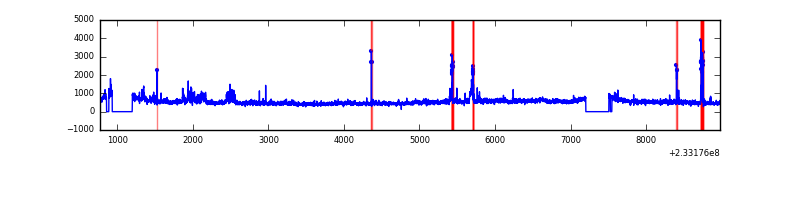 |
| B | 8210 | 7593 | 3 | 3 | 0.04% | 0.04% | 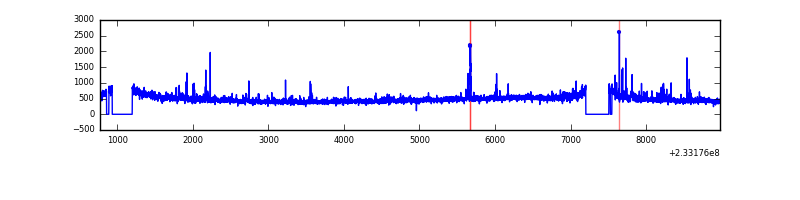 |
| C | 8210 | 7594 | 0 | 0 | 0.00% | 0.00% | 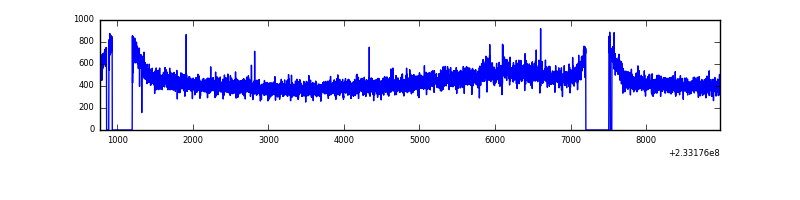 |
| D | 8210 | 7594 | 9 | 9 | 0.11% | 0.12% | 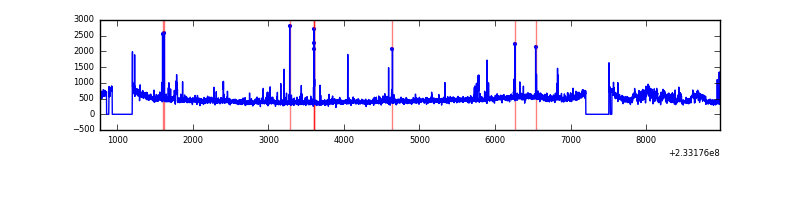 |
Top three noisy pixels from each quadrant. If the there are fewer than three noisy pixels in the level2.evt file, extra rows are filled as -1
| Pixel properties | Quadrant properties | ||||||
|---|---|---|---|---|---|---|---|
| Quadrant | DetID | PixID | Counts | Sigma | Mean | Median | Sigma |
| A | 8 | 5 | 600614 | 3286.28 | 892 | 871 | 182.5 |
| A | 15 | 174 | 116610 | 634.19 | 892 | 871 | 182.5 |
| A | 5 | 16 | 76870 | 416.43 | 892 | 871 | 182.5 |
| B | 10 | 16 | 65518 | 375.41 | 896 | 873 | 172.2 |
| B | 0 | 214 | 54613 | 312.08 | 896 | 873 | 172.2 |
| B | 0 | 168 | 29095 | 163.89 | 896 | 873 | 172.2 |
| C | 9 | 68 | 15719 | 74.69 | 856 | 860 | 198.9 |
| C | 13 | 61 | 6544 | 28.57 | 856 | 860 | 198.9 |
| C | 8 | 128 | 4086 | 16.22 | 856 | 860 | 198.9 |
| D | 13 | 105 | 156404 | 677.34 | 854 | 834 | 229.7 |
| D | 8 | 195 | 121054 | 523.43 | 854 | 834 | 229.7 |
| D | 1 | 52 | 51946 | 222.54 | 854 | 834 | 229.7 |
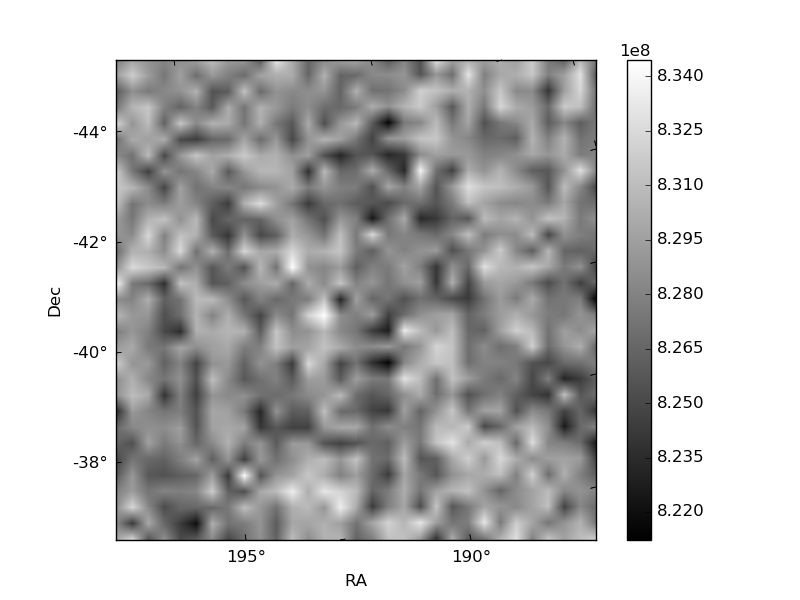
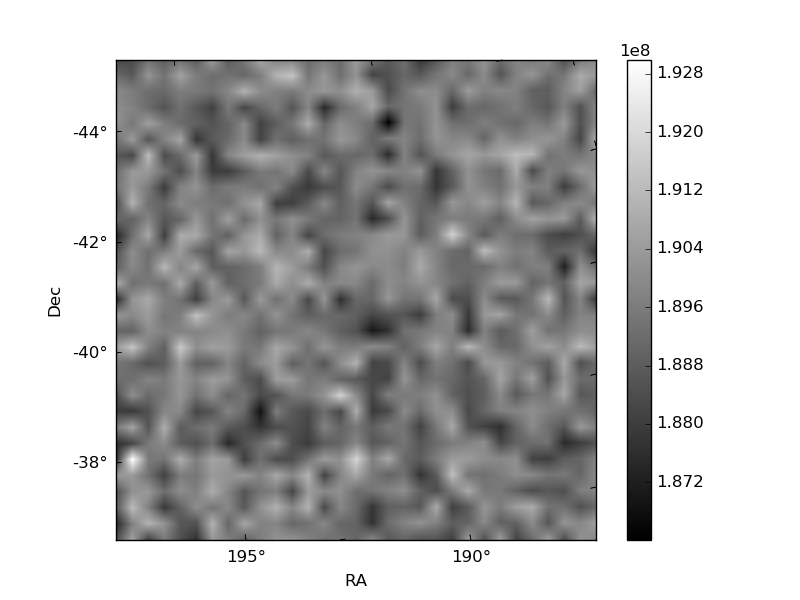
Histogram calculated using DETX and DETY for each event in the final _common_clean file
| Quadrant A | 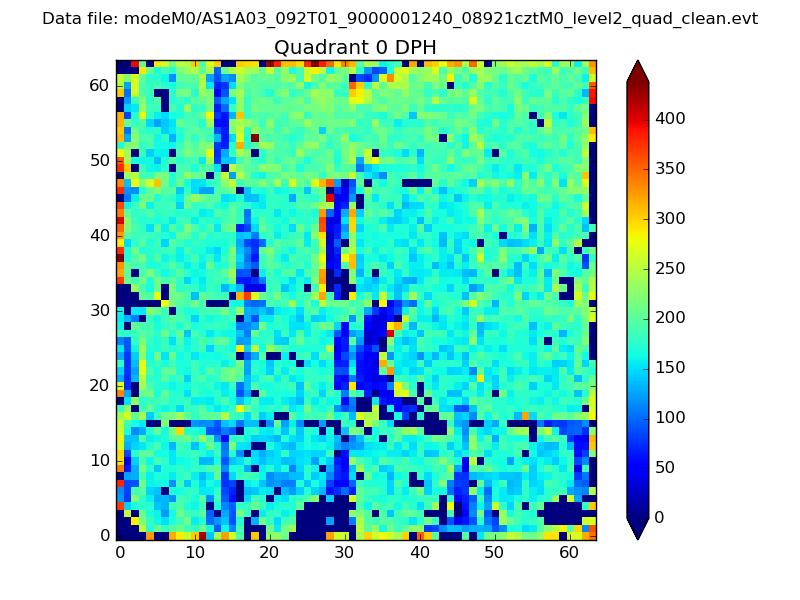 |
 |
Quadrant B |
|---|---|---|---|
| Quadrant D | 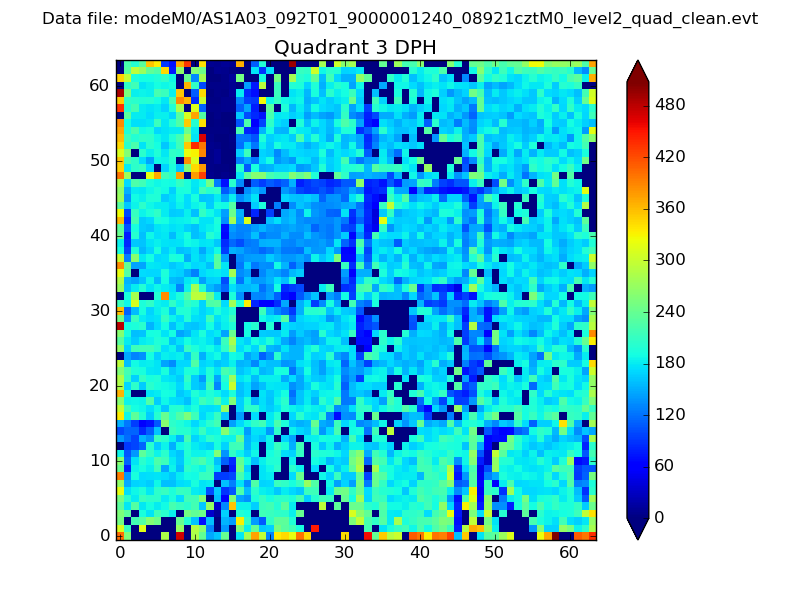 |
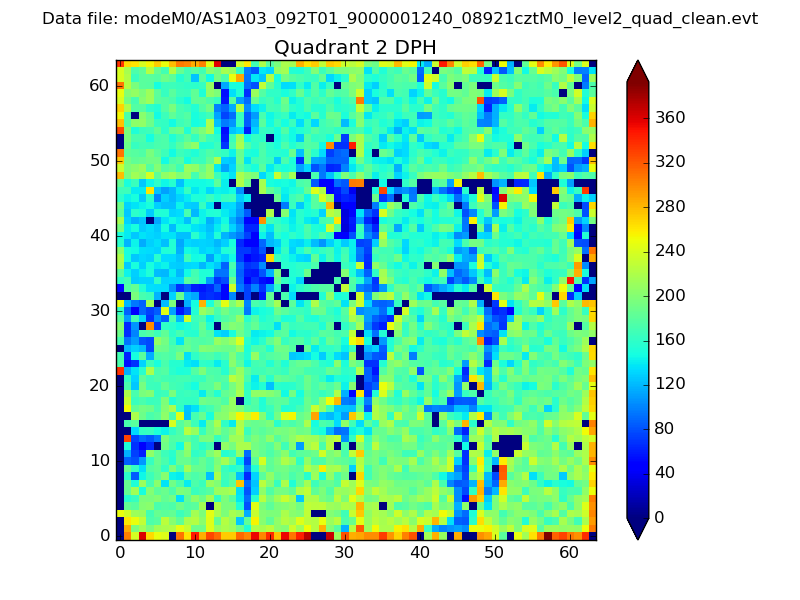 |
Quadrant C |
| Plot type | Count rate plots | Images |
|---|---|---|
| Comparison with Poisson distribution Blue bars denote a histogram of data divided into 1 sec bins. Red curve is a Poisson curve with rate = median count rate of data. |
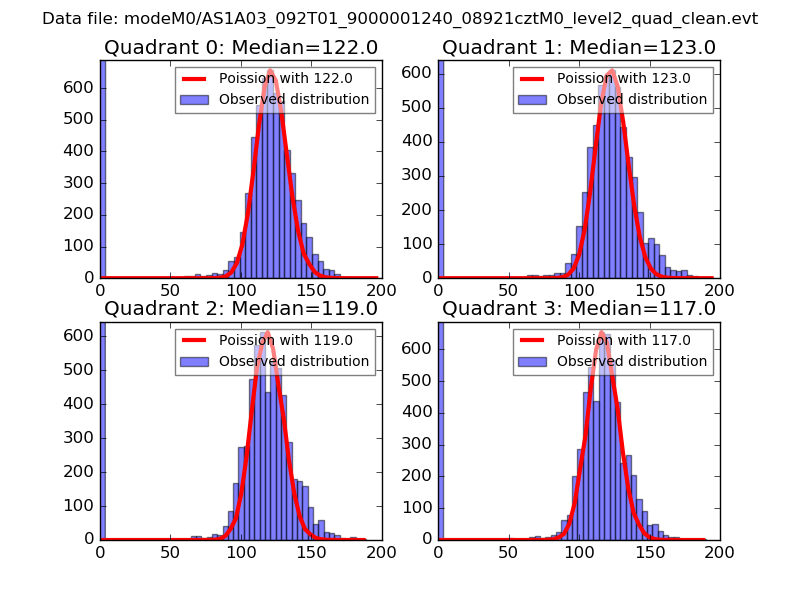 |
 |
| Quadrant-wise count rates Data is divided into 100 sec bins |
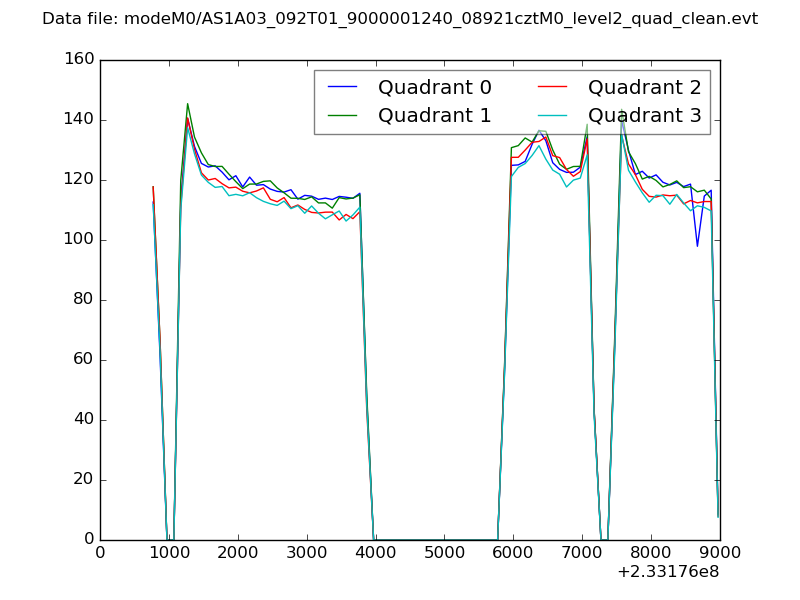 |
|
| Module-wise count rates for Quadrant A Data is divided into 100 sec bins |
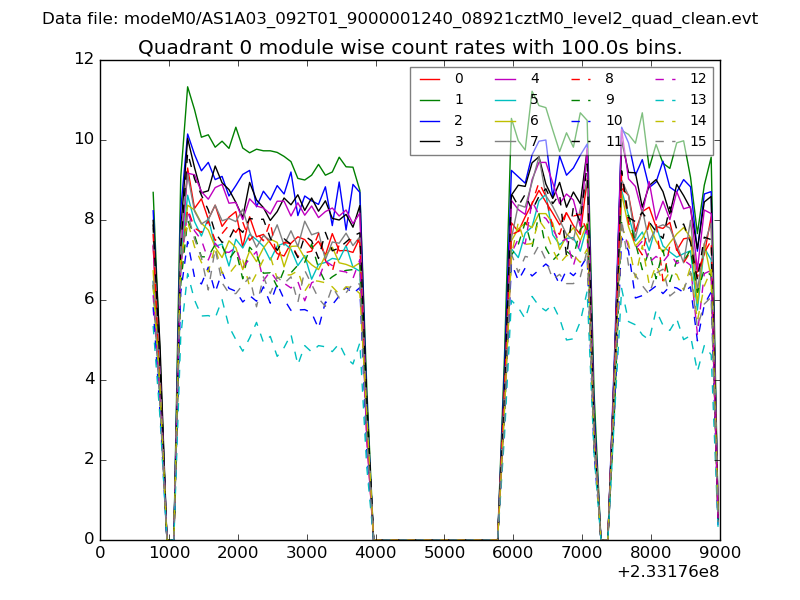 |
 |
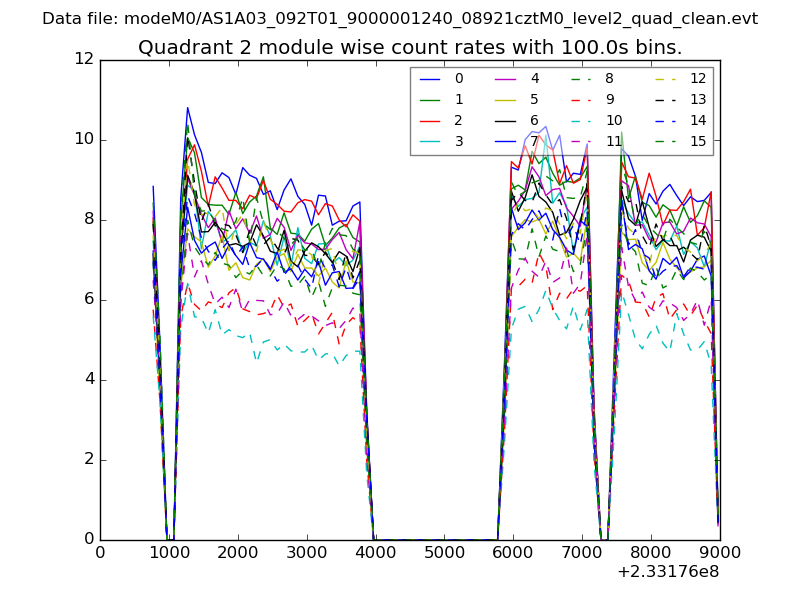
| Module-wise count rates for Quadrant B Data is divided into 100 sec bins |
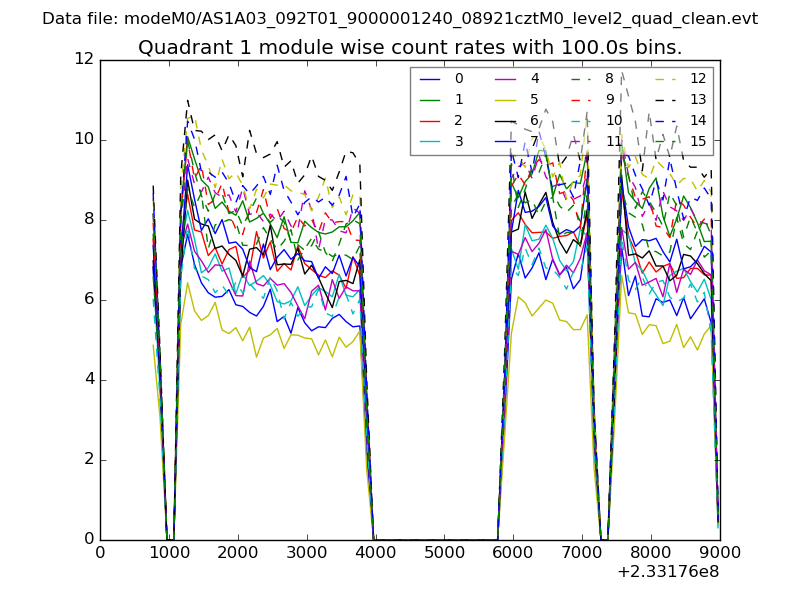 |
 |
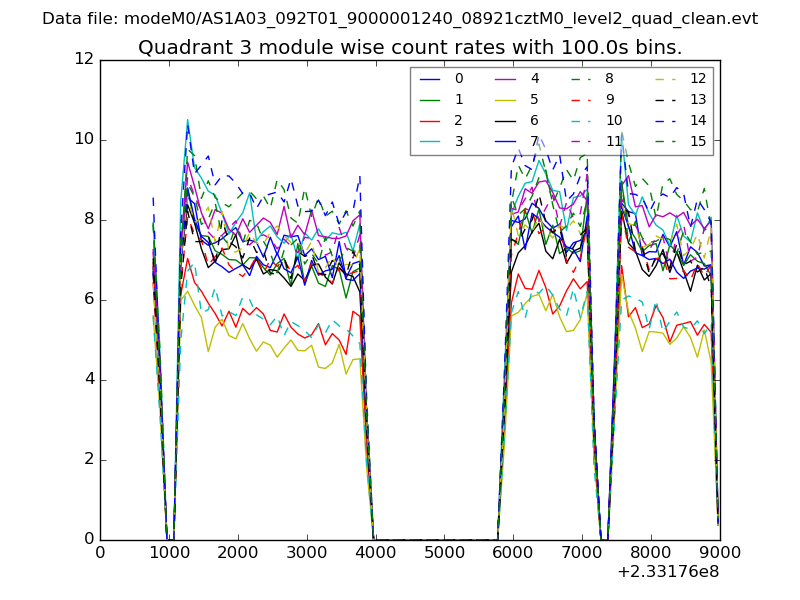
| Module-wise count rates for Quadrant C Data is divided into 100 sec bins |
 |
 |
| Module-wise count rates for Quadrant D Data is divided into 100 sec bins |
 |
 |
| Parameter | Plot |
|---|---|
| CZT HV Monitor | 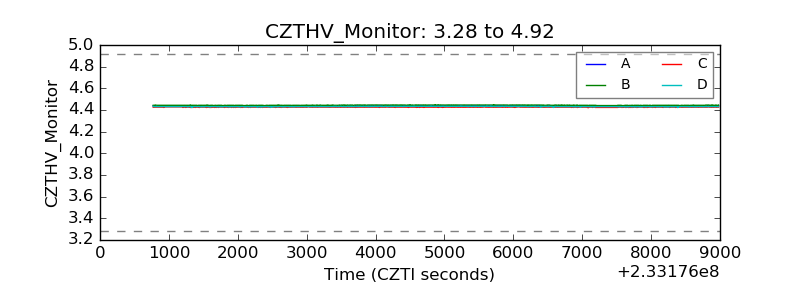 |
| D_VDD | 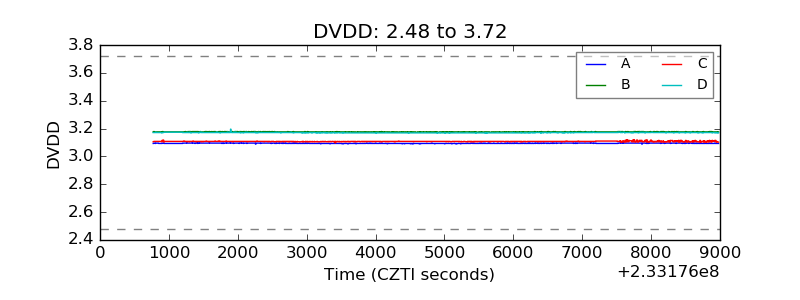 |
| Temperature 1 | 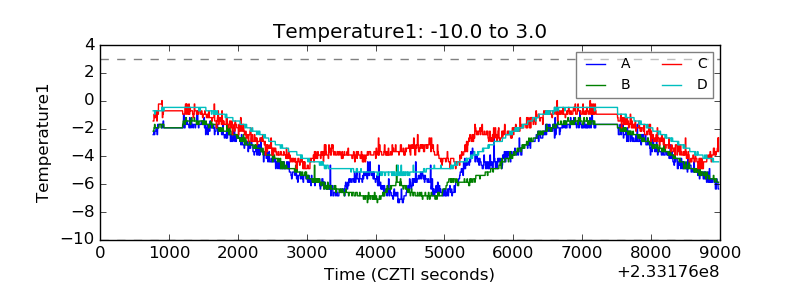 |
| Veto HV Monitor | 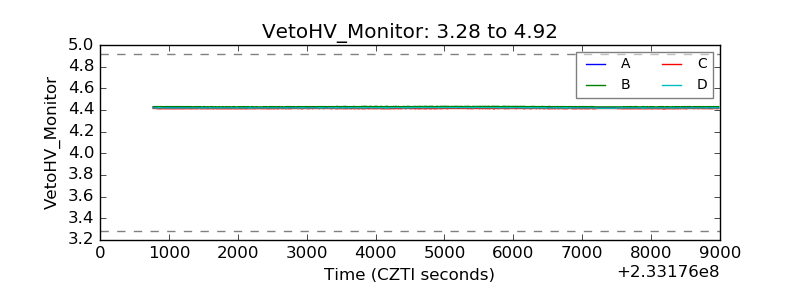 |
| Veto LLD | 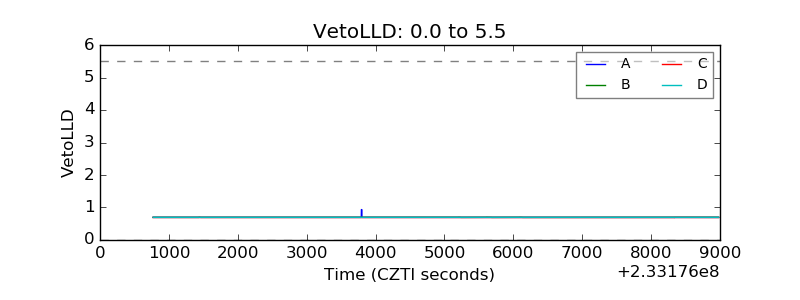 |
| Alpha Counter | 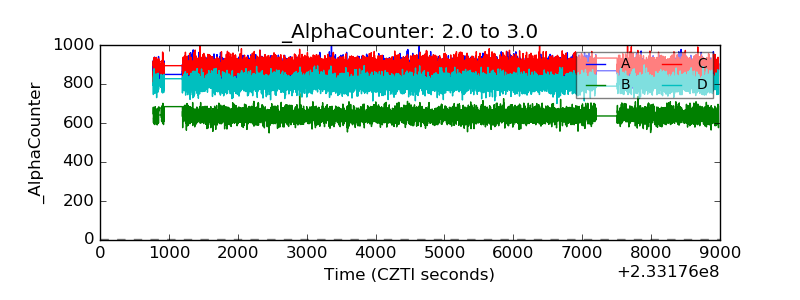 |
| _CPM_Rate | 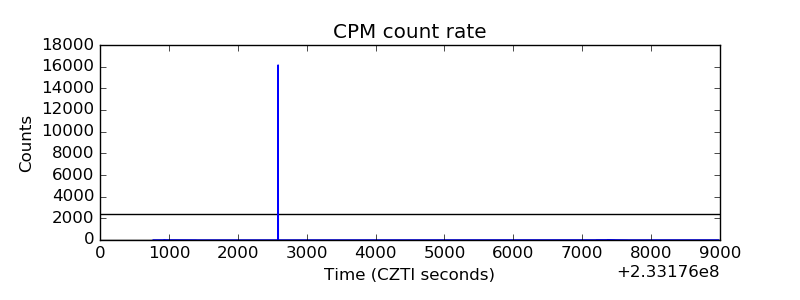 |
| CZT Counter | 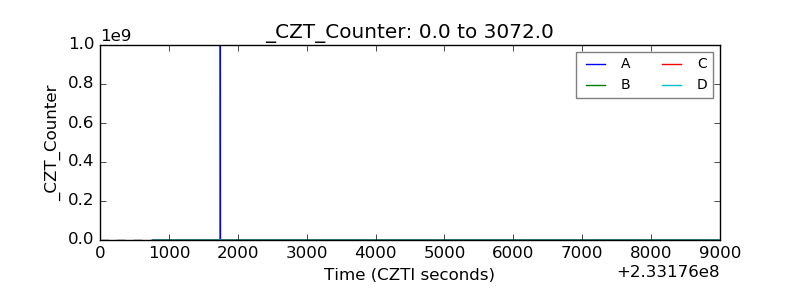 |
| +2.5 Volts monitor |  |
| +5 Volts monitor | 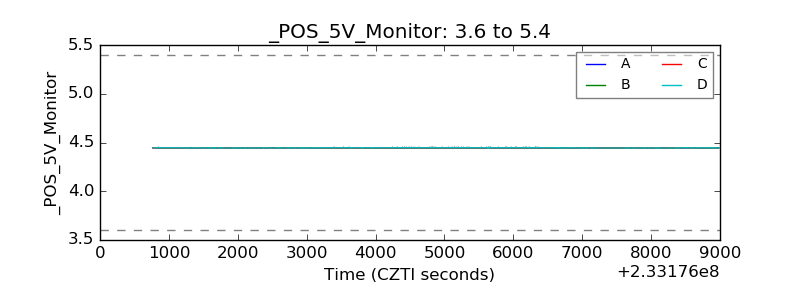 |
| _ROLL_ROT | 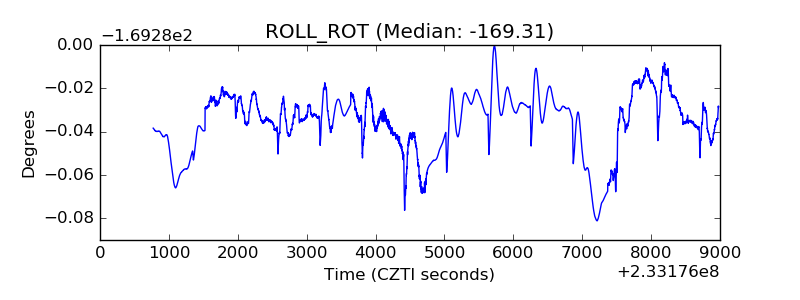 |
| _Roll_DEC | 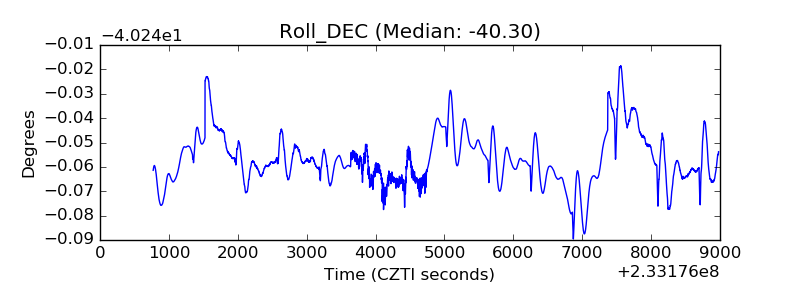 |
| _Roll_RA | 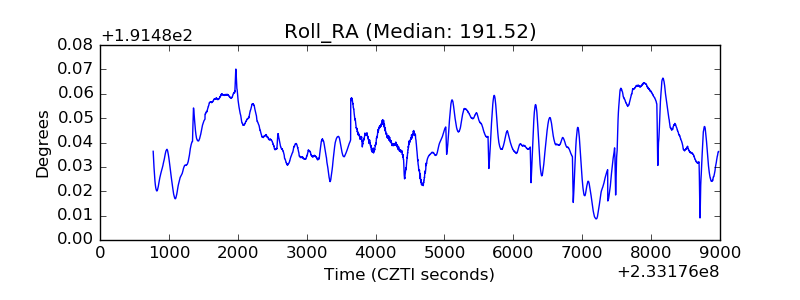 |
| Veto Counter | 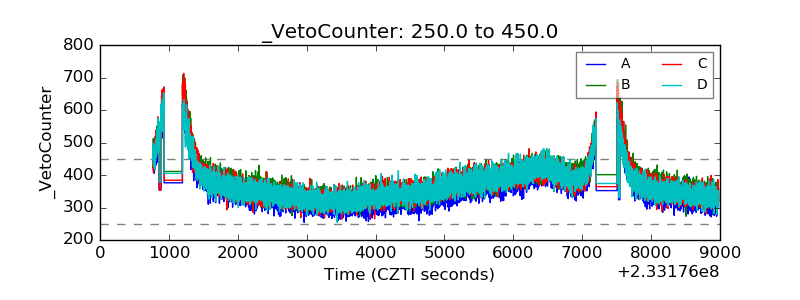 |