| Param | Original file | Final file |
|---|---|---|
| Filename | modeM0/AS1A03_092T01_9000001240_08925cztM0_level2.evt | modeM0/AS1A03_092T01_9000001240_08925cztM0_level2_quad_clean.evt |
| Size (bytes) | 2,760,526,080 | 505,368,000 |
| Size | 2.6 GB | 482.0 MB |
| Events in quadrant A | 21,259,156 | 3,161,860 |
| Events in quadrant B | 19,319,362 | 3,187,763 |
| Events in quadrant C | 17,910,888 | 3,108,434 |
| Events in quadrant D | 22,347,712 | 3,036,313 |
| Mode M9 | |||
|---|---|---|---|
| Quadrant | BADHDUFLAG | Total packets | Discarded packets |
| A | 0 | 38 | 0 |
| B | 0 | 38 | 0 |
| C | 0 | 38 | 0 |
| D | 0 | 38 | 0 |
| Mode SS | |||
|---|---|---|---|
| Quadrant | BADHDUFLAG | Total packets | Discarded packets |
| A | 0 | 838 | 0 |
| B | 0 | 838 | 0 |
| C | 0 | 838 | 0 |
| D | 0 | 838 | 0 |
| Mode M0 | |||
|---|---|---|---|
| Quadrant | BADHDUFLAG | Total packets | Discarded packets |
| A | 0 | 89937 | 9 |
| B | 0 | 85073 | 8 |
| C | 0 | 83096 | 8 |
| D | 0 | 95100 | 8 |
| Quadrant | Total seconds | Saturated seconds | Saturation percentage |
|---|---|---|---|
| A | 40950 | 433 | 1.057387% |
| B | 40950 | 240 | 0.586081% |
| C | 40950 | 119 | 0.290598% |
| D | 40950 | 439 | 1.072039% |
Noise dominated data is calculated using 1-second bins in cleaned event files. If a bin has >2000 counts, and if more than 50% of those come from <1% of pixels, then it is considered to be noise-dominated and hence unusable.
| Quadrant | # 1 sec bins | Bins with >0 counts | Bins with >2000 counts | High rate bins dominated by noise | Noise dominated (total time) | Noise dominated (detector-on time) | Marked lightcurve |
|---|---|---|---|---|---|---|---|
| A | 44965 | 40958 | 183 | 183 | 0.41% | 0.45% | 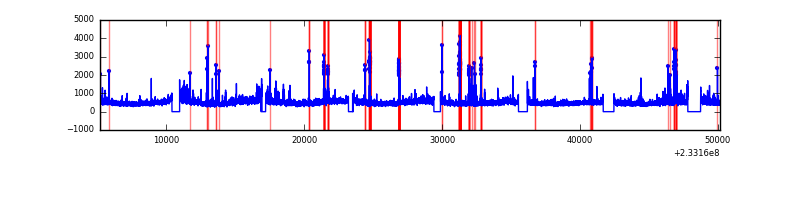 |
| B | 44965 | 40958 | 14 | 14 | 0.03% | 0.03% | 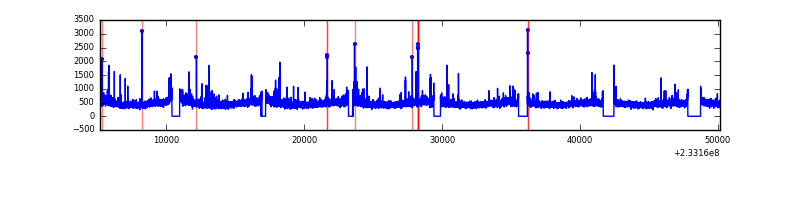 |
| C | 44965 | 40959 | 0 | 0 | 0.00% | 0.00% | 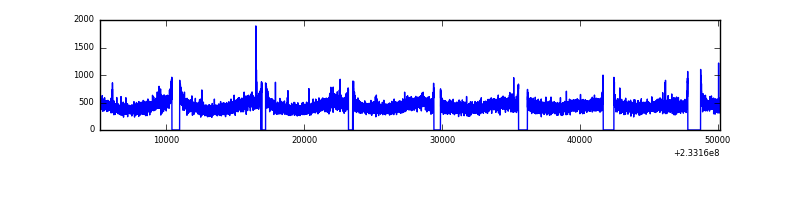 |
| D | 44965 | 40959 | 298 | 298 | 0.66% | 0.73% | 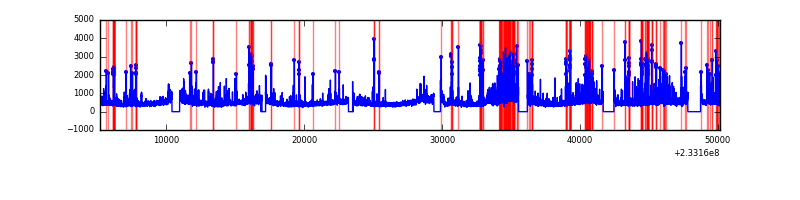 |
Top three noisy pixels from each quadrant. If the there are fewer than three noisy pixels in the level2.evt file, extra rows are filled as -1
| Pixel properties | Quadrant properties | ||||||
|---|---|---|---|---|---|---|---|
| Quadrant | DetID | PixID | Counts | Sigma | Mean | Median | Sigma |
| A | 8 | 5 | 2177559 | 2267.89 | 4736 | 4636 | 958.1 |
| A | 15 | 174 | 590249 | 611.21 | 4736 | 4636 | 958.1 |
| A | 5 | 16 | 207928 | 212.18 | 4736 | 4636 | 958.1 |
| B | 0 | 214 | 248573 | 271.22 | 4765 | 4655 | 899.3 |
| B | 10 | 16 | 116503 | 124.37 | 4765 | 4655 | 899.3 |
| B | 12 | 111 | 96372 | 101.98 | 4765 | 4655 | 899.3 |
| C | 13 | 61 | 34601 | 28.45 | 4575 | 4586 | 1054.8 |
| C | 9 | 68 | 26189 | 20.48 | 4575 | 4586 | 1054.8 |
| C | 14 | 234 | 18033 | 12.75 | 4575 | 4586 | 1054.8 |
| D | 12 | 233 | 1422974 | 1191.38 | 4555 | 4442 | 1190.7 |
| D | 1 | 52 | 1162611 | 972.71 | 4555 | 4442 | 1190.7 |
| D | 8 | 195 | 1008243 | 843.06 | 4555 | 4442 | 1190.7 |
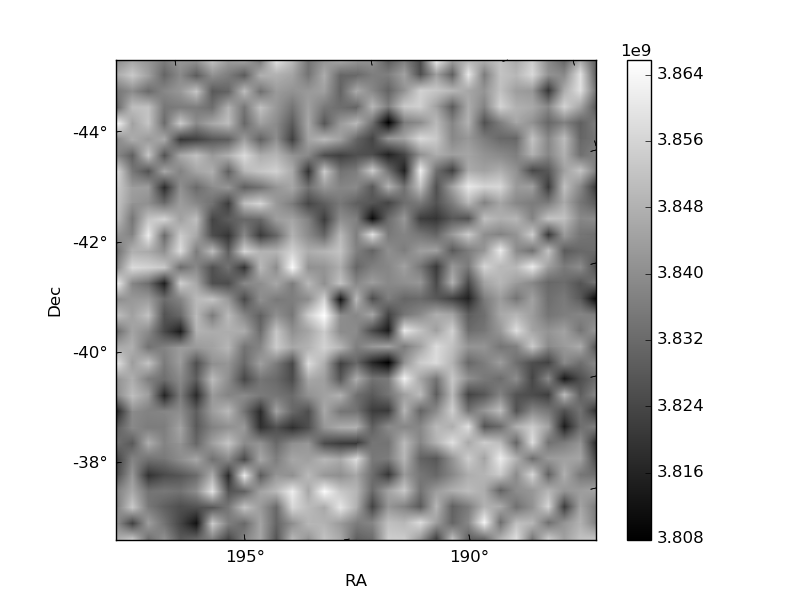
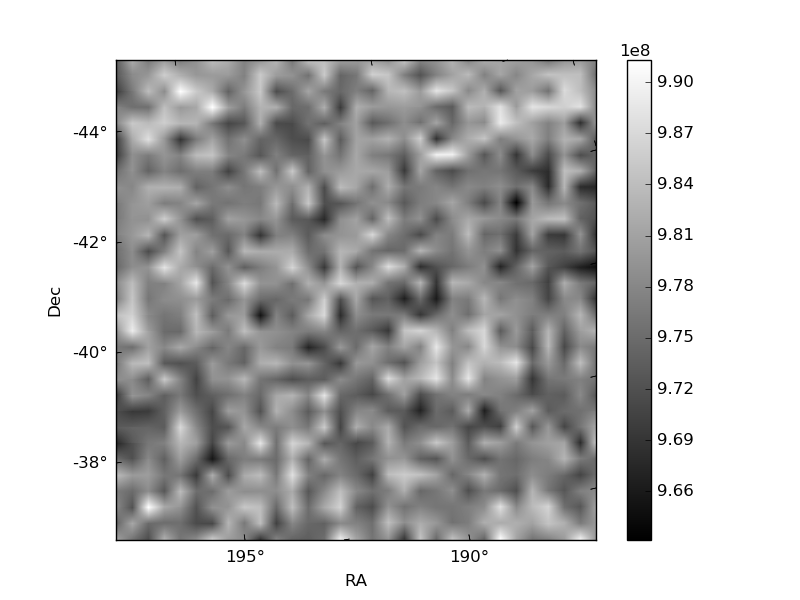
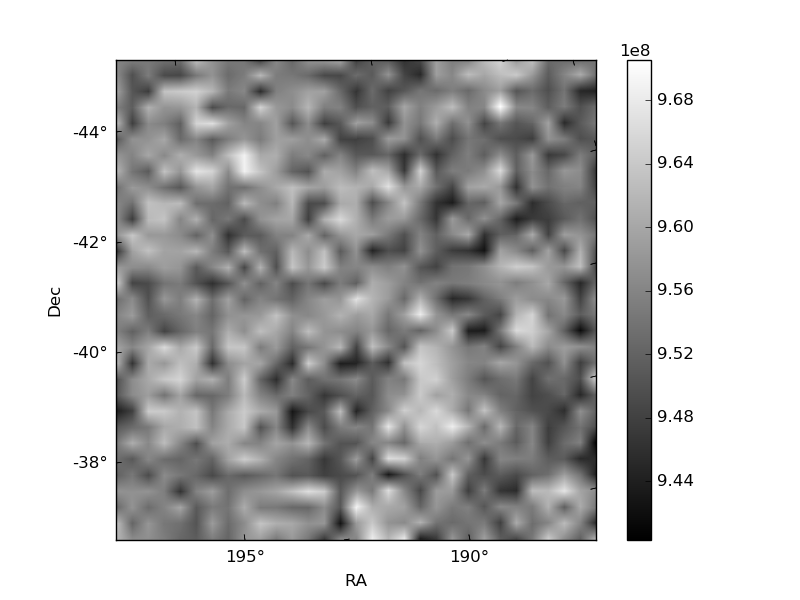
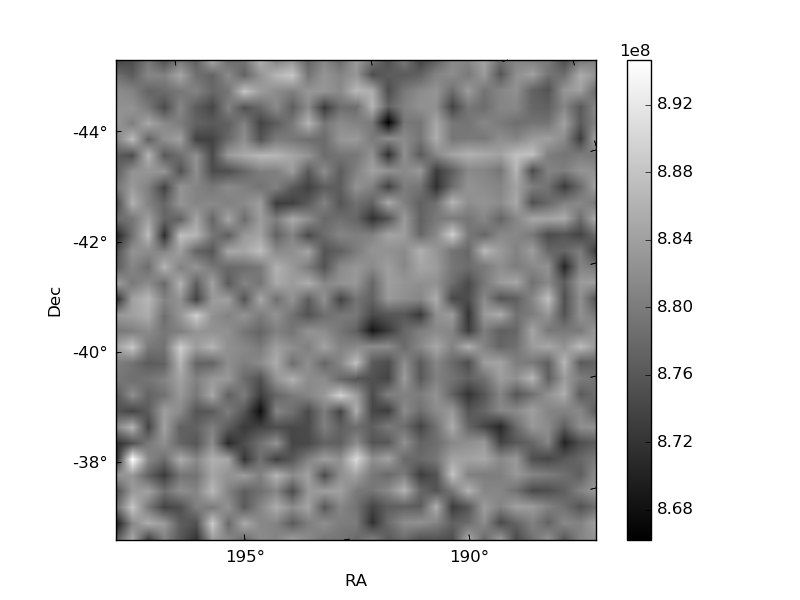
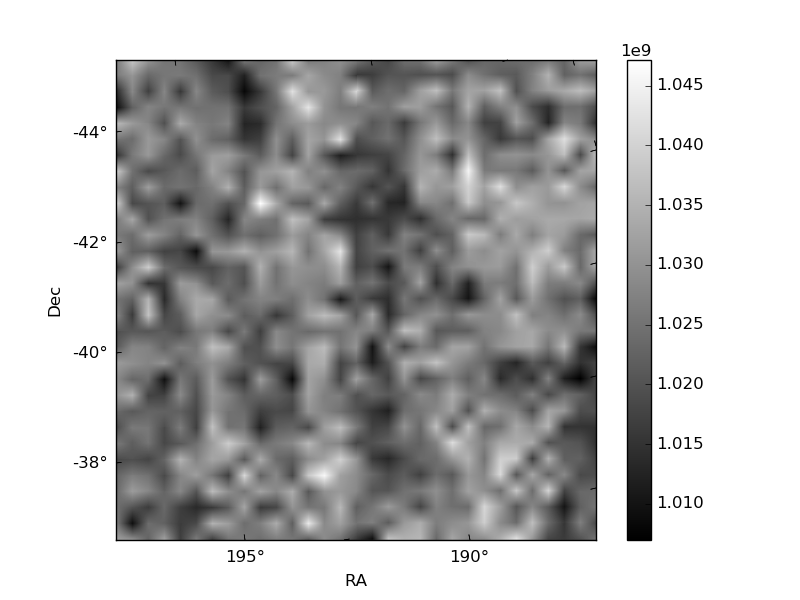
Histogram calculated using DETX and DETY for each event in the final _common_clean file
| Quadrant A | 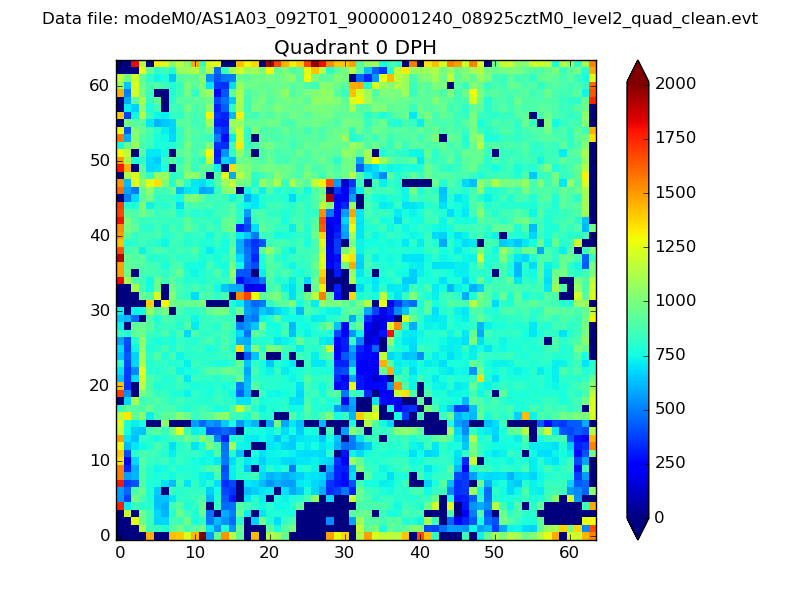 |
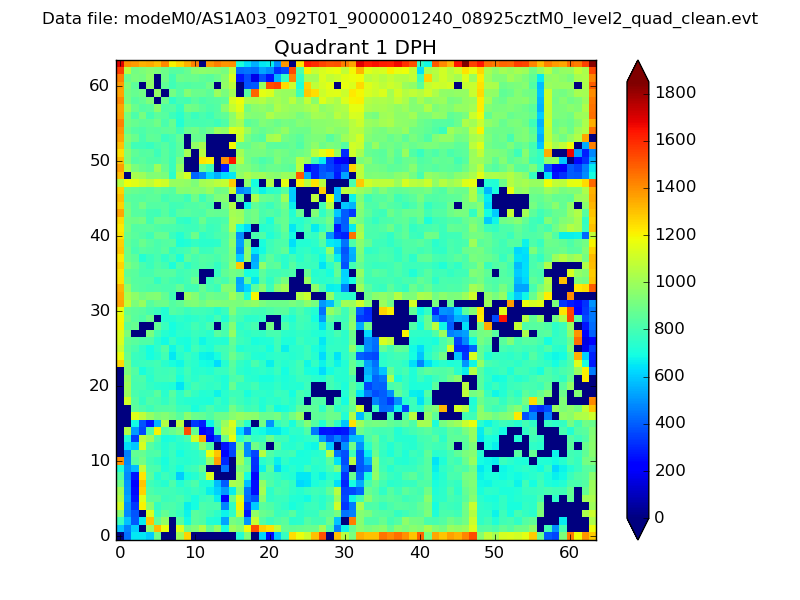 |
Quadrant B |
|---|---|---|---|
| Quadrant D | 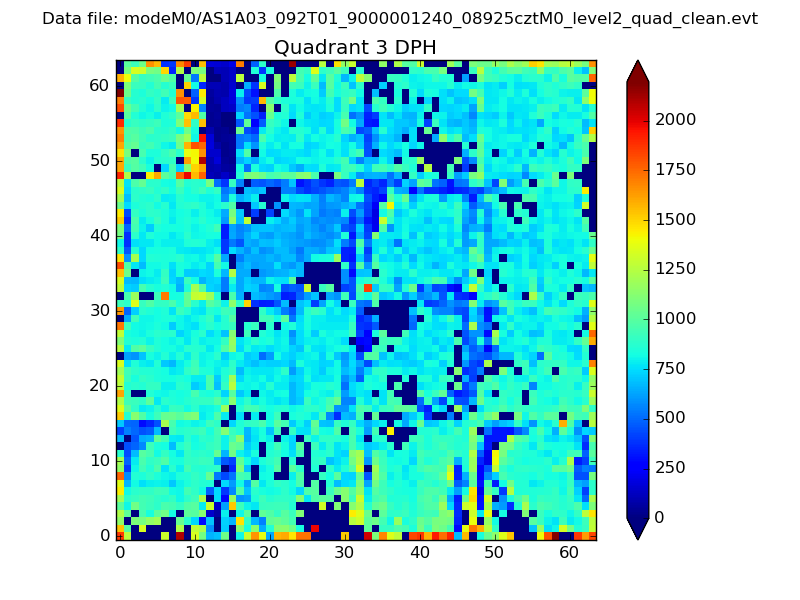 |
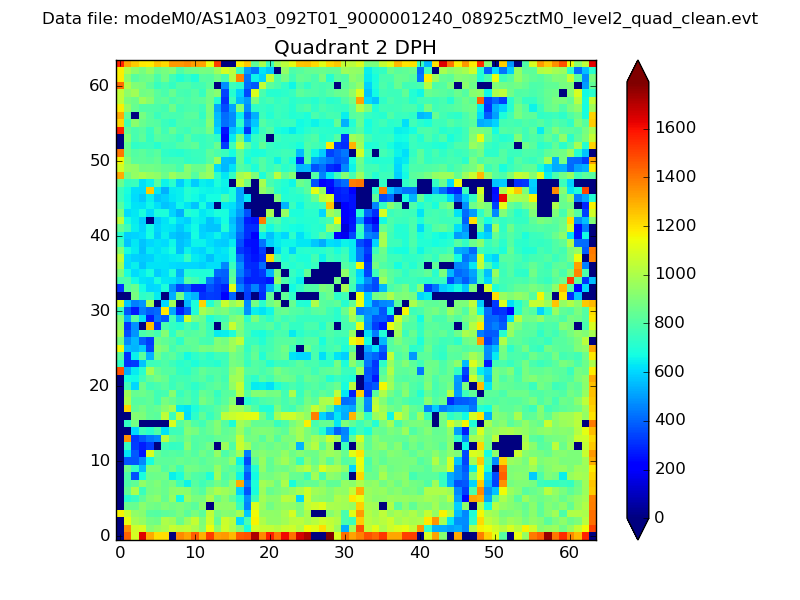 |
Quadrant C |
| Plot type | Count rate plots | Images |
|---|---|---|
| Comparison with Poisson distribution Blue bars denote a histogram of data divided into 1 sec bins. Red curve is a Poisson curve with rate = median count rate of data. |
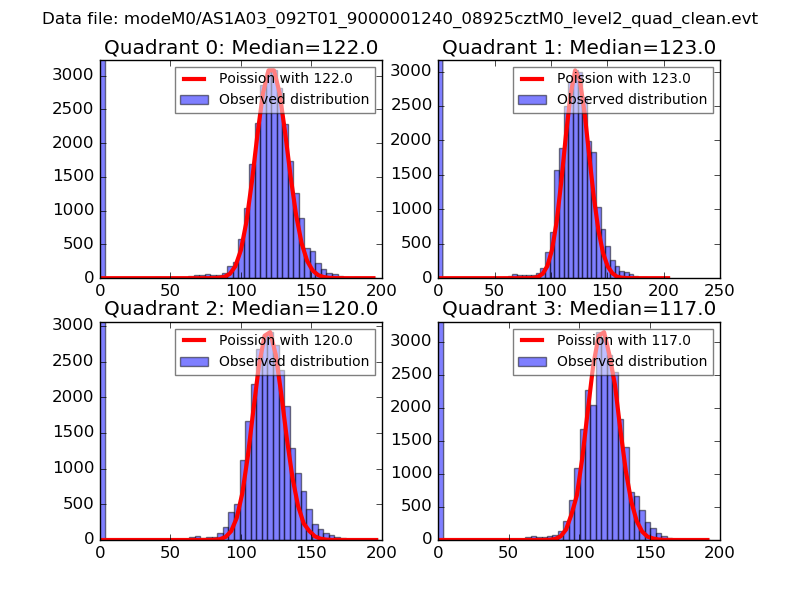 |
 |
| Quadrant-wise count rates Data is divided into 100 sec bins |
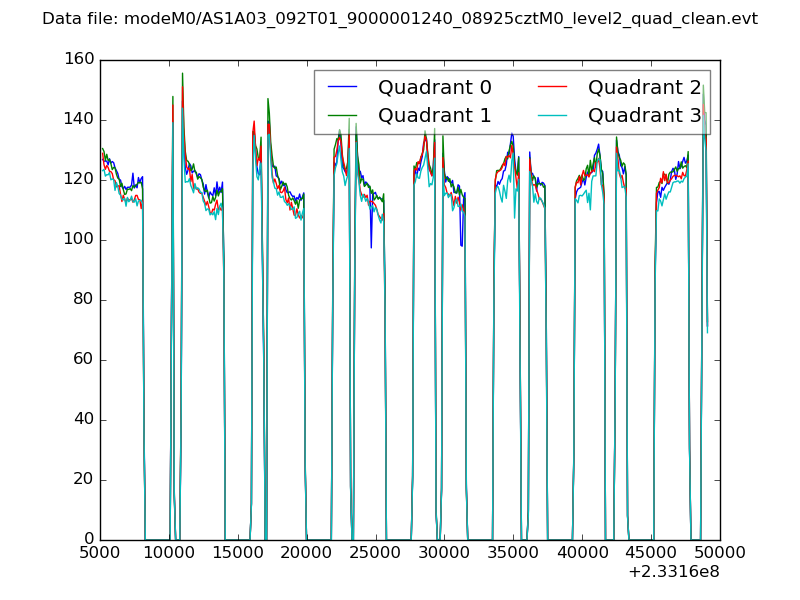 |
|
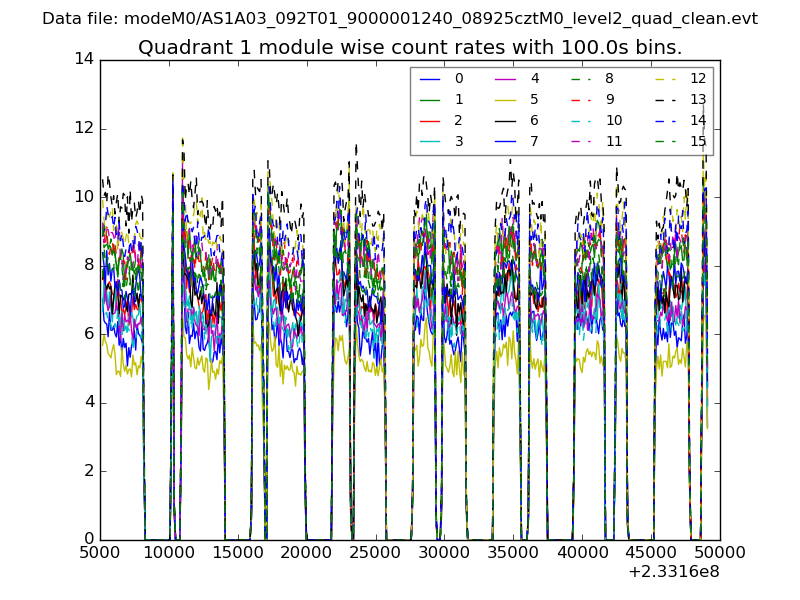
| Module-wise count rates for Quadrant A Data is divided into 100 sec bins |
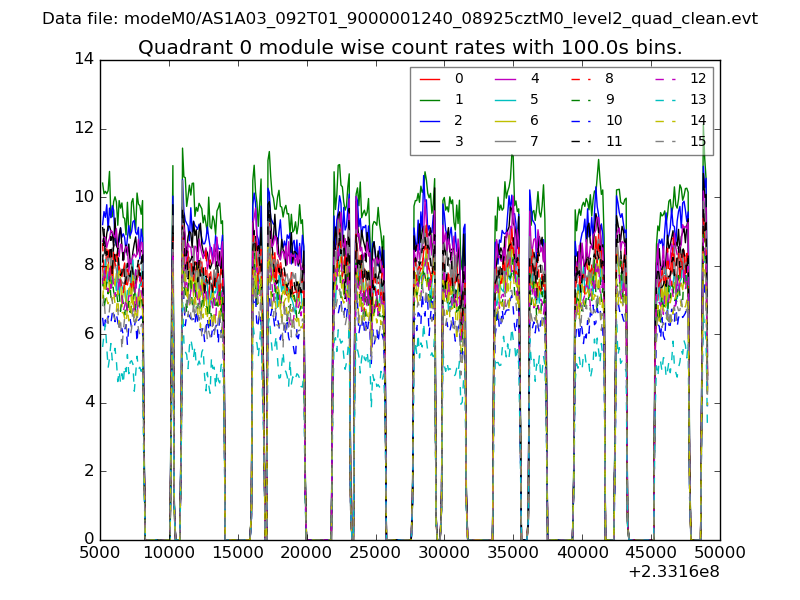 |
 |
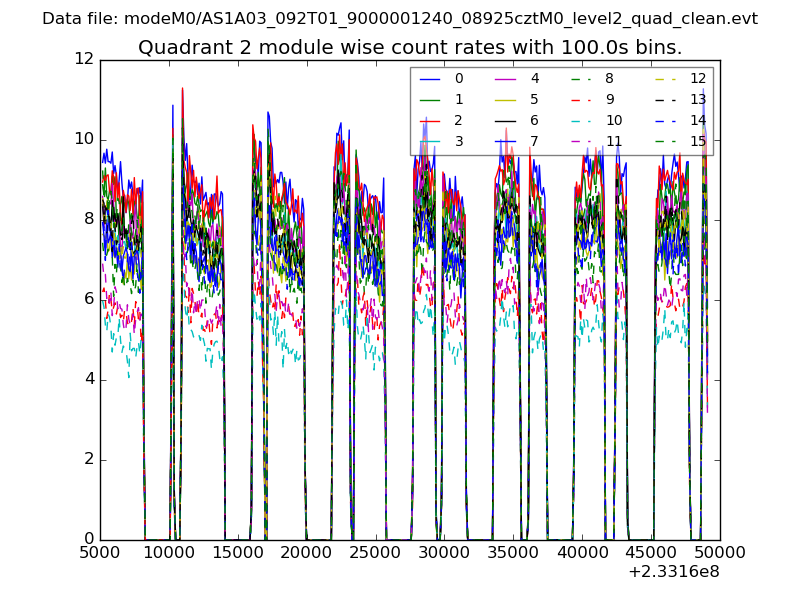
| Module-wise count rates for Quadrant B Data is divided into 100 sec bins |
 |
 |
| Module-wise count rates for Quadrant C Data is divided into 100 sec bins |
 |
 |
| Module-wise count rates for Quadrant D Data is divided into 100 sec bins |
 |
 |
| Parameter | Plot |
|---|---|
| CZT HV Monitor | 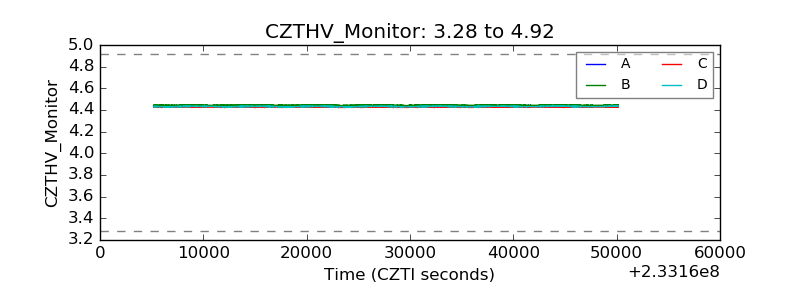 |
| D_VDD | 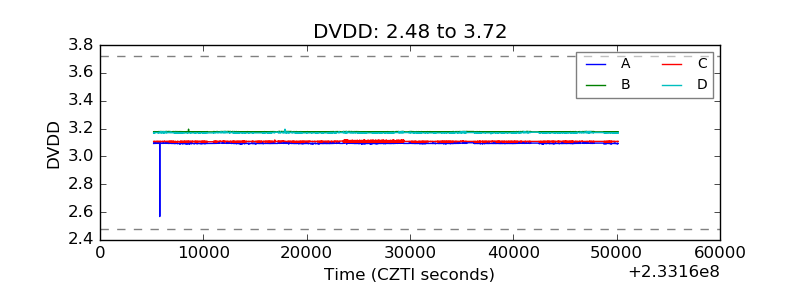 |
| Temperature 1 |  |
| Veto HV Monitor | 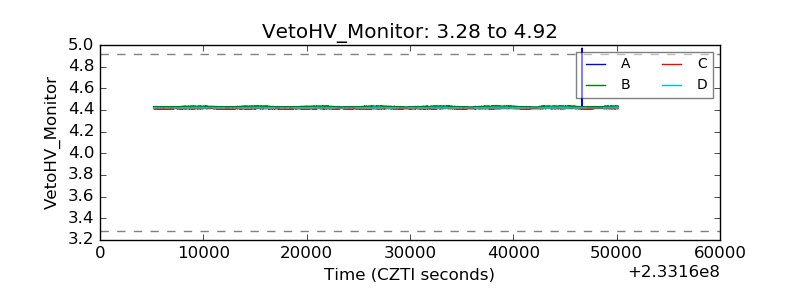 |
| Veto LLD | 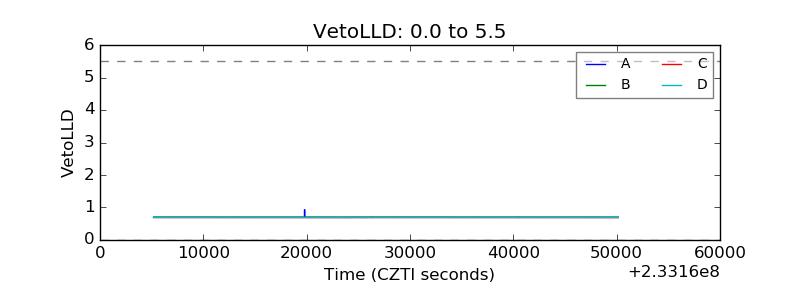 |
| Alpha Counter | 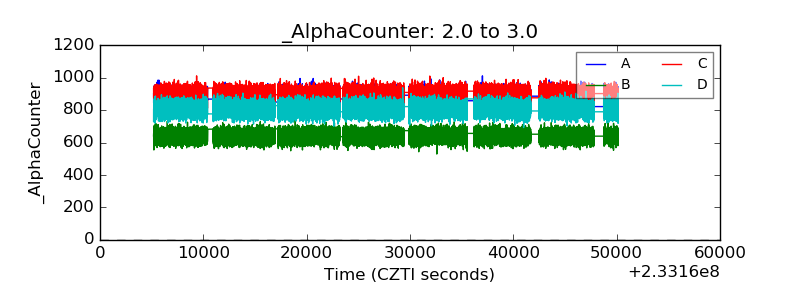 |
| _CPM_Rate | 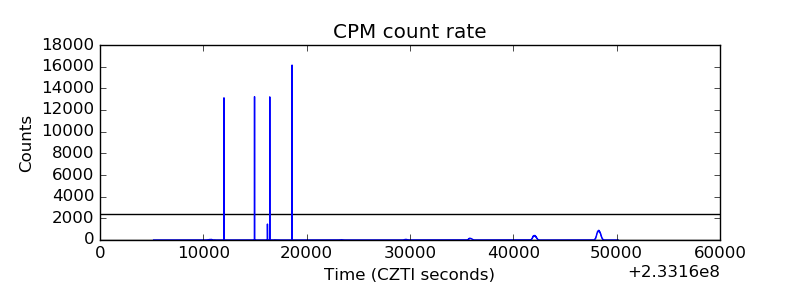 |
| CZT Counter | 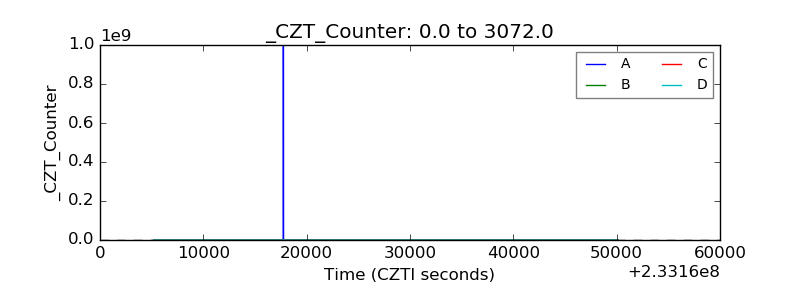 |
| +2.5 Volts monitor |  |
| +5 Volts monitor |  |
| _ROLL_ROT | 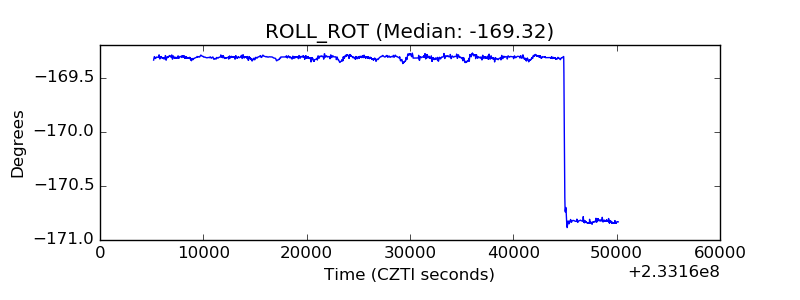 |
| _Roll_DEC |  |
| _Roll_RA | 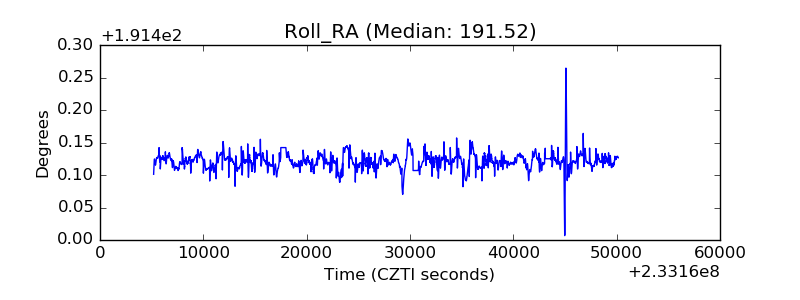 |
| Veto Counter | 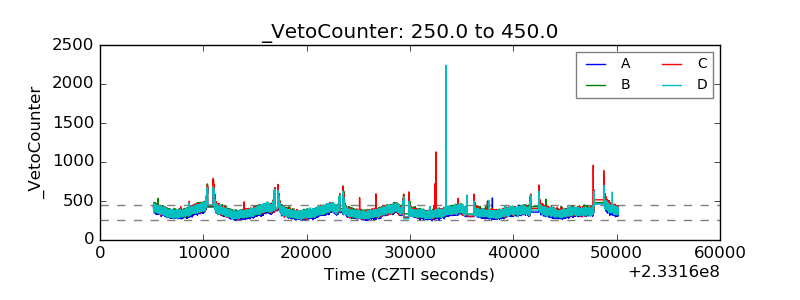 |