| Param | Original file | Final file |
|---|---|---|
| Filename | modeM0/AS1A03_092T01_9000001240_08928cztM0_level2.evt | modeM0/AS1A03_092T01_9000001240_08928cztM0_level2_quad_clean.evt |
| Size (bytes) | 443,419,200 | 65,583,360 |
| Size | 422.9 MB | 62.5 MB |
| Events in quadrant A | 3,550,195 | 387,159 |
| Events in quadrant B | 3,064,997 | 393,473 |
| Events in quadrant C | 2,968,561 | 388,405 |
| Events in quadrant D | 3,418,961 | 378,688 |
| Mode M9 | |||
|---|---|---|---|
| Quadrant | BADHDUFLAG | Total packets | Discarded packets |
| A | 0 | 16 | 0 |
| B | 0 | 16 | 0 |
| C | 0 | 16 | 0 |
| D | 0 | 17 | 0 |
| Mode SS | |||
|---|---|---|---|
| Quadrant | BADHDUFLAG | Total packets | Discarded packets |
| A | 0 | 128 | 0 |
| B | 0 | 128 | 0 |
| C | 0 | 128 | 0 |
| D | 0 | 128 | 0 |
| Mode M0 | |||
|---|---|---|---|
| Quadrant | BADHDUFLAG | Total packets | Discarded packets |
| A | 0 | 14376 | 3 |
| B | 0 | 13111 | 2 |
| C | 0 | 12991 | 2 |
| D | 0 | 13948 | 2 |
| Quadrant | Total seconds | Saturated seconds | Saturation percentage |
|---|---|---|---|
| A | 6271 | 93 | 1.483017% |
| B | 6271 | 61 | 0.972732% |
| C | 6271 | 63 | 1.004624% |
| D | 6271 | 62 | 0.988678% |
Noise dominated data is calculated using 1-second bins in cleaned event files. If a bin has >2000 counts, and if more than 50% of those come from <1% of pixels, then it is considered to be noise-dominated and hence unusable.
| Quadrant | # 1 sec bins | Bins with >0 counts | Bins with >2000 counts | High rate bins dominated by noise | Noise dominated (total time) | Noise dominated (detector-on time) | Marked lightcurve |
|---|---|---|---|---|---|---|---|
| A | 7426 | 6271 | 26 | 26 | 0.35% | 0.41% | 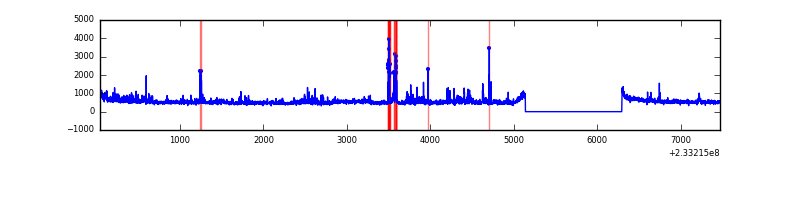 |
| B | 7426 | 6271 | 0 | 0 | 0.00% | 0.00% | 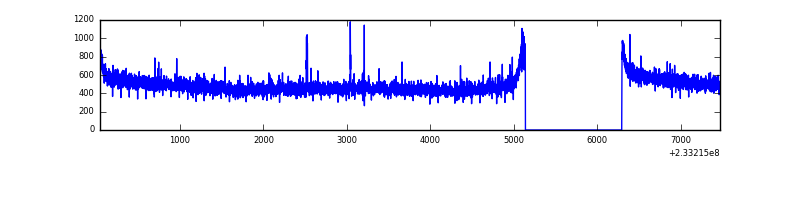 |
| C | 7426 | 6271 | 0 | 0 | 0.00% | 0.00% | 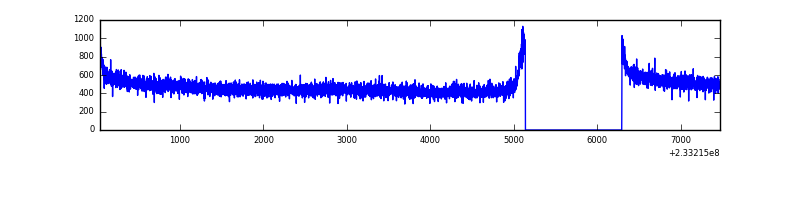 |
| D | 7426 | 6271 | 5 | 5 | 0.07% | 0.08% | 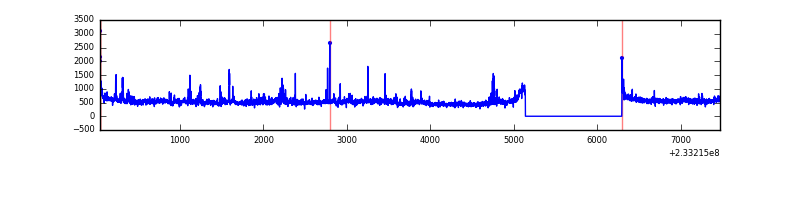 |
Top three noisy pixels from each quadrant. If the there are fewer than three noisy pixels in the level2.evt file, extra rows are filled as -1
| Pixel properties | Quadrant properties | ||||||
|---|---|---|---|---|---|---|---|
| Quadrant | DetID | PixID | Counts | Sigma | Mean | Median | Sigma |
| A | 8 | 5 | 381596 | 2440.8 | 777 | 763 | 156.0 |
| A | 15 | 174 | 113252 | 720.95 | 777 | 763 | 156.0 |
| A | 13 | 164 | 24187 | 150.13 | 777 | 763 | 156.0 |
| B | 12 | 111 | 15560 | 100.41 | 784 | 766 | 147.3 |
| B | 6 | 51 | 13534 | 86.66 | 784 | 766 | 147.3 |
| B | 11 | 111 | 12293 | 78.24 | 784 | 766 | 147.3 |
| C | 13 | 61 | 5944 | 29.54 | 761 | 764 | 175.4 |
| C | 8 | 222 | 2126 | 7.77 | 761 | 764 | 175.4 |
| C | 3 | 202 | 1947 | 6.75 | 761 | 764 | 175.4 |
| D | 1 | 52 | 266943 | 1441.69 | 755 | 736 | 184.6 |
| D | 8 | 195 | 115536 | 621.72 | 755 | 736 | 184.6 |
| D | 12 | 233 | 71495 | 383.21 | 755 | 736 | 184.6 |
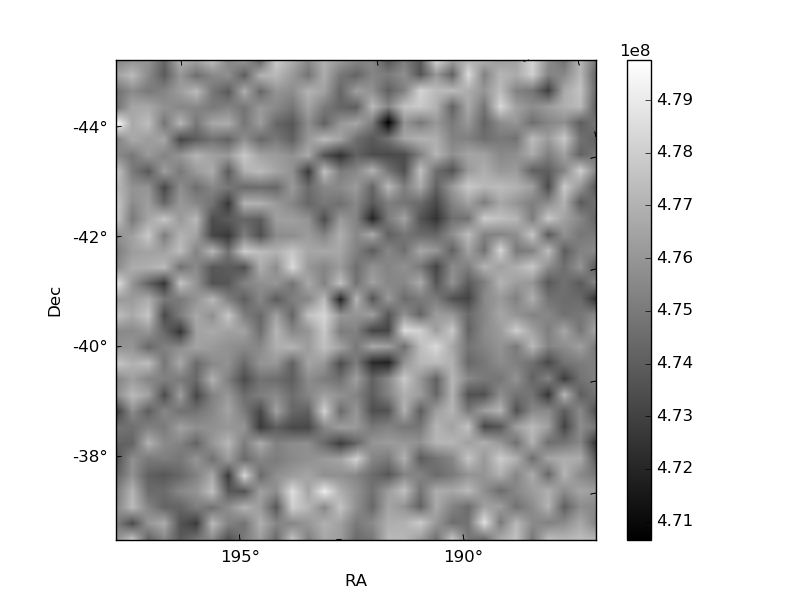
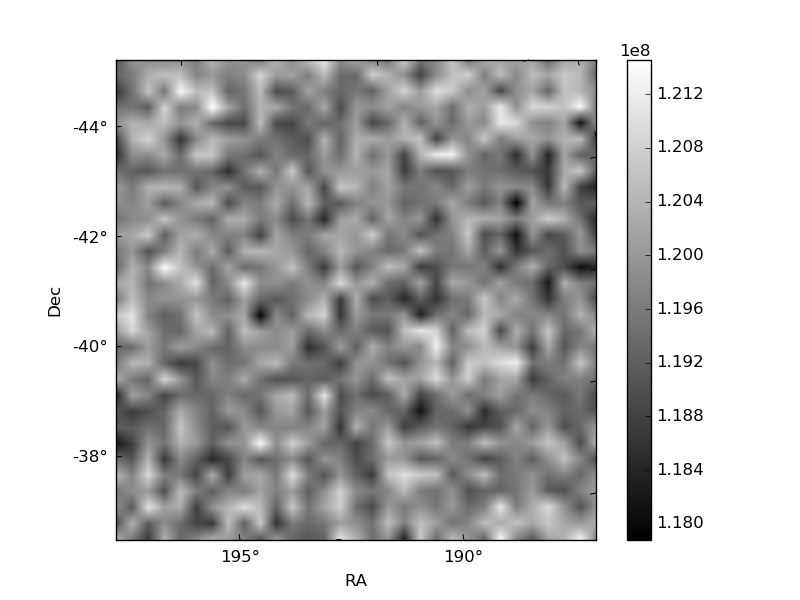
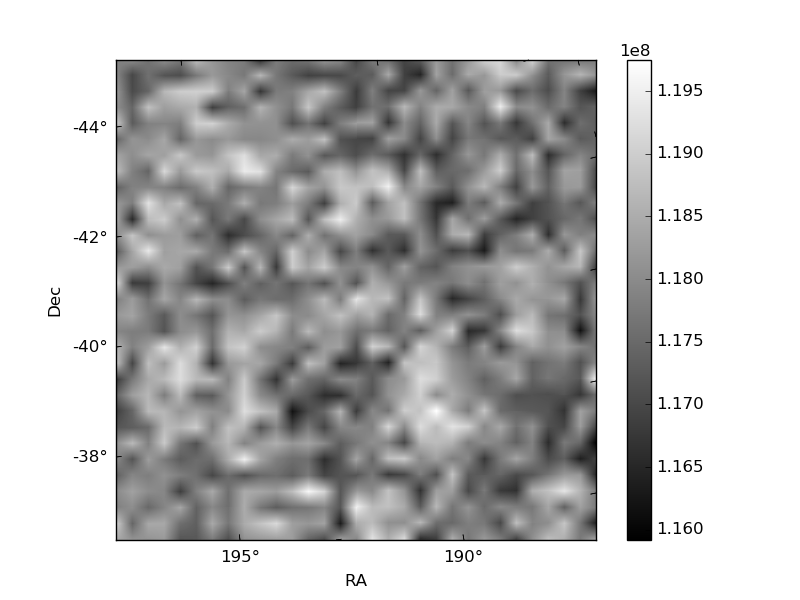
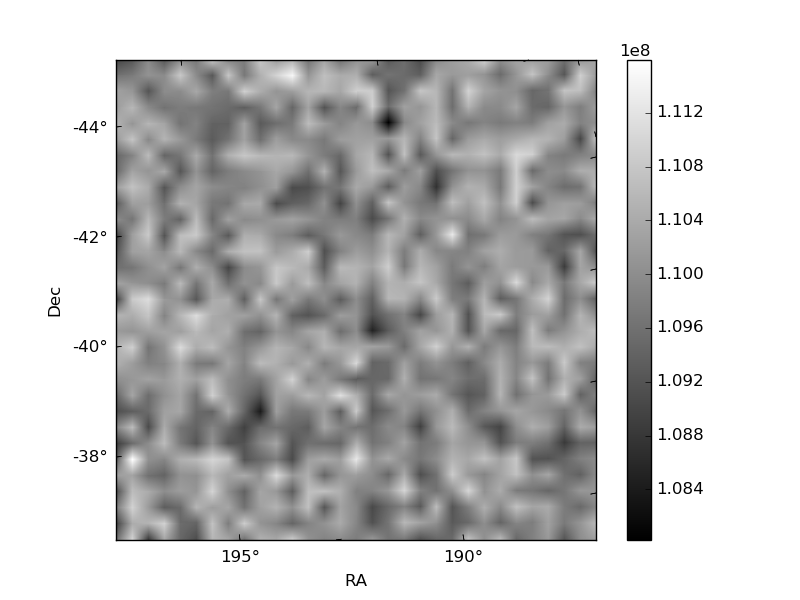
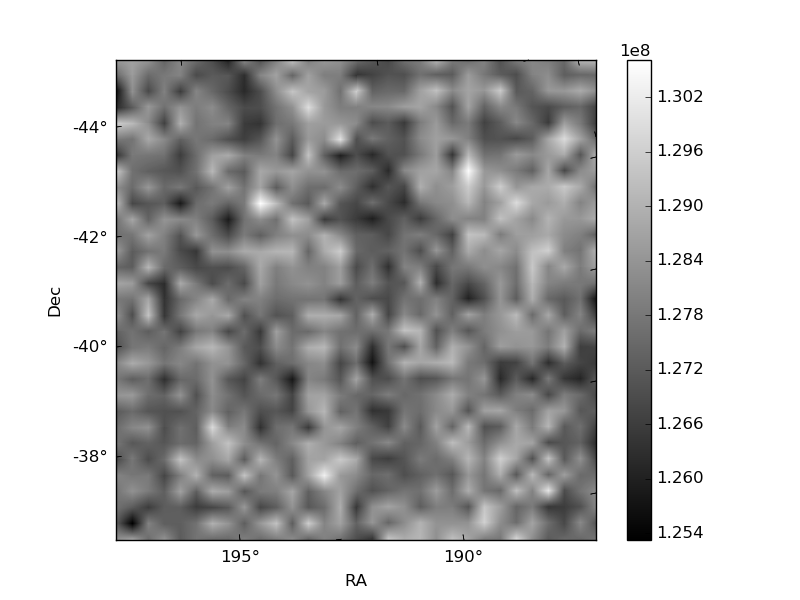
Histogram calculated using DETX and DETY for each event in the final _common_clean file
| Quadrant A | 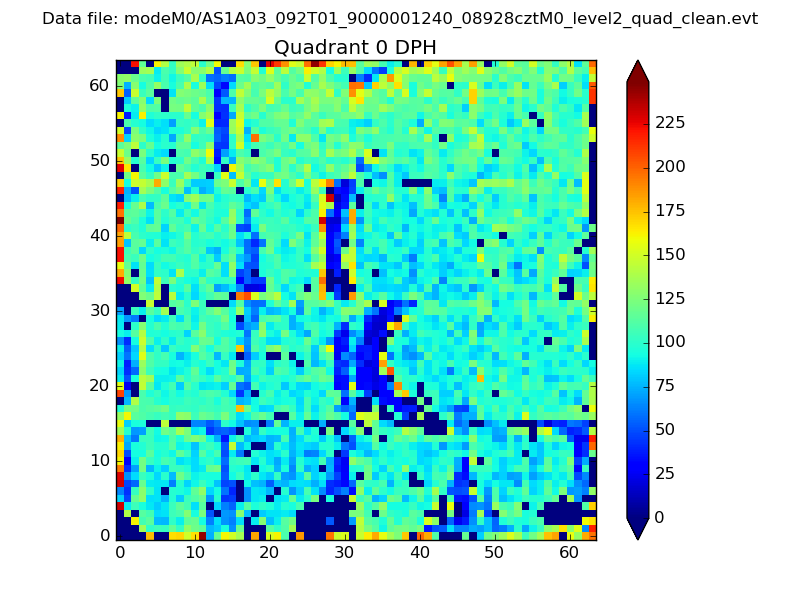 |
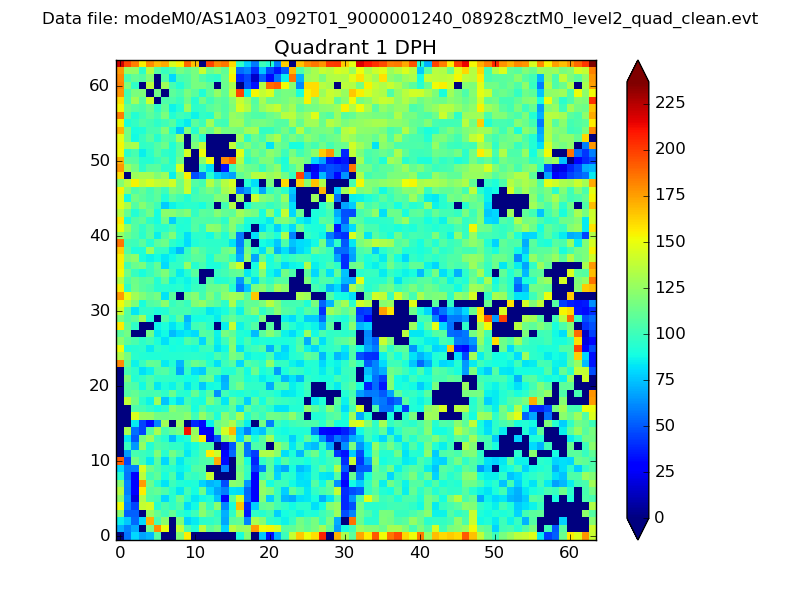 |
Quadrant B |
|---|---|---|---|
| Quadrant D | 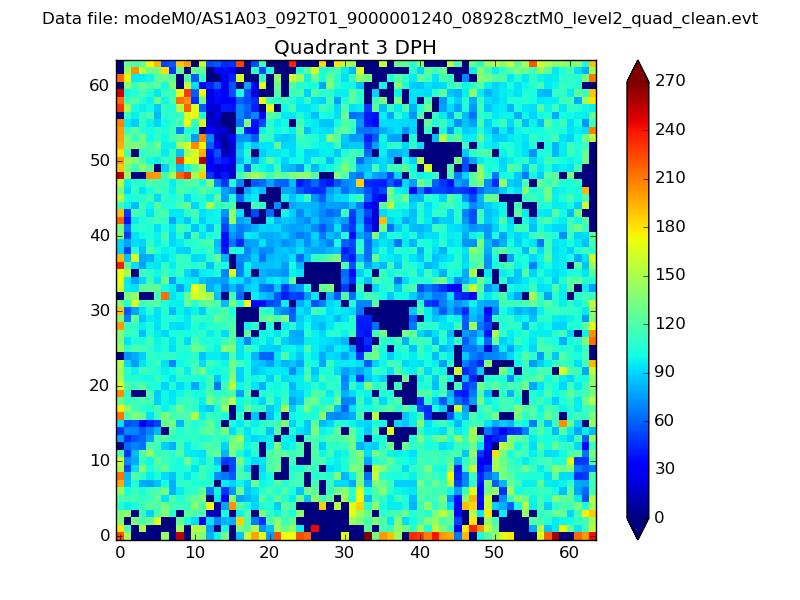 |
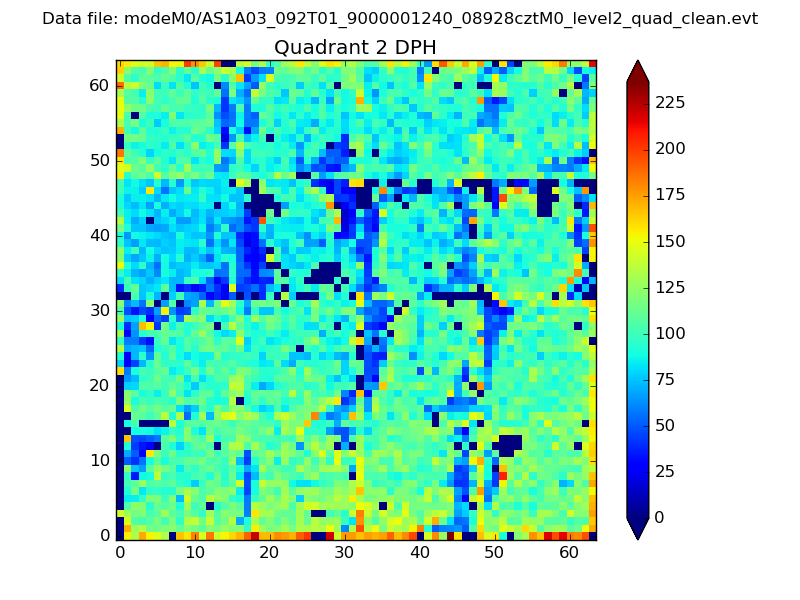 |
Quadrant C |
| Plot type | Count rate plots | Images |
|---|---|---|
| Comparison with Poisson distribution Blue bars denote a histogram of data divided into 1 sec bins. Red curve is a Poisson curve with rate = median count rate of data. |
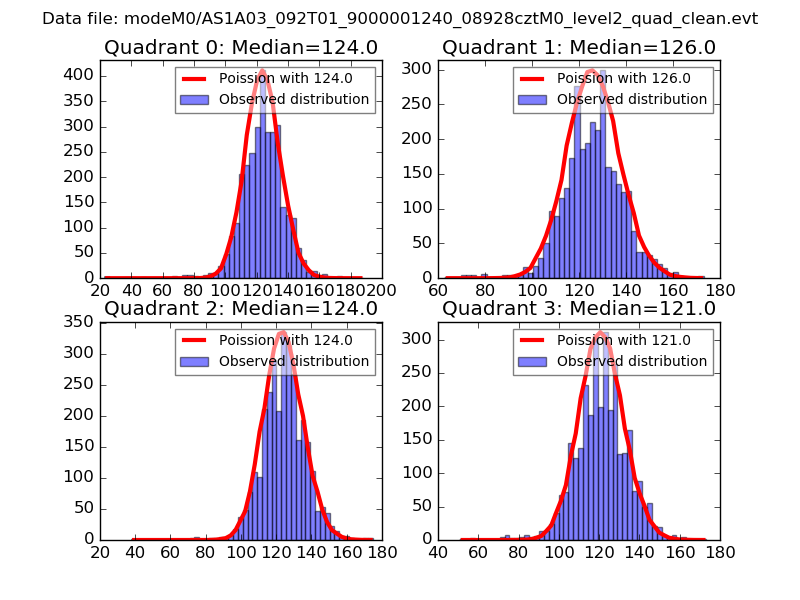 |
 |
| Quadrant-wise count rates Data is divided into 100 sec bins |
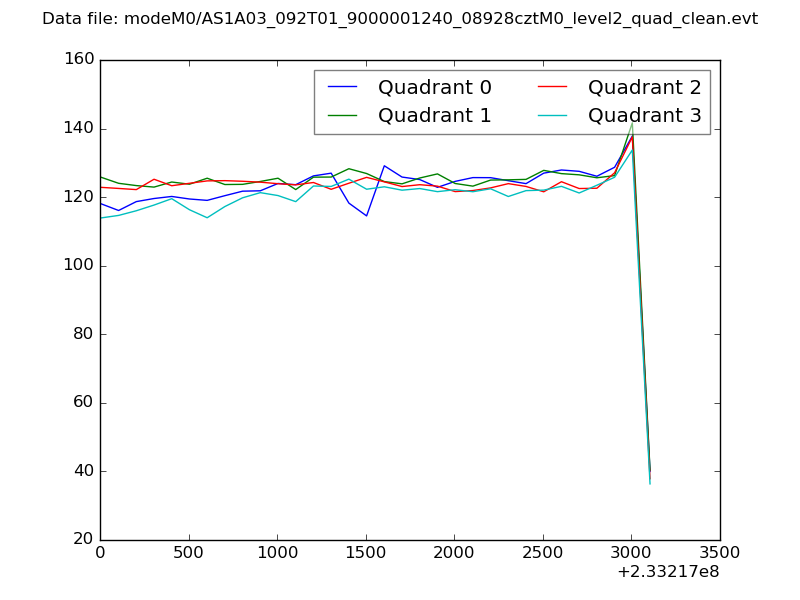 |
|
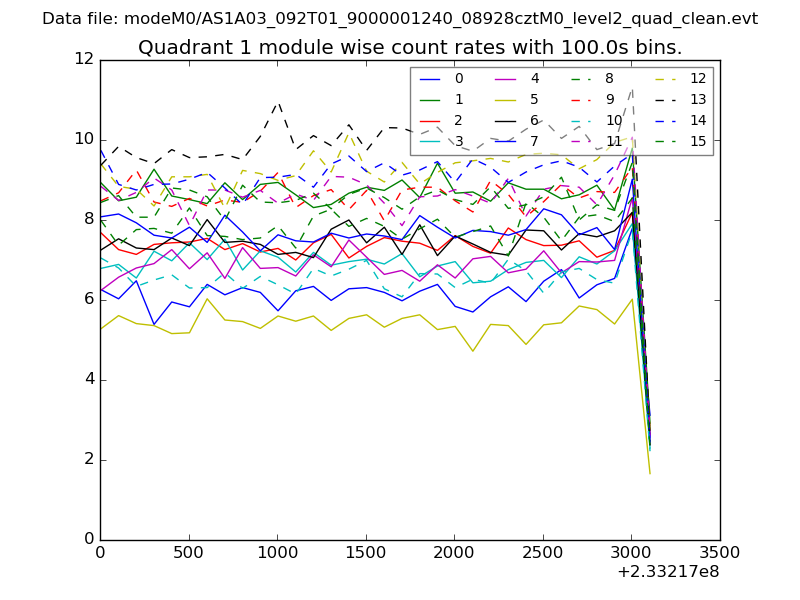
| Module-wise count rates for Quadrant A Data is divided into 100 sec bins |
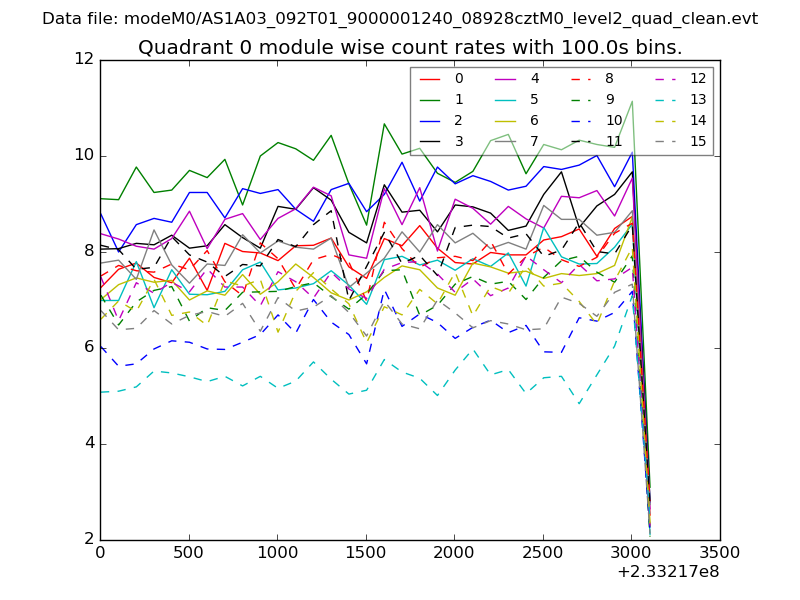 |
 |
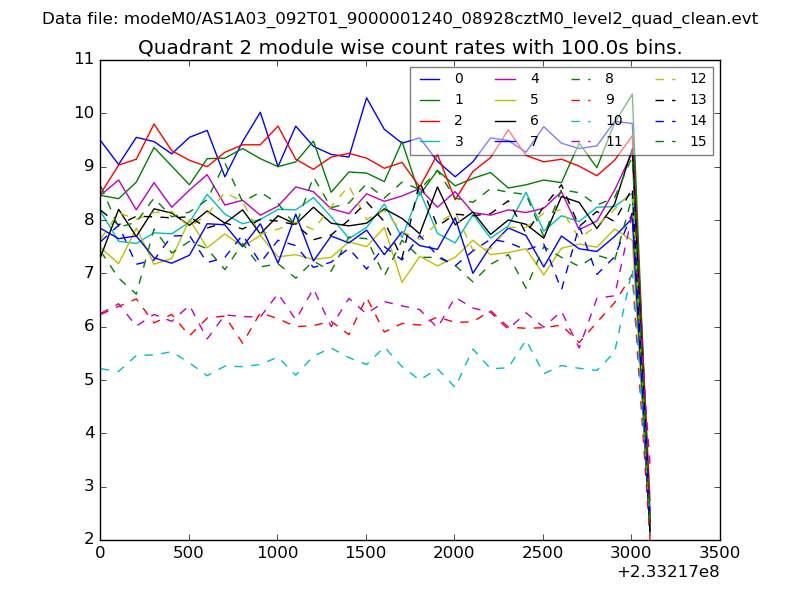
| Module-wise count rates for Quadrant B Data is divided into 100 sec bins |
 |
 |
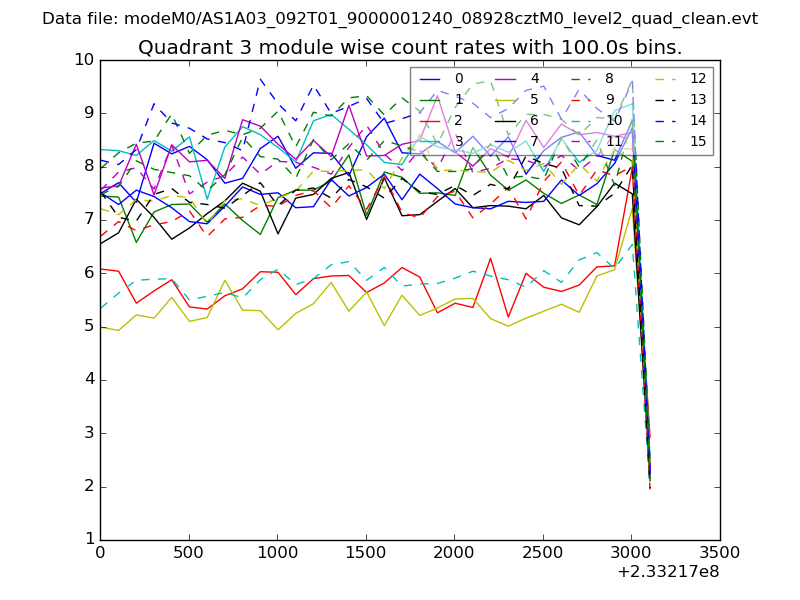
| Module-wise count rates for Quadrant C Data is divided into 100 sec bins |
 |
 |
| Module-wise count rates for Quadrant D Data is divided into 100 sec bins |
 |
 |
| Parameter | Plot |
|---|---|
| CZT HV Monitor | 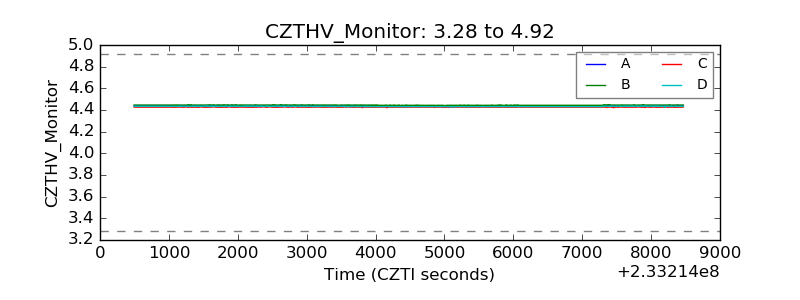 |
| D_VDD | 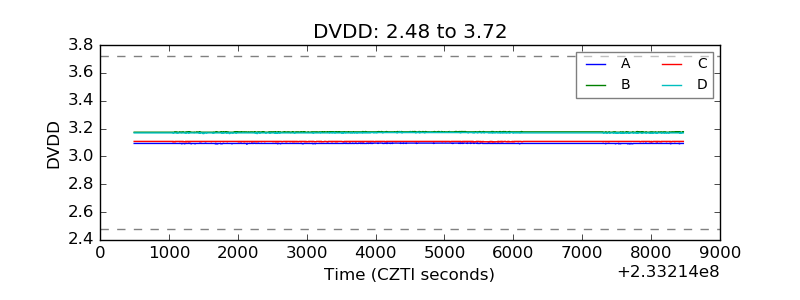 |
| Temperature 1 | 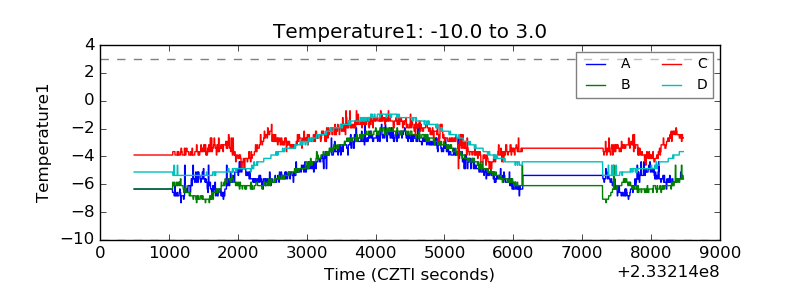 |
| Veto HV Monitor | 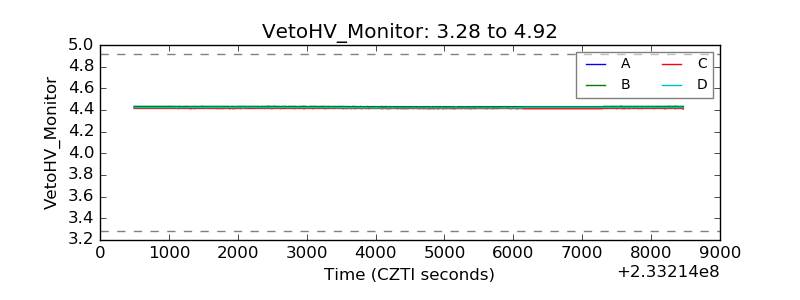 |
| Veto LLD | 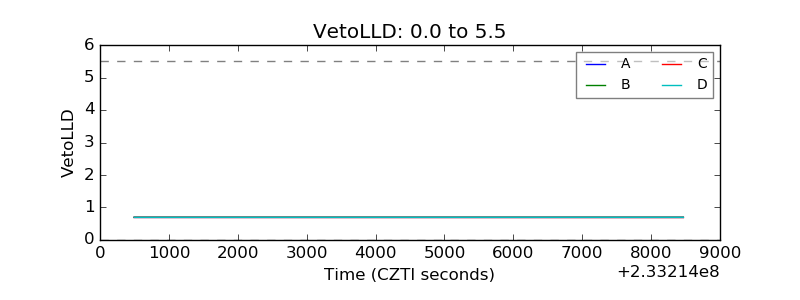 |
| Alpha Counter | 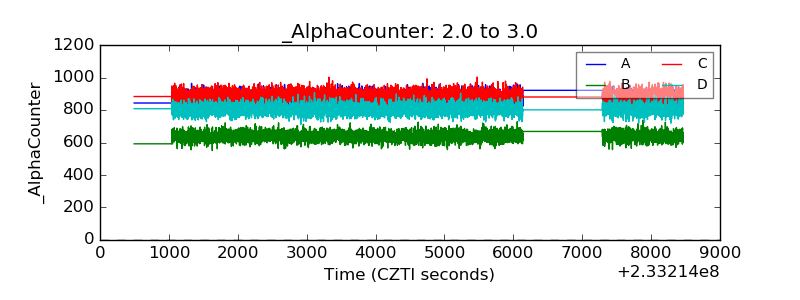 |
| _CPM_Rate | 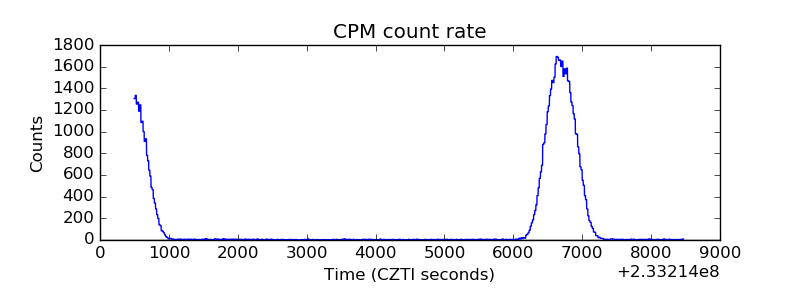 |
| CZT Counter | 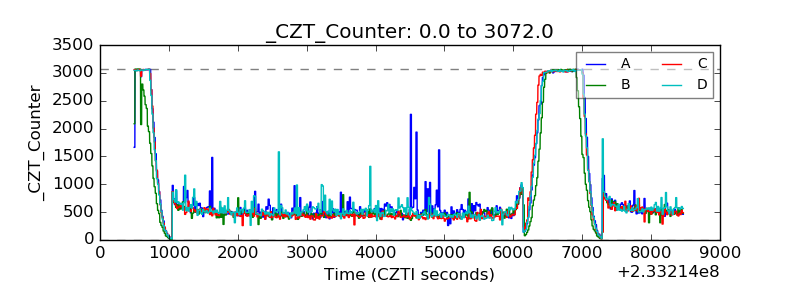 |
| +2.5 Volts monitor |  |
| +5 Volts monitor |  |
| _ROLL_ROT | 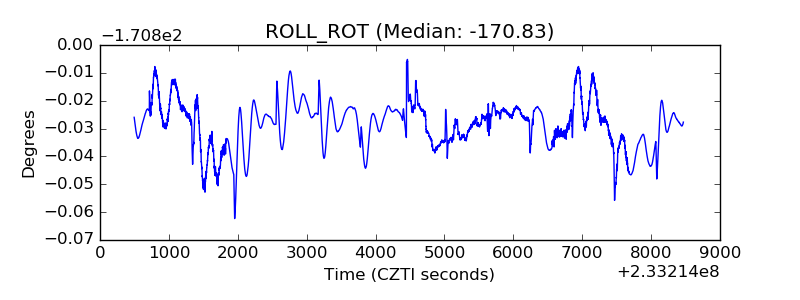 |
| _Roll_DEC | 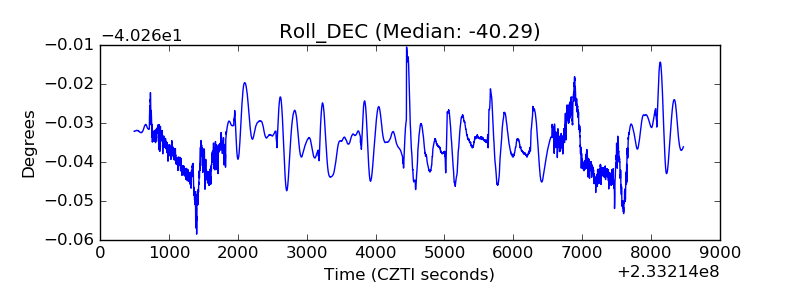 |
| _Roll_RA | 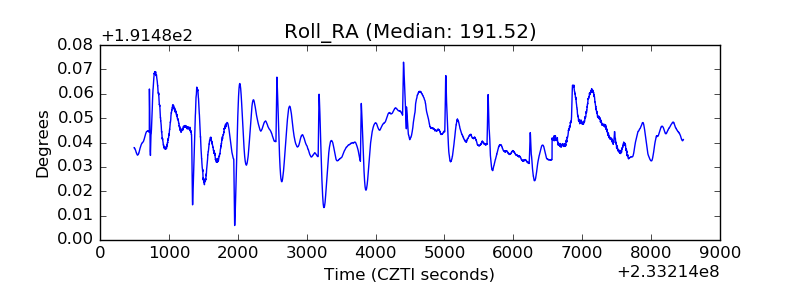 |
| Veto Counter | 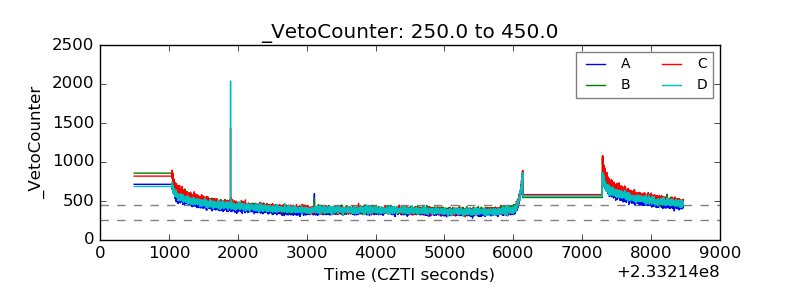 |