| Param | Original file | Final file |
|---|---|---|
| Filename | modeM0/AS1A03_092T01_9000001240_08929cztM0_level2.evt | modeM0/AS1A03_092T01_9000001240_08929cztM0_level2_quad_clean.evt |
| Size (bytes) | 466,678,080 | 76,412,160 |
| Size | 445.1 MB | 72.9 MB |
| Events in quadrant A | 3,830,674 | 467,736 |
| Events in quadrant B | 3,203,910 | 477,219 |
| Events in quadrant C | 3,105,785 | 471,027 |
| Events in quadrant D | 3,563,865 | 456,712 |
| Mode M9 | |||
|---|---|---|---|
| Quadrant | BADHDUFLAG | Total packets | Discarded packets |
| A | 0 | 15 | 0 |
| B | 0 | 15 | 0 |
| C | 0 | 15 | 0 |
| D | 0 | 16 | 0 |
| Mode SS | |||
|---|---|---|---|
| Quadrant | BADHDUFLAG | Total packets | Discarded packets |
| A | 0 | 130 | 0 |
| B | 0 | 130 | 0 |
| C | 0 | 130 | 0 |
| D | 0 | 130 | 0 |
| Mode M0 | |||
|---|---|---|---|
| Quadrant | BADHDUFLAG | Total packets | Discarded packets |
| A | 0 | 15389 | 6 |
| B | 0 | 13411 | 2 |
| C | 0 | 13317 | 2 |
| D | 0 | 14517 | 2 |
| Quadrant | Total seconds | Saturated seconds | Saturation percentage |
|---|---|---|---|
| A | 6313 | 117 | 1.853319% |
| B | 6314 | 93 | 1.472917% |
| C | 6314 | 92 | 1.457080% |
| D | 6314 | 86 | 1.362053% |
Noise dominated data is calculated using 1-second bins in cleaned event files. If a bin has >2000 counts, and if more than 50% of those come from <1% of pixels, then it is considered to be noise-dominated and hence unusable.
| Quadrant | # 1 sec bins | Bins with >0 counts | Bins with >2000 counts | High rate bins dominated by noise | Noise dominated (total time) | Noise dominated (detector-on time) | Marked lightcurve |
|---|---|---|---|---|---|---|---|
| A | 7549 | 6314 | 24 | 24 | 0.32% | 0.38% | 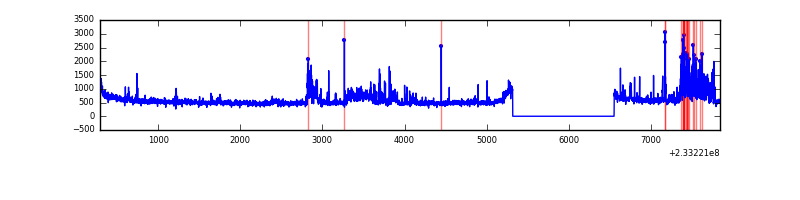 |
| B | 7549 | 6314 | 3 | 3 | 0.04% | 0.05% | 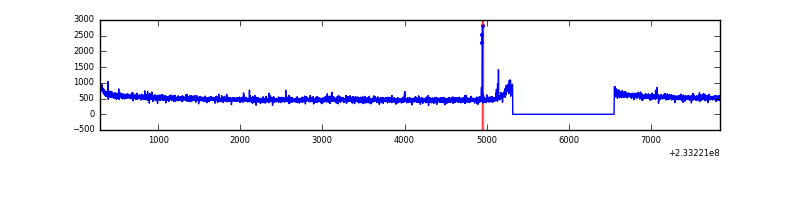 |
| C | 7549 | 6314 | 0 | 0 | 0.00% | 0.00% | 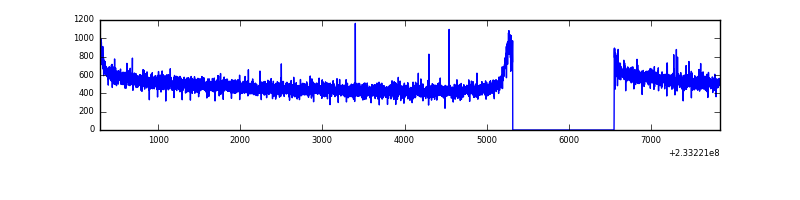 |
| D | 7549 | 6314 | 11 | 11 | 0.15% | 0.17% | 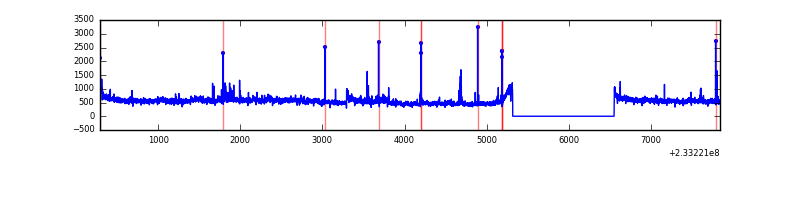 |
Top three noisy pixels from each quadrant. If the there are fewer than three noisy pixels in the level2.evt file, extra rows are filled as -1
| Pixel properties | Quadrant properties | ||||||
|---|---|---|---|---|---|---|---|
| Quadrant | DetID | PixID | Counts | Sigma | Mean | Median | Sigma |
| A | 8 | 5 | 630769 | 3864.58 | 814 | 799 | 163.0 |
| A | 15 | 174 | 38593 | 231.85 | 814 | 799 | 163.0 |
| A | 13 | 164 | 13183 | 75.97 | 814 | 799 | 163.0 |
| B | 12 | 111 | 15971 | 99.39 | 818 | 800 | 152.6 |
| B | 0 | 229 | 13424 | 82.71 | 818 | 800 | 152.6 |
| B | 11 | 111 | 12817 | 78.73 | 818 | 800 | 152.6 |
| C | 13 | 61 | 6007 | 28.65 | 795 | 801 | 181.7 |
| C | 8 | 222 | 2037 | 6.8 | 795 | 801 | 181.7 |
| C | 3 | 202 | 2031 | 6.77 | 795 | 801 | 181.7 |
| D | 8 | 195 | 242729 | 1265.35 | 793 | 776 | 191.2 |
| D | 1 | 52 | 131286 | 682.53 | 793 | 776 | 191.2 |
| D | 5 | 239 | 78840 | 408.25 | 793 | 776 | 191.2 |
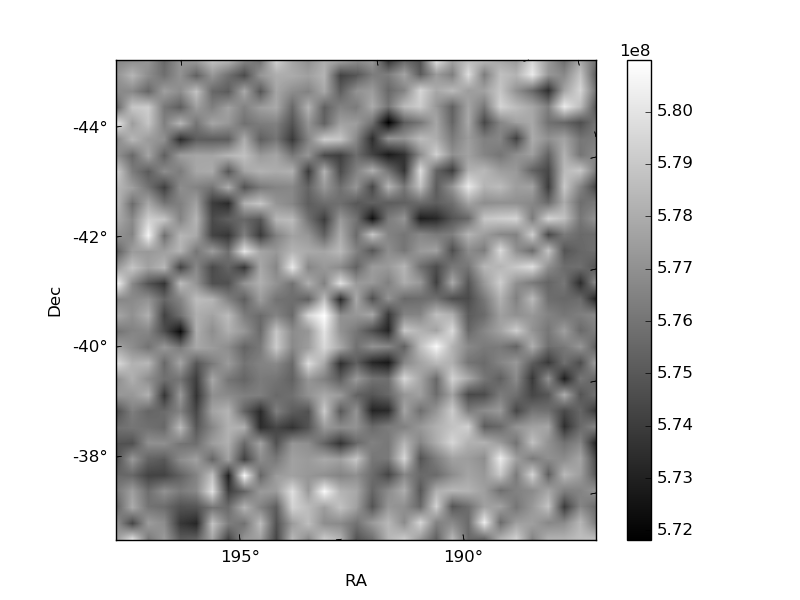
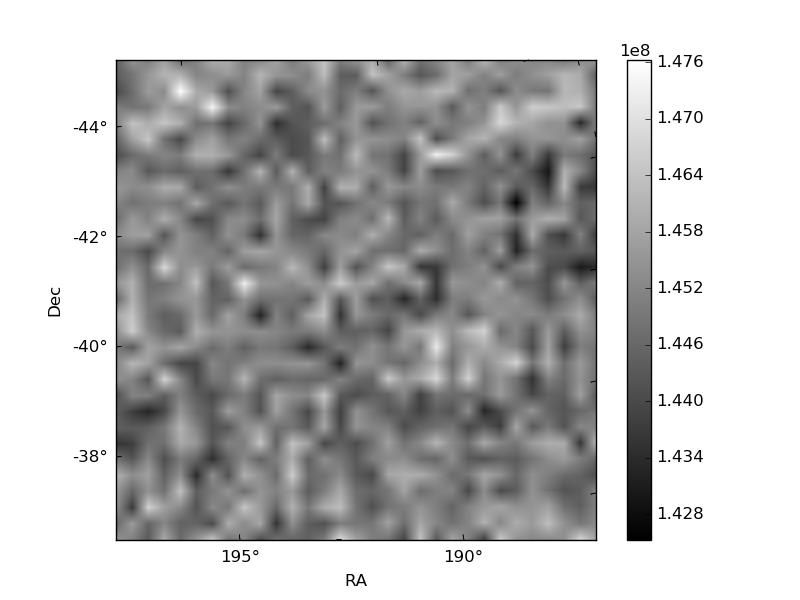
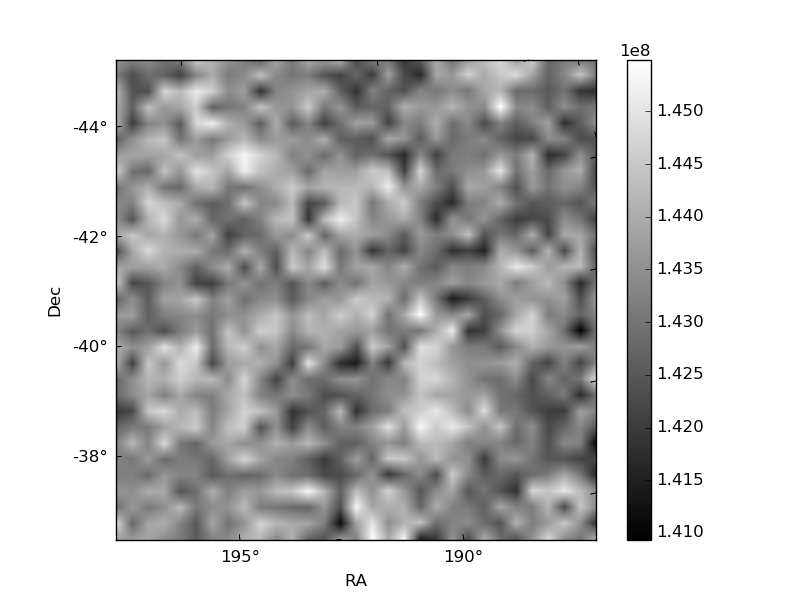
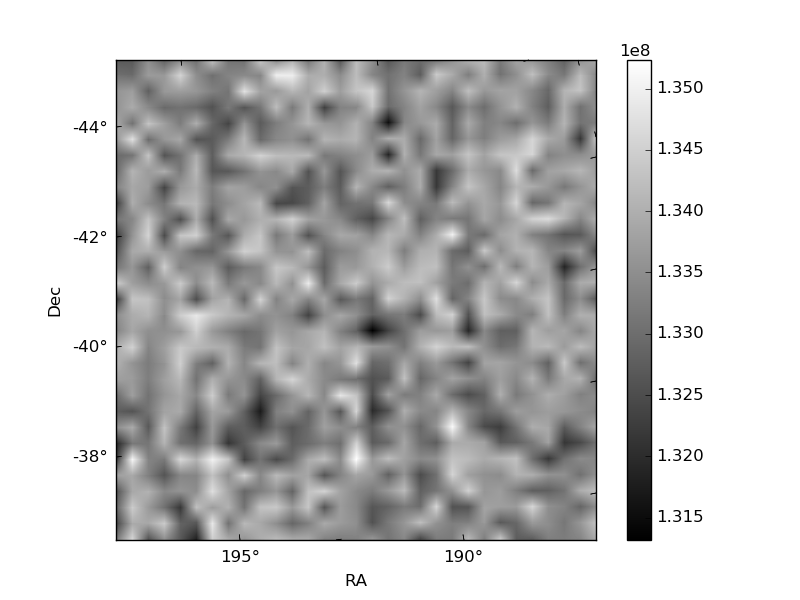
Histogram calculated using DETX and DETY for each event in the final _common_clean file
| Quadrant A | 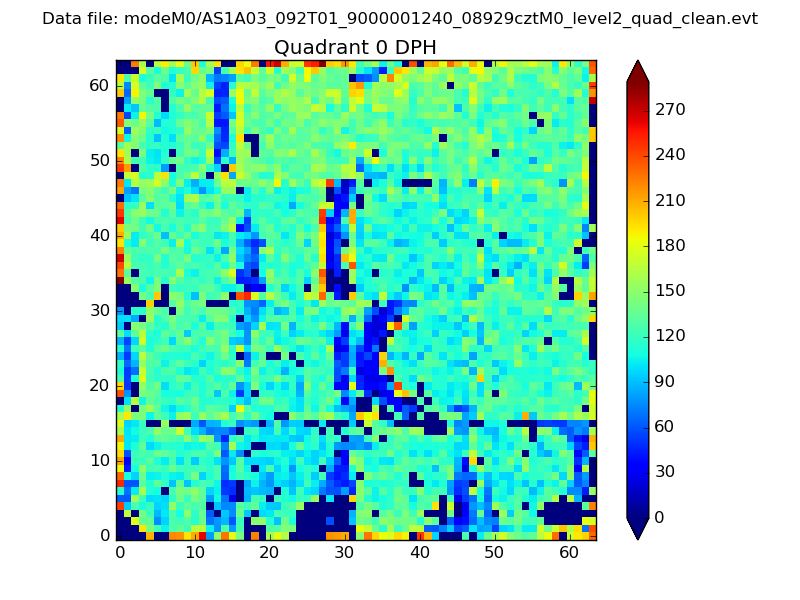 |
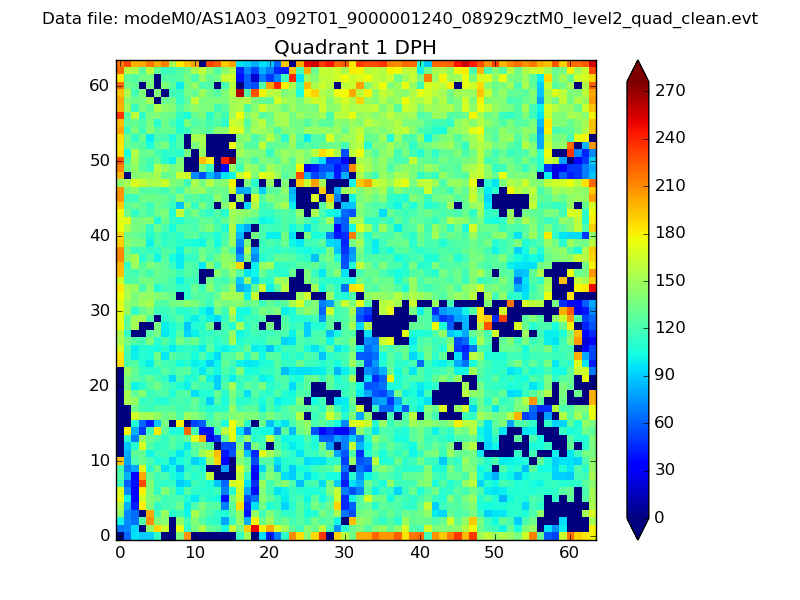 |
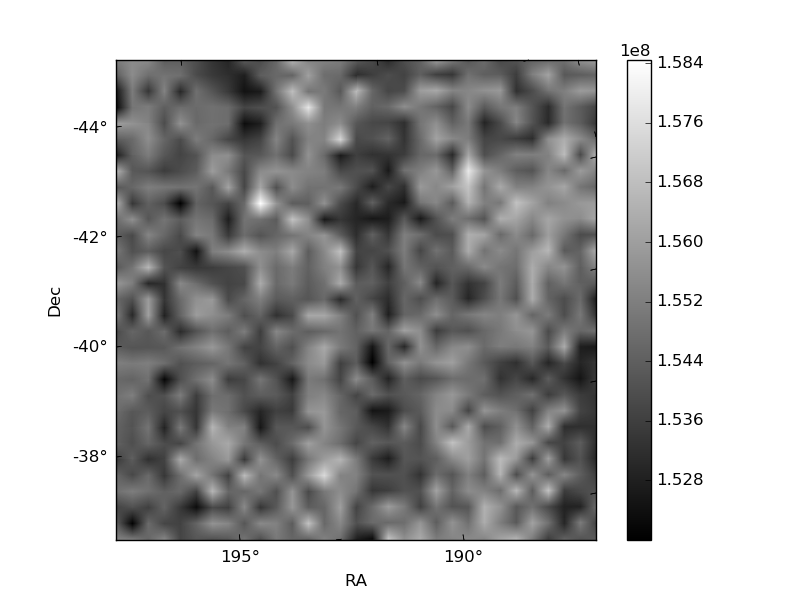
Quadrant B |
|---|---|---|---|
| Quadrant D | 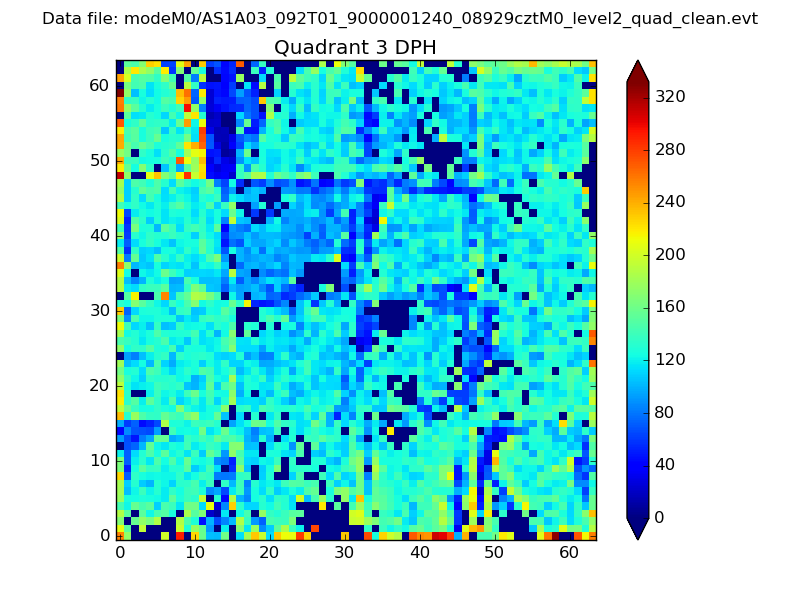 |
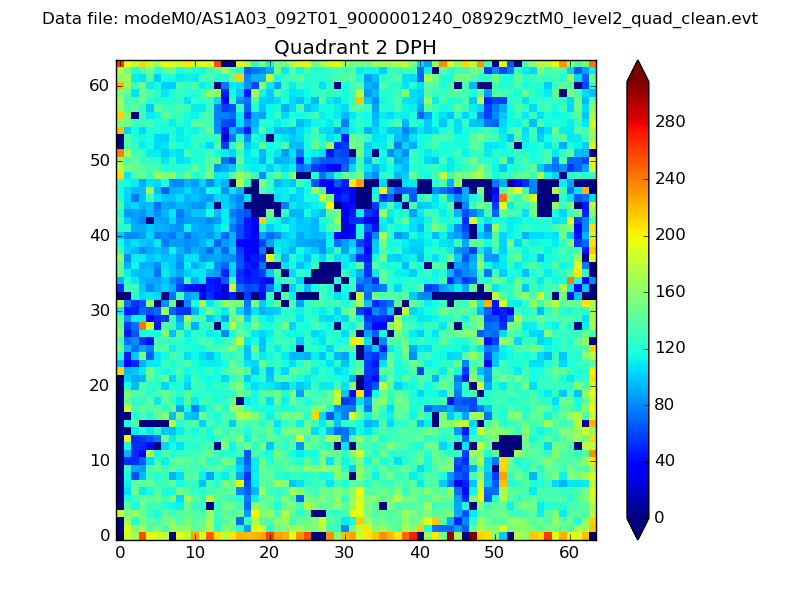 |
Quadrant C |
| Plot type | Count rate plots | Images |
|---|---|---|
| Comparison with Poisson distribution Blue bars denote a histogram of data divided into 1 sec bins. Red curve is a Poisson curve with rate = median count rate of data. |
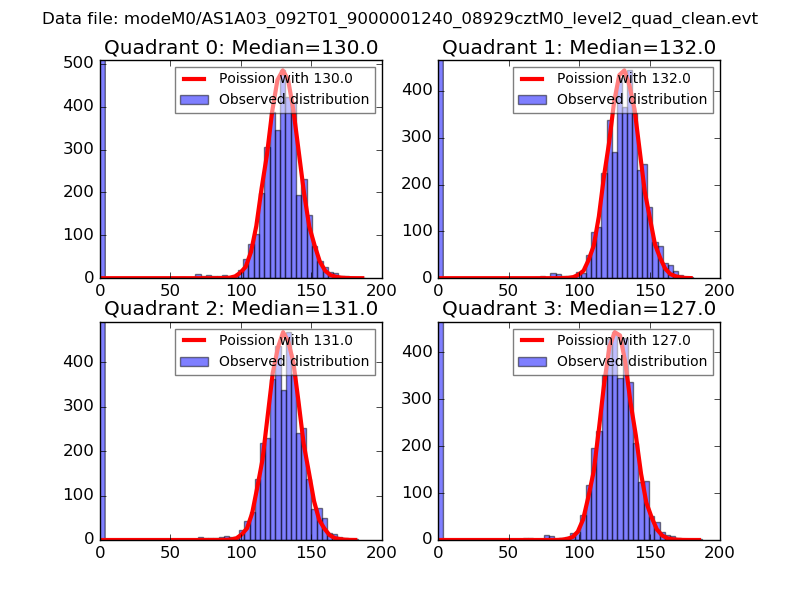 |
 |
| Quadrant-wise count rates Data is divided into 100 sec bins |
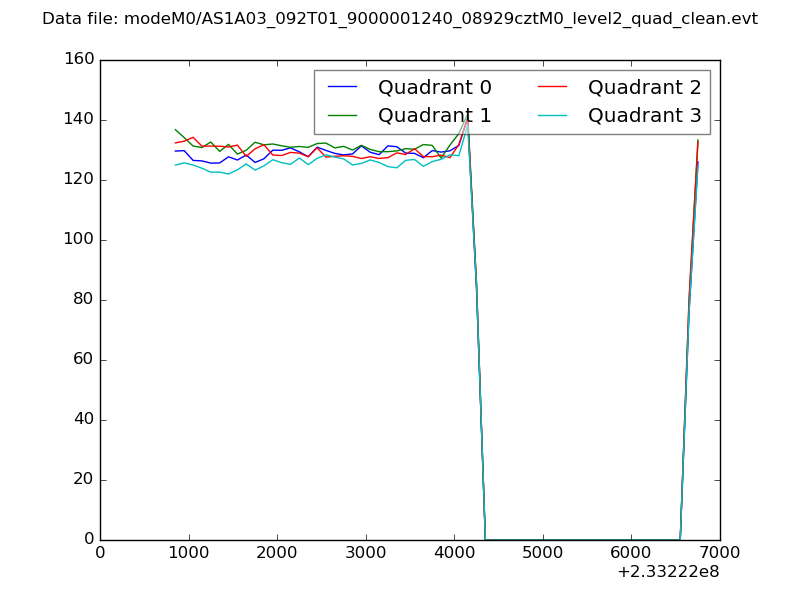 |
|
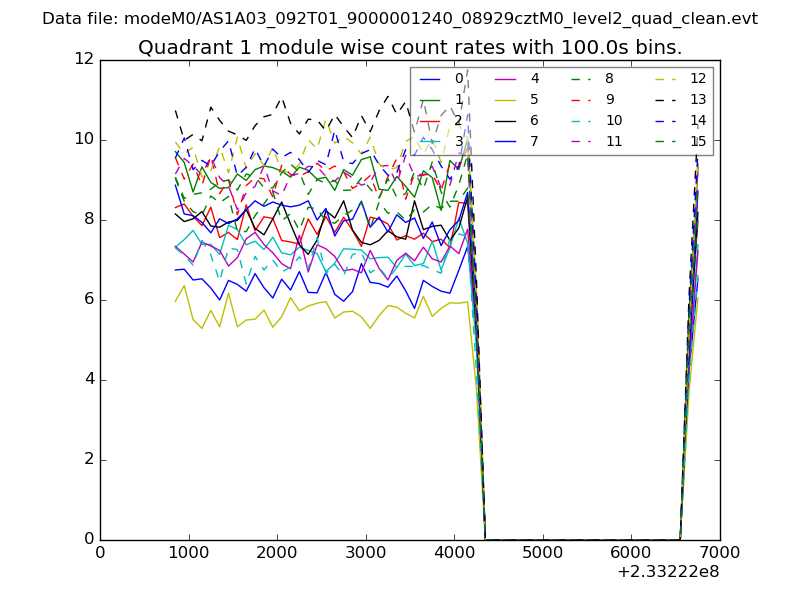
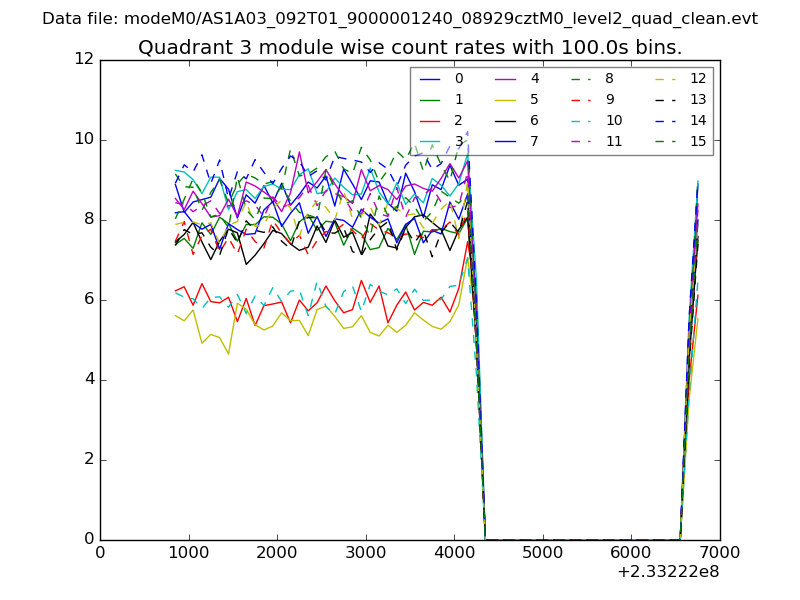
| Module-wise count rates for Quadrant A Data is divided into 100 sec bins |
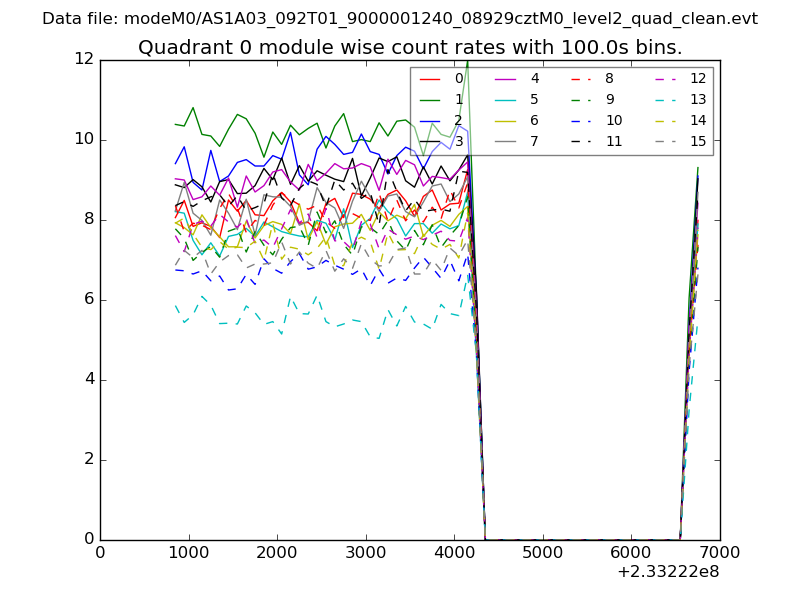 |
 |
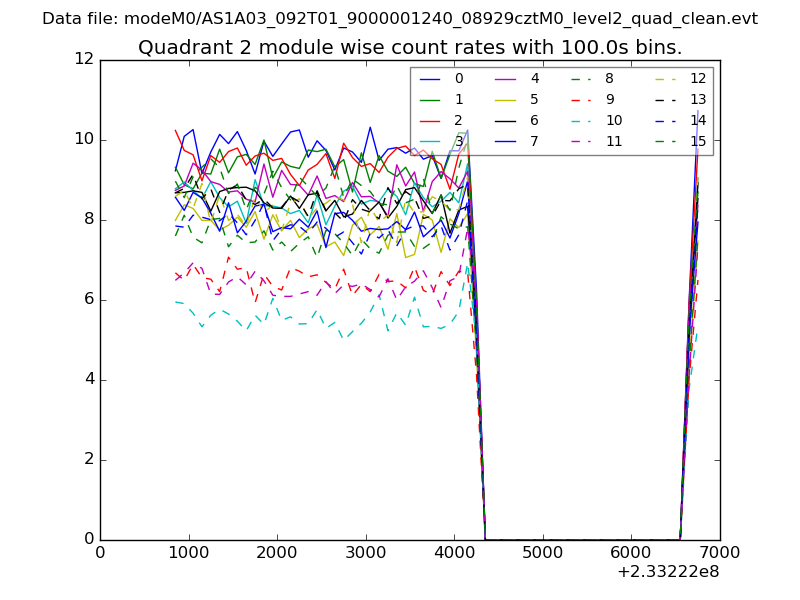
| Module-wise count rates for Quadrant B Data is divided into 100 sec bins |
 |
 |
| Module-wise count rates for Quadrant C Data is divided into 100 sec bins |
 |
 |
| Module-wise count rates for Quadrant D Data is divided into 100 sec bins |
 |
 |
| Parameter | Plot |
|---|---|
| CZT HV Monitor | 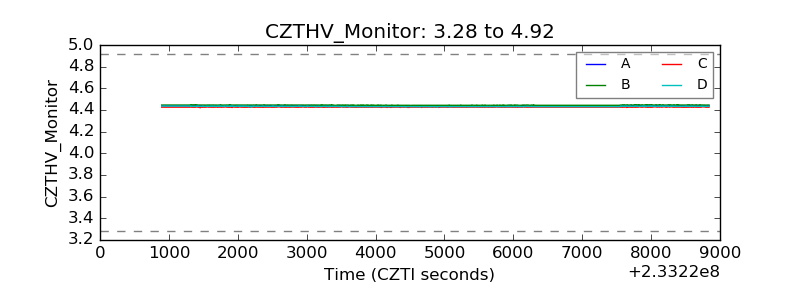 |
| D_VDD | 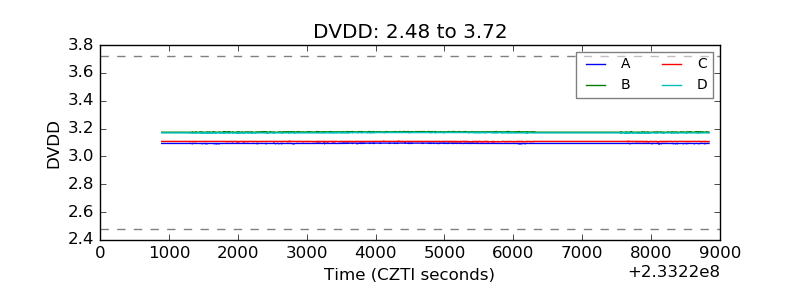 |
| Temperature 1 | 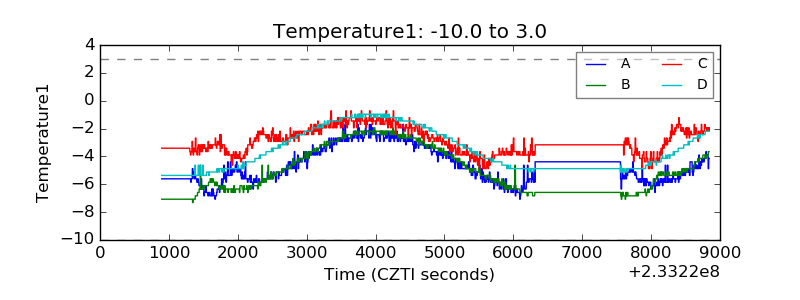 |
| Veto HV Monitor | 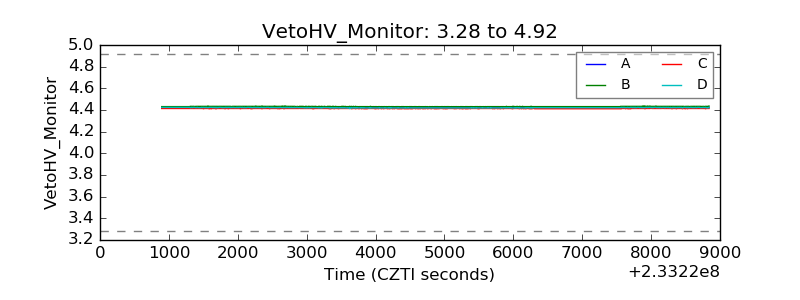 |
| Veto LLD | 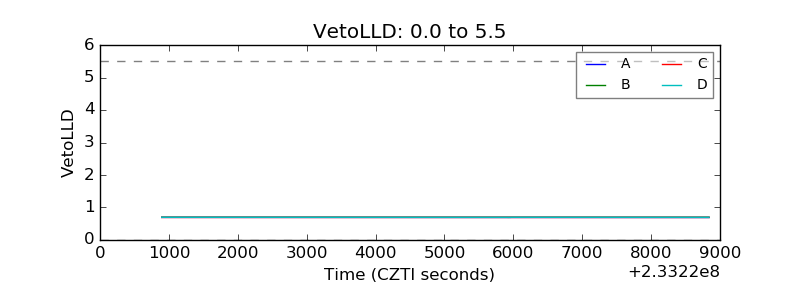 |
| Alpha Counter | 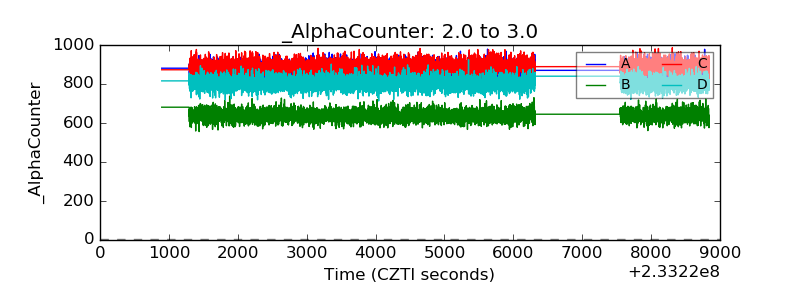 |
| _CPM_Rate | 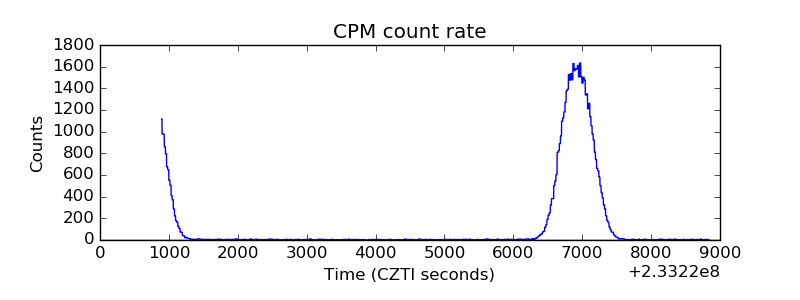 |
| CZT Counter | 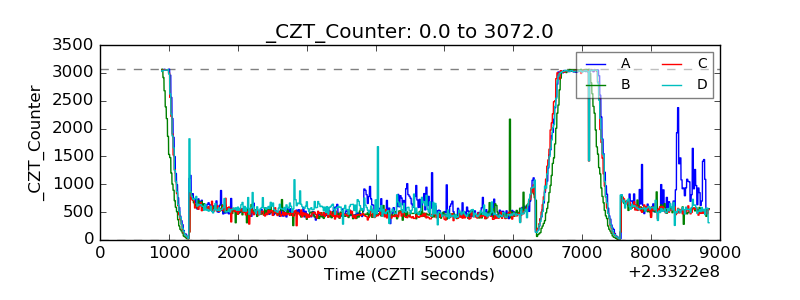 |
| +2.5 Volts monitor | 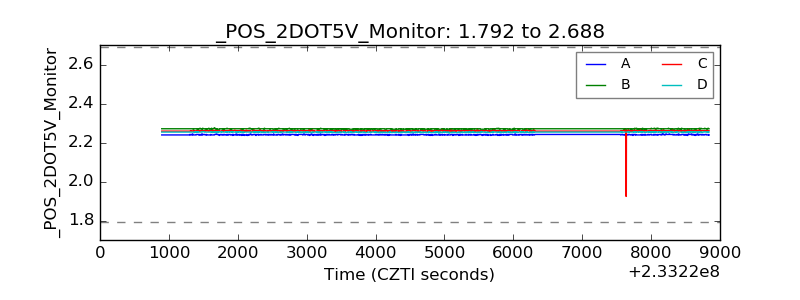 |
| +5 Volts monitor |  |
| _ROLL_ROT | 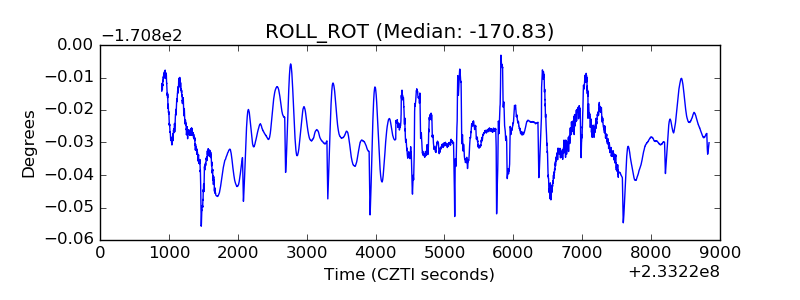 |
| _Roll_DEC | 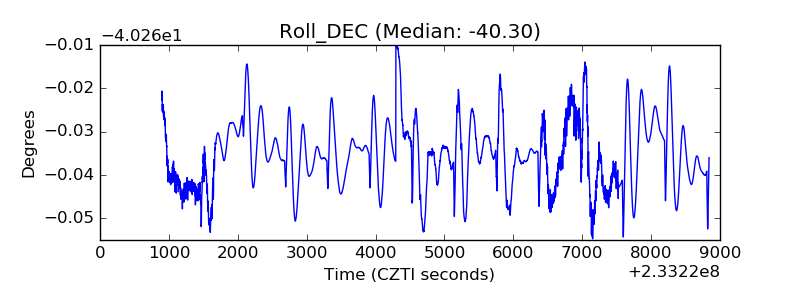 |
| _Roll_RA | 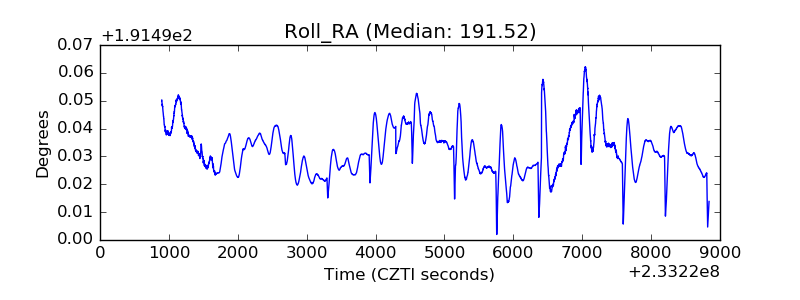 |
| Veto Counter | 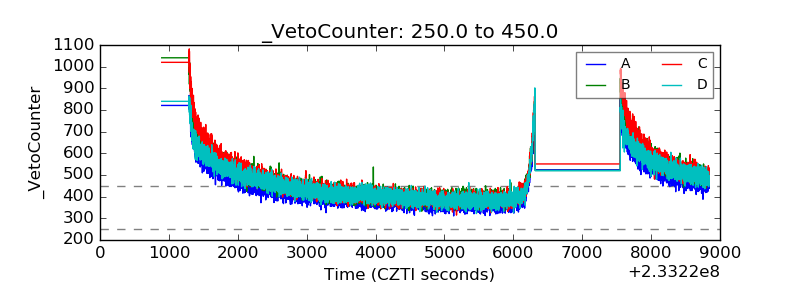 |