| Param | Original file | Final file |
|---|---|---|
| Filename | modeM0/AS1A03_092T01_9000001240_08930cztM0_level2.evt | modeM0/AS1A03_092T01_9000001240_08930cztM0_level2_quad_clean.evt |
| Size (bytes) | 491,299,200 | 92,160,000 |
| Size | 468.5 MB | 87.9 MB |
| Events in quadrant A | 4,033,807 | 589,771 |
| Events in quadrant B | 3,199,155 | 602,161 |
| Events in quadrant C | 3,093,633 | 590,116 |
| Events in quadrant D | 4,127,816 | 572,059 |
| Mode M9 | |||
|---|---|---|---|
| Quadrant | BADHDUFLAG | Total packets | Discarded packets |
| A | 0 | 14 | 0 |
| B | 0 | 14 | 0 |
| C | 0 | 14 | 0 |
| D | 0 | 15 | 0 |
| Mode SS | |||
|---|---|---|---|
| Quadrant | BADHDUFLAG | Total packets | Discarded packets |
| A | 0 | 126 | 0 |
| B | 0 | 126 | 0 |
| C | 0 | 126 | 0 |
| D | 0 | 126 | 0 |
| Mode M0 | |||
|---|---|---|---|
| Quadrant | BADHDUFLAG | Total packets | Discarded packets |
| A | 0 | 16007 | 3 |
| B | 0 | 13296 | 2 |
| C | 0 | 13208 | 2 |
| D | 0 | 16174 | 2 |
| Quadrant | Total seconds | Saturated seconds | Saturation percentage |
|---|---|---|---|
| A | 6266 | 163 | 2.601341% |
| B | 6266 | 97 | 1.548037% |
| C | 6266 | 89 | 1.420364% |
| D | 6266 | 132 | 2.106607% |
Noise dominated data is calculated using 1-second bins in cleaned event files. If a bin has >2000 counts, and if more than 50% of those come from <1% of pixels, then it is considered to be noise-dominated and hence unusable.
| Quadrant | # 1 sec bins | Bins with >0 counts | Bins with >2000 counts | High rate bins dominated by noise | Noise dominated (total time) | Noise dominated (detector-on time) | Marked lightcurve |
|---|---|---|---|---|---|---|---|
| A | 7541 | 6266 | 45 | 45 | 0.60% | 0.72% | 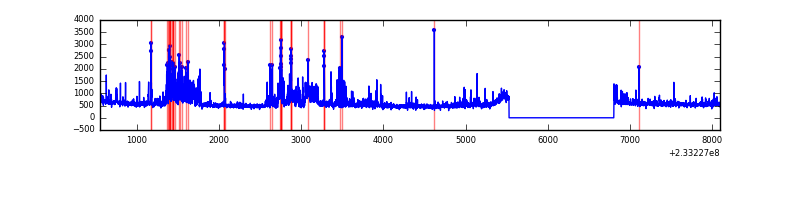 |
| B | 7541 | 6266 | 0 | 0 | 0.00% | 0.00% | 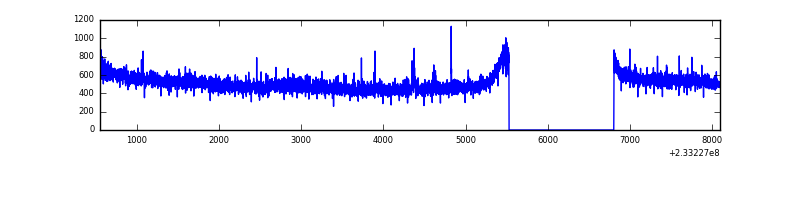 |
| C | 7541 | 6266 | 0 | 0 | 0.00% | 0.00% | 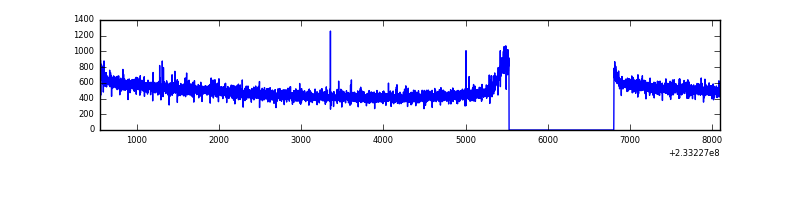 |
| D | 7541 | 6266 | 27 | 27 | 0.36% | 0.43% |  |
Top three noisy pixels from each quadrant. If the there are fewer than three noisy pixels in the level2.evt file, extra rows are filled as -1
| Pixel properties | Quadrant properties | ||||||
|---|---|---|---|---|---|---|---|
| Quadrant | DetID | PixID | Counts | Sigma | Mean | Median | Sigma |
| A | 8 | 5 | 816064 | 4970.93 | 816 | 801 | 164.0 |
| A | 15 | 174 | 46948 | 281.37 | 816 | 801 | 164.0 |
| A | 1 | 162 | 7503 | 40.86 | 816 | 801 | 164.0 |
| B | 0 | 214 | 17018 | 106.01 | 817 | 799 | 153.0 |
| B | 12 | 111 | 15834 | 98.27 | 817 | 799 | 153.0 |
| B | 11 | 111 | 12679 | 77.65 | 817 | 799 | 153.0 |
| C | 13 | 61 | 5897 | 28.26 | 793 | 797 | 180.5 |
| C | 3 | 202 | 2048 | 6.93 | 793 | 797 | 180.5 |
| C | 3 | 203 | 1758 | 5.33 | 793 | 797 | 180.5 |
| D | 1 | 52 | 643167 | 3310.62 | 793 | 775 | 194.0 |
| D | 8 | 195 | 228638 | 1174.31 | 793 | 775 | 194.0 |
| D | 2 | 14 | 77068 | 393.18 | 793 | 775 | 194.0 |
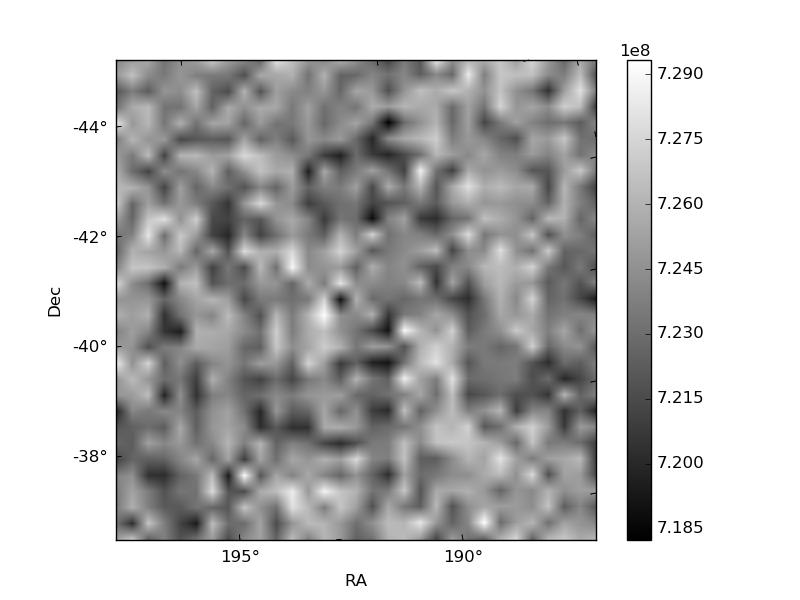
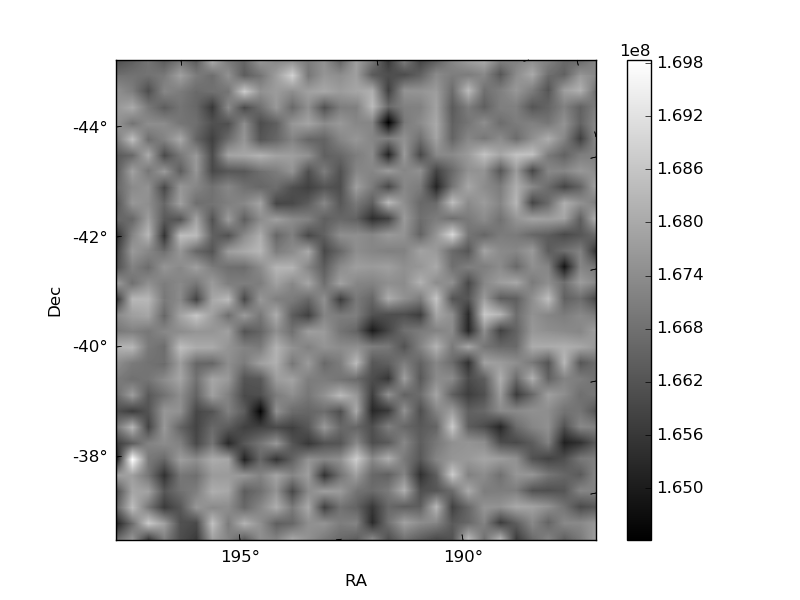
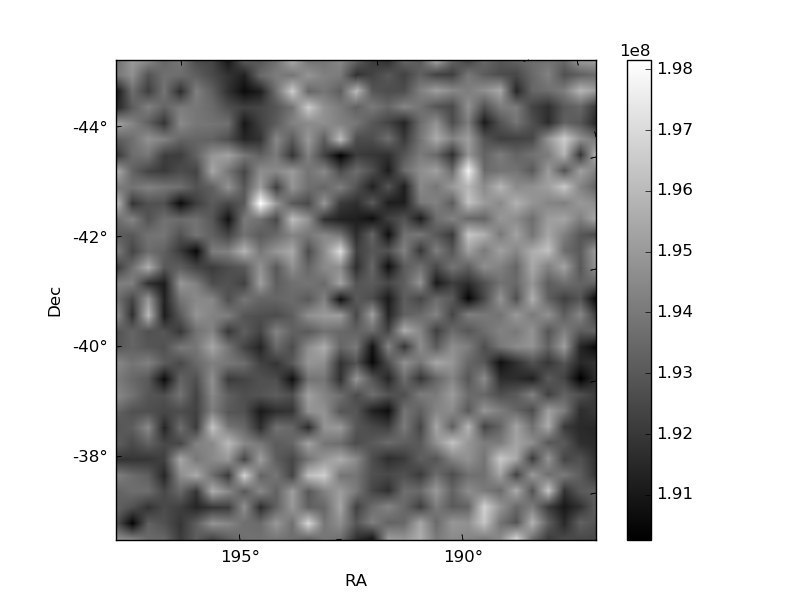
Histogram calculated using DETX and DETY for each event in the final _common_clean file
| Quadrant A | 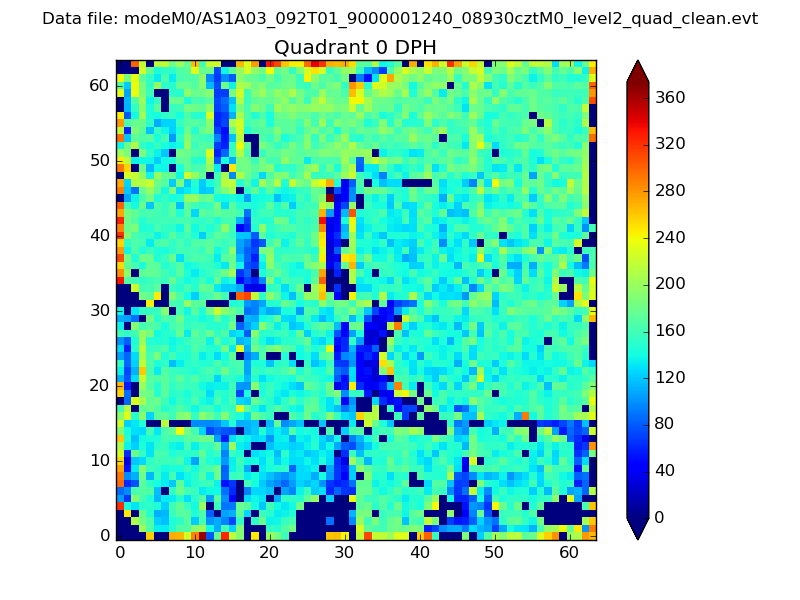 |
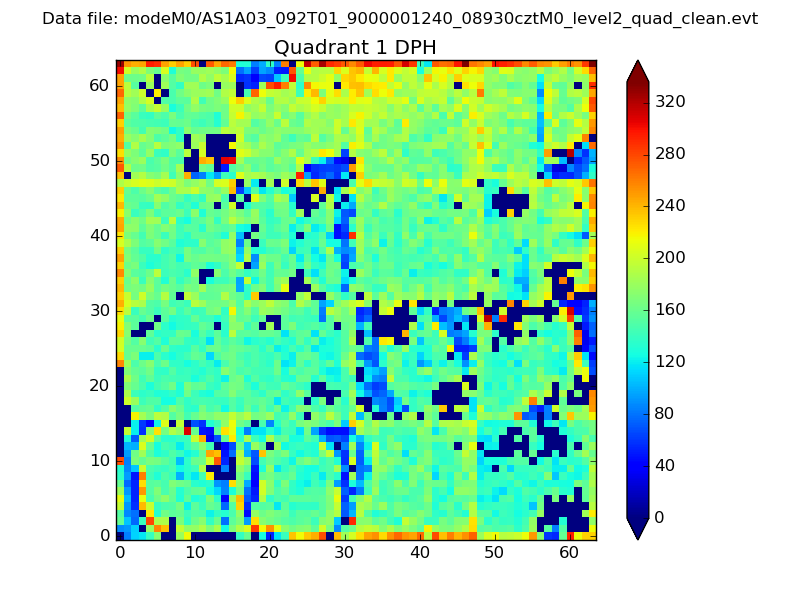 |
Quadrant B |
|---|---|---|---|
| Quadrant D | 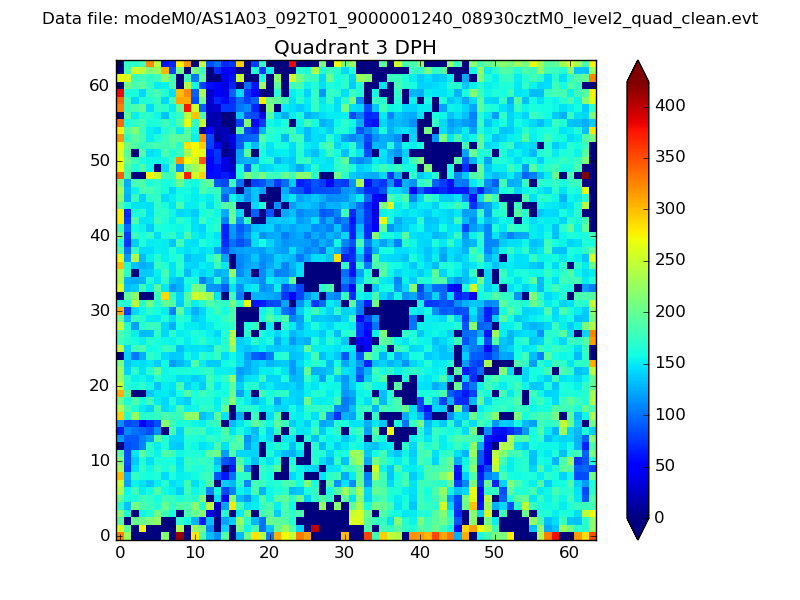 |
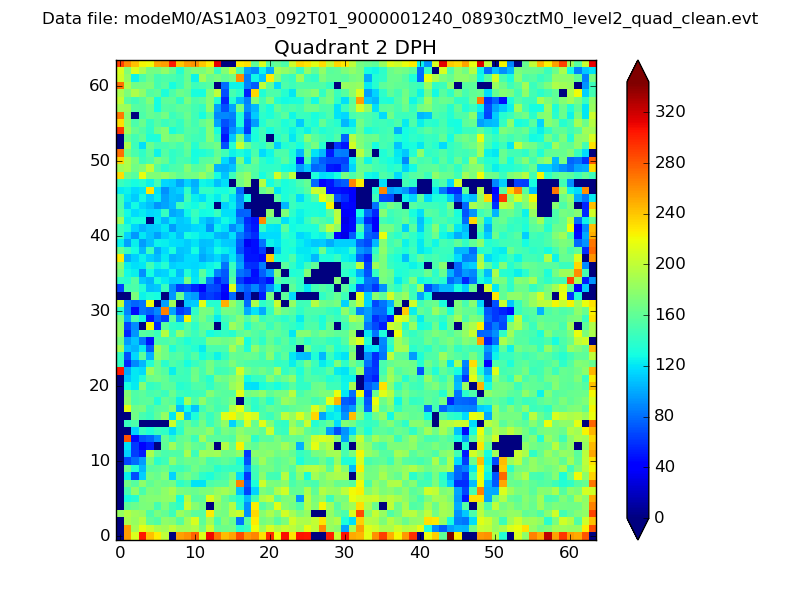 |
Quadrant C |
| Plot type | Count rate plots | Images |
|---|---|---|
| Comparison with Poisson distribution Blue bars denote a histogram of data divided into 1 sec bins. Red curve is a Poisson curve with rate = median count rate of data. |
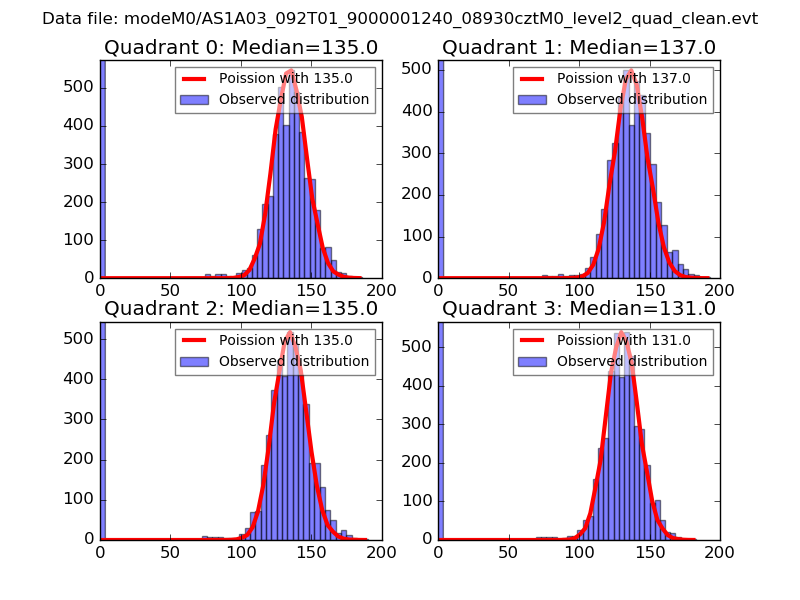 |
 |
| Quadrant-wise count rates Data is divided into 100 sec bins |
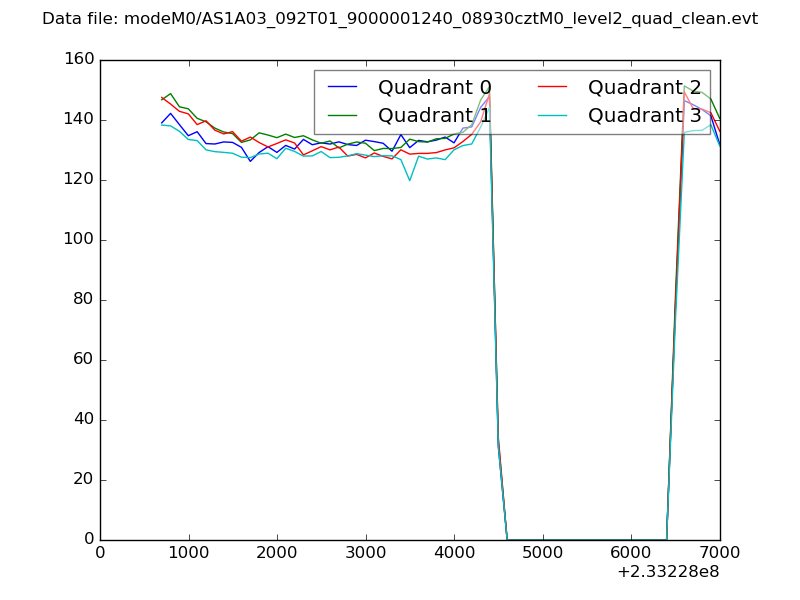 |
|
| Module-wise count rates for Quadrant A Data is divided into 100 sec bins |
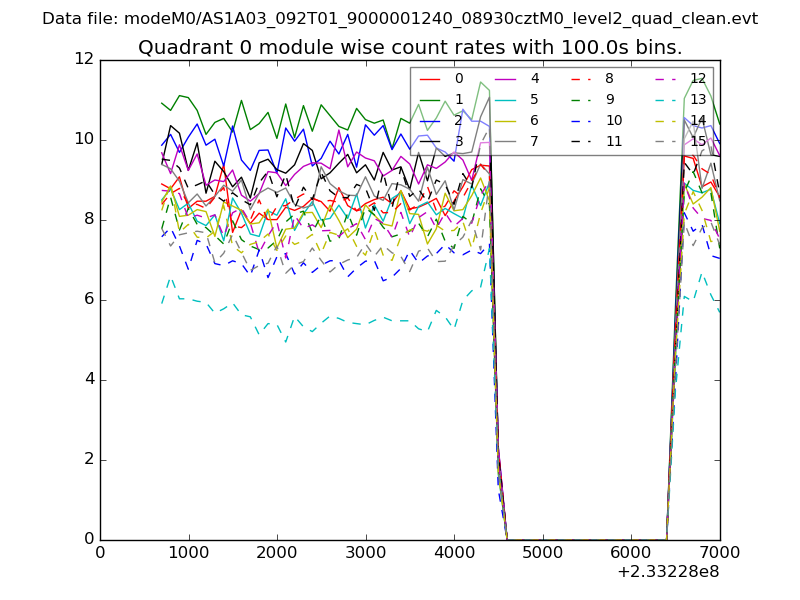 |
 |
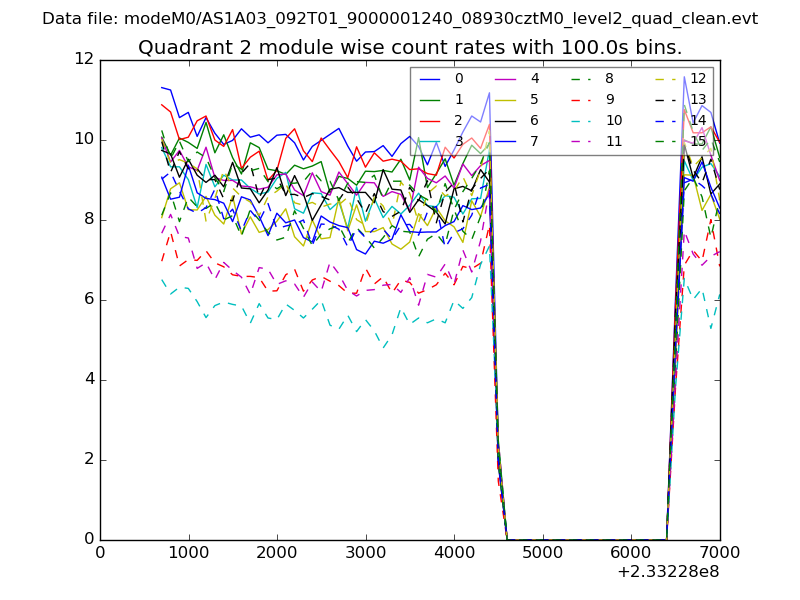
| Module-wise count rates for Quadrant B Data is divided into 100 sec bins |
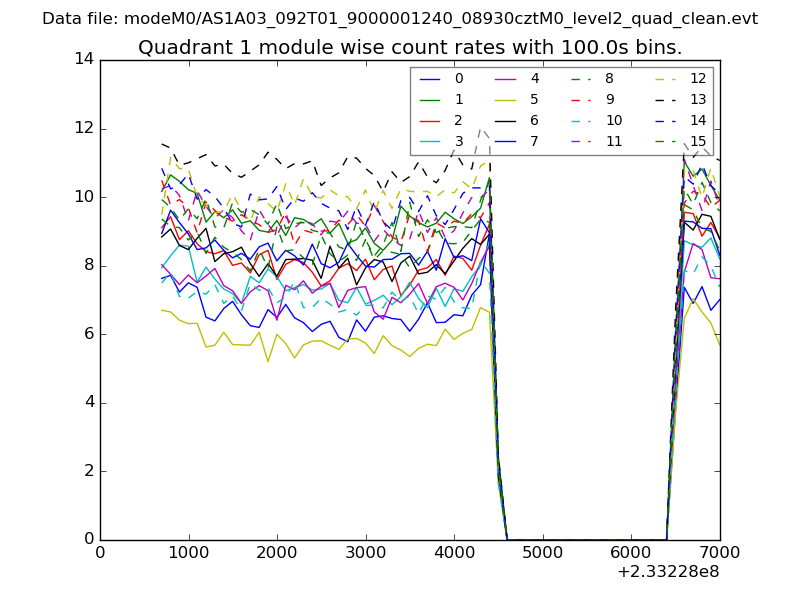 |
 |
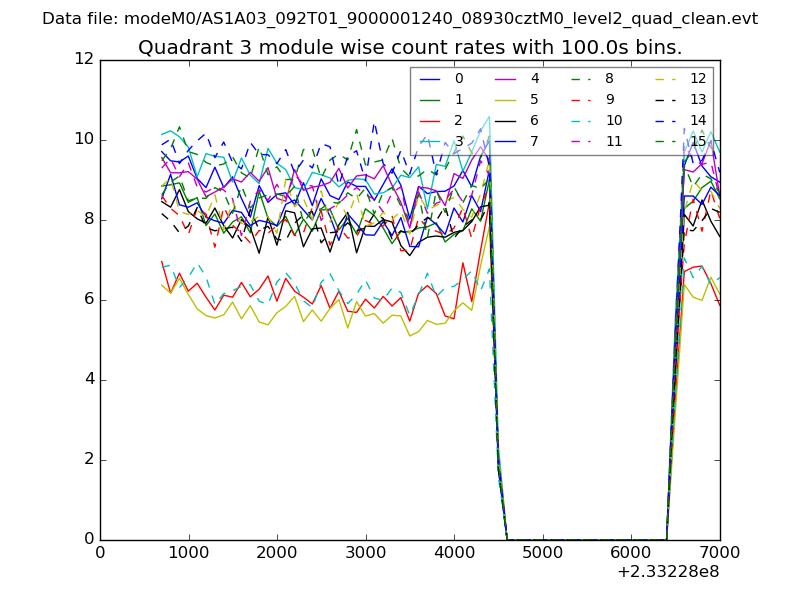
| Module-wise count rates for Quadrant C Data is divided into 100 sec bins |
 |
 |
| Module-wise count rates for Quadrant D Data is divided into 100 sec bins |
 |
 |
| Parameter | Plot |
|---|---|
| CZT HV Monitor | 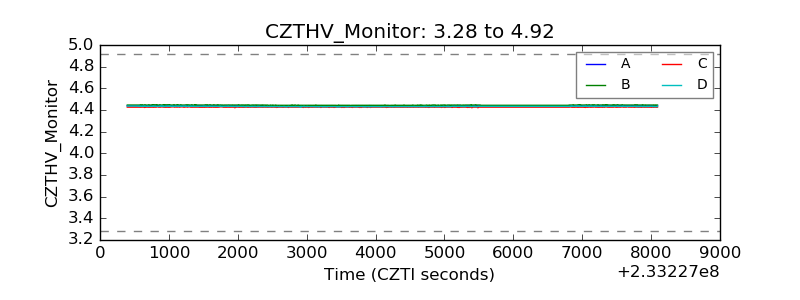 |
| D_VDD |  |
| Temperature 1 | 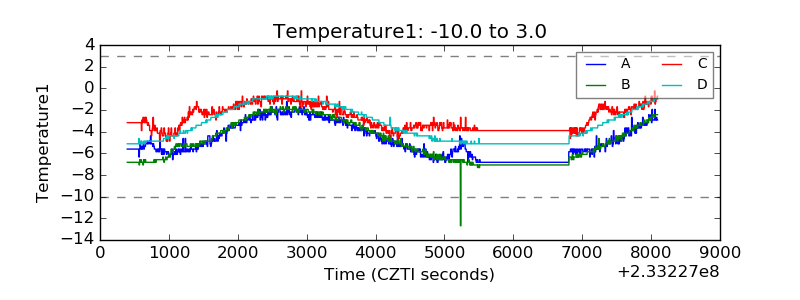 |
| Veto HV Monitor | 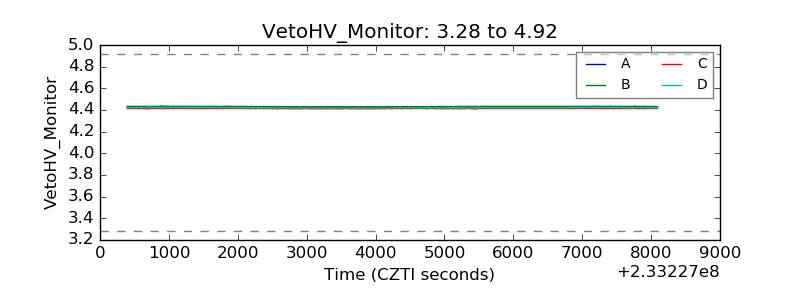 |
| Veto LLD | 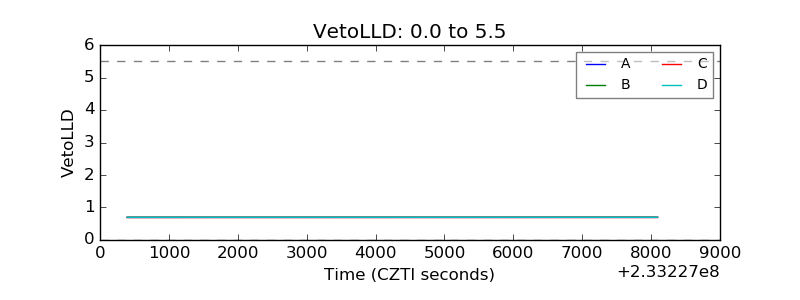 |
| Alpha Counter | 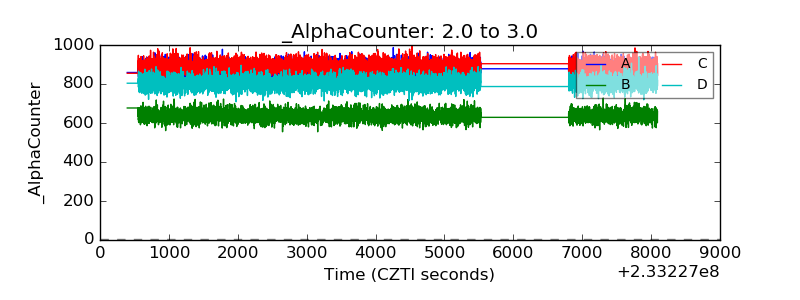 |
| _CPM_Rate | 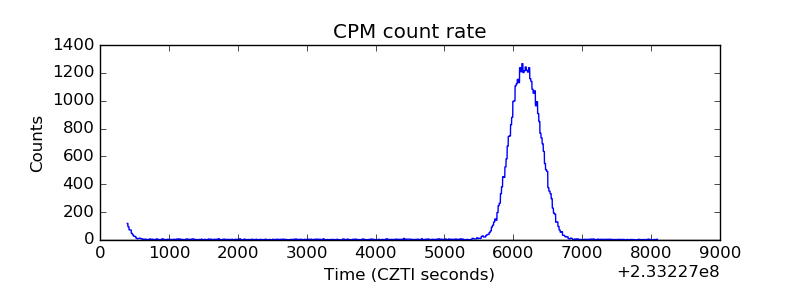 |
| CZT Counter | 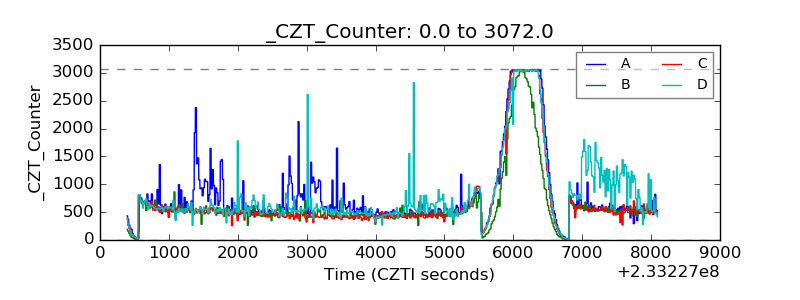 |
| +2.5 Volts monitor |  |
| +5 Volts monitor |  |
| _ROLL_ROT | 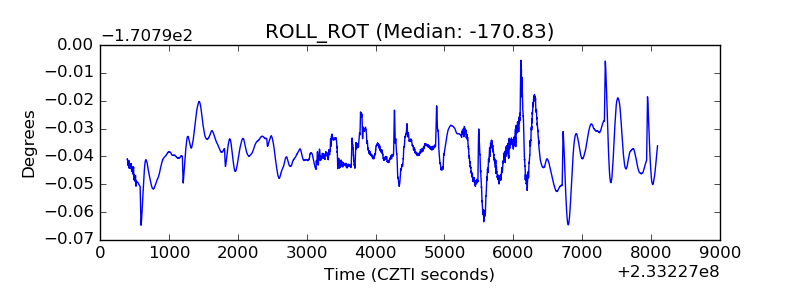 |
| _Roll_DEC | 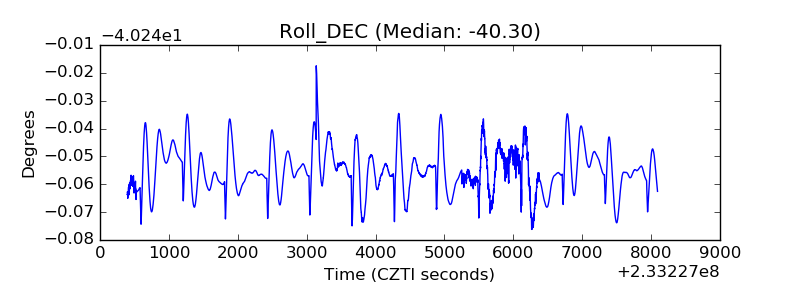 |
| _Roll_RA | 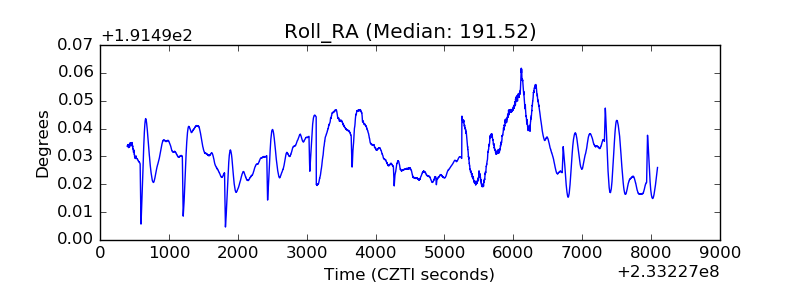 |
| Veto Counter | 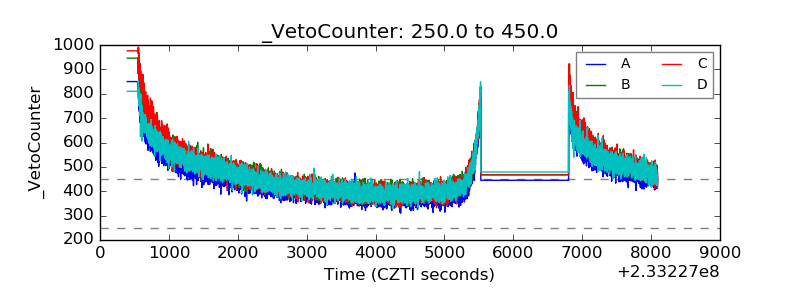 |