| Param | Original file | Final file |
|---|---|---|
| Filename | modeM0/AS1A03_092T01_9000001240_08933cztM0_level2.evt | modeM0/AS1A03_092T01_9000001240_08933cztM0_level2_quad_clean.evt |
| Size (bytes) | 1,234,454,400 | 258,975,360 |
| Size | 1.1 GB | 247.0 MB |
| Events in quadrant A | 10,228,849 | 1,689,604 |
| Events in quadrant B | 8,296,429 | 1,711,105 |
| Events in quadrant C | 7,643,091 | 1,666,222 |
| Events in quadrant D | 10,079,914 | 1,616,963 |
| Mode M9 | |||
|---|---|---|---|
| Quadrant | BADHDUFLAG | Total packets | Discarded packets |
| A | 0 | 32 | 0 |
| B | 0 | 32 | 0 |
| C | 0 | 32 | 0 |
| D | 0 | 32 | 0 |
| Mode SS | |||
|---|---|---|---|
| Quadrant | BADHDUFLAG | Total packets | Discarded packets |
| A | 0 | 340 | 0 |
| B | 0 | 340 | 0 |
| C | 0 | 340 | 0 |
| D | 0 | 340 | 0 |
| Mode M0 | |||
|---|---|---|---|
| Quadrant | BADHDUFLAG | Total packets | Discarded packets |
| A | 0 | 41280 | 4 |
| B | 0 | 35350 | 3 |
| C | 0 | 34619 | 3 |
| D | 0 | 40812 | 5 |
| Quadrant | Total seconds | Saturated seconds | Saturation percentage |
|---|---|---|---|
| A | 16838 | 505 | 2.999169% |
| B | 16838 | 285 | 1.692600% |
| C | 16838 | 170 | 1.009621% |
| D | 16837 | 475 | 2.821168% |
Noise dominated data is calculated using 1-second bins in cleaned event files. If a bin has >2000 counts, and if more than 50% of those come from <1% of pixels, then it is considered to be noise-dominated and hence unusable.
| Quadrant | # 1 sec bins | Bins with >0 counts | Bins with >2000 counts | High rate bins dominated by noise | Noise dominated (total time) | Noise dominated (detector-on time) | Marked lightcurve |
|---|---|---|---|---|---|---|---|
| A | 19878 | 16838 | 82 | 82 | 0.41% | 0.49% | 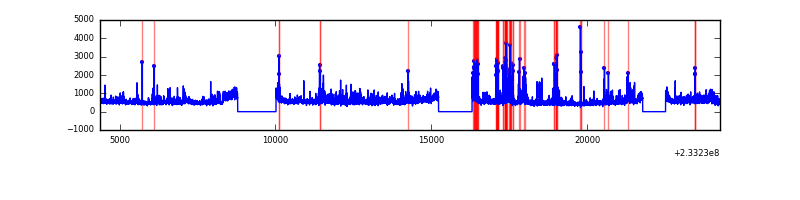 |
| B | 19878 | 16839 | 5 | 5 | 0.03% | 0.03% | 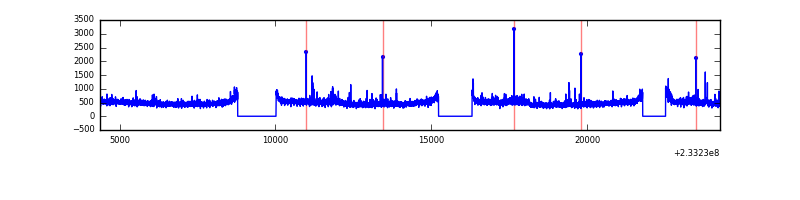 |
| C | 19878 | 16839 | 1 | 1 | 0.01% | 0.01% | 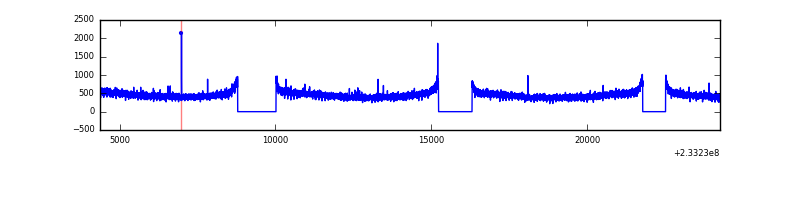 |
| D | 19878 | 16839 | 334 | 334 | 1.68% | 1.98% | 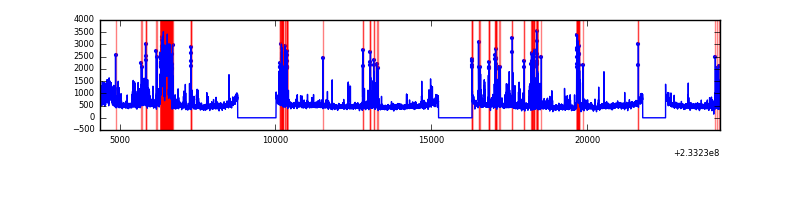 |
Top three noisy pixels from each quadrant. If the there are fewer than three noisy pixels in the level2.evt file, extra rows are filled as -1
| Pixel properties | Quadrant properties | ||||||
|---|---|---|---|---|---|---|---|
| Quadrant | DetID | PixID | Counts | Sigma | Mean | Median | Sigma |
| A | 8 | 5 | 2214300 | 5387.99 | 2036 | 2000 | 410.6 |
| A | 5 | 16 | 125728 | 301.34 | 2036 | 2000 | 410.6 |
| A | 13 | 251 | 37667 | 86.87 | 2036 | 2000 | 410.6 |
| B | 0 | 168 | 109192 | 280.43 | 2039 | 1995 | 382.3 |
| B | 0 | 214 | 77313 | 197.03 | 2039 | 1995 | 382.3 |
| B | 12 | 111 | 39365 | 97.76 | 2039 | 1995 | 382.3 |
| C | 13 | 61 | 14939 | 29.21 | 1954 | 1965 | 444.1 |
| C | 9 | 68 | 6650 | 10.55 | 1954 | 1965 | 444.1 |
| C | 1 | 3 | 6644 | 10.54 | 1954 | 1965 | 444.1 |
| D | 12 | 233 | 846475 | 1626.02 | 1959 | 1912 | 519.4 |
| D | 1 | 52 | 610551 | 1171.8 | 1959 | 1912 | 519.4 |
| D | 8 | 195 | 489005 | 937.79 | 1959 | 1912 | 519.4 |
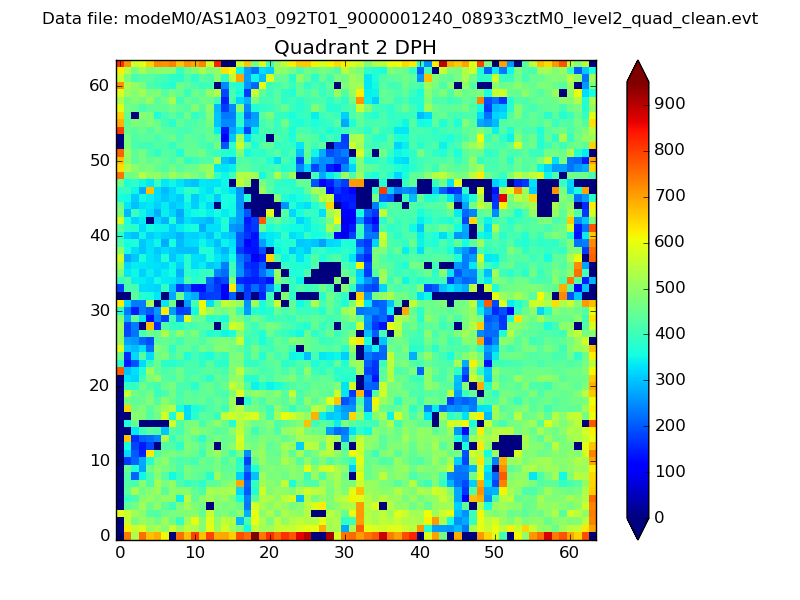
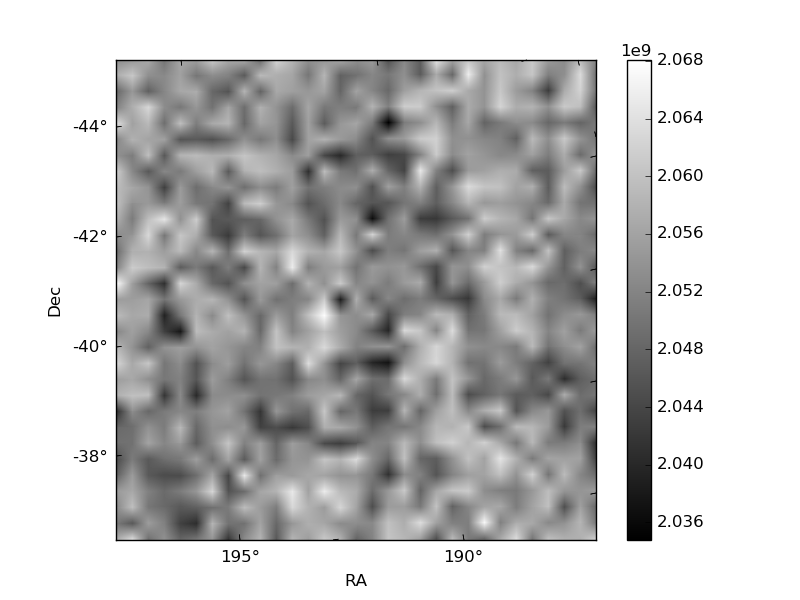
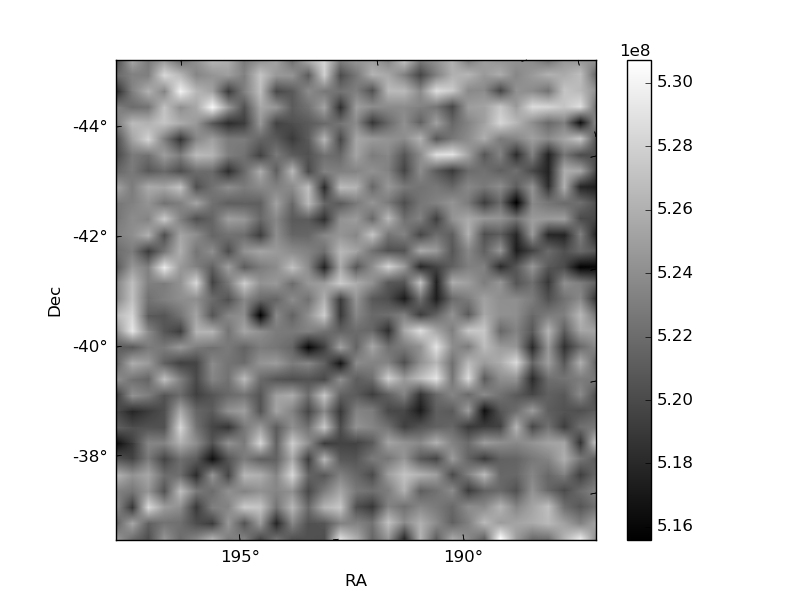
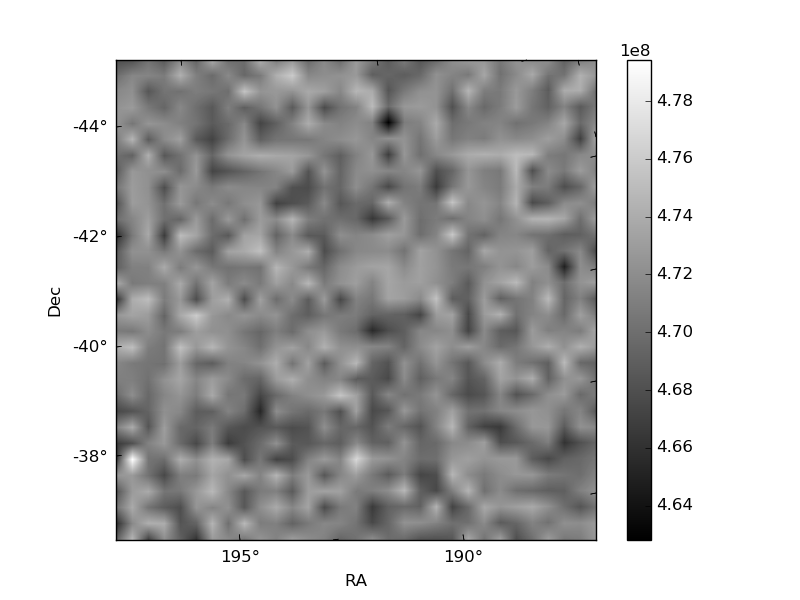
Histogram calculated using DETX and DETY for each event in the final _common_clean file
| Quadrant A | 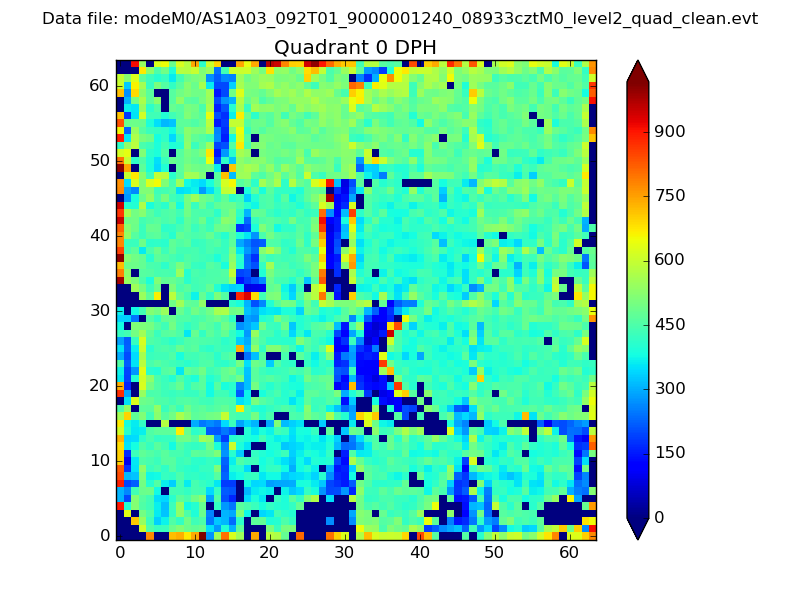 |
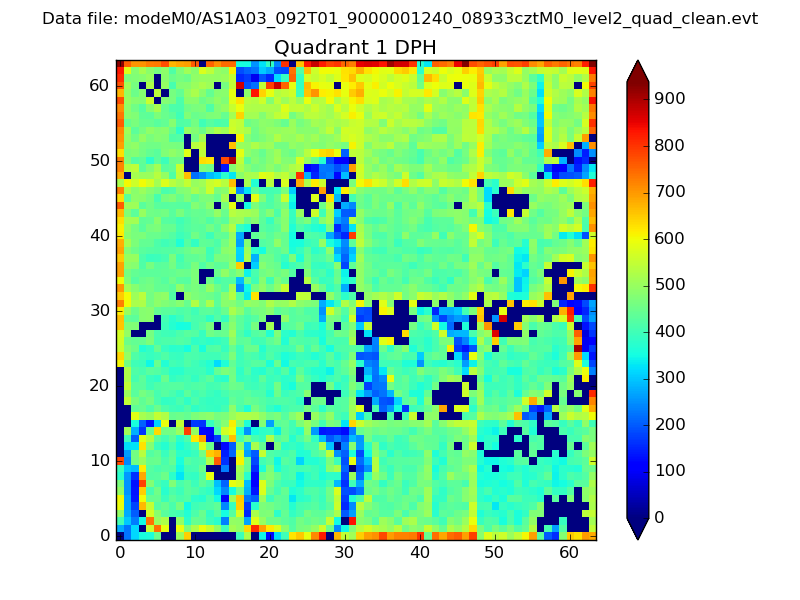 |
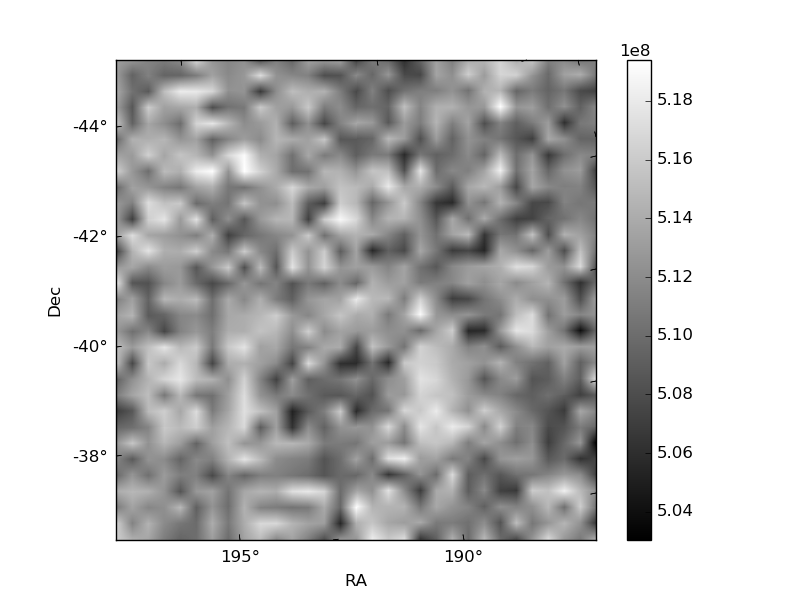
Quadrant B |
|---|---|---|---|
| Quadrant D | 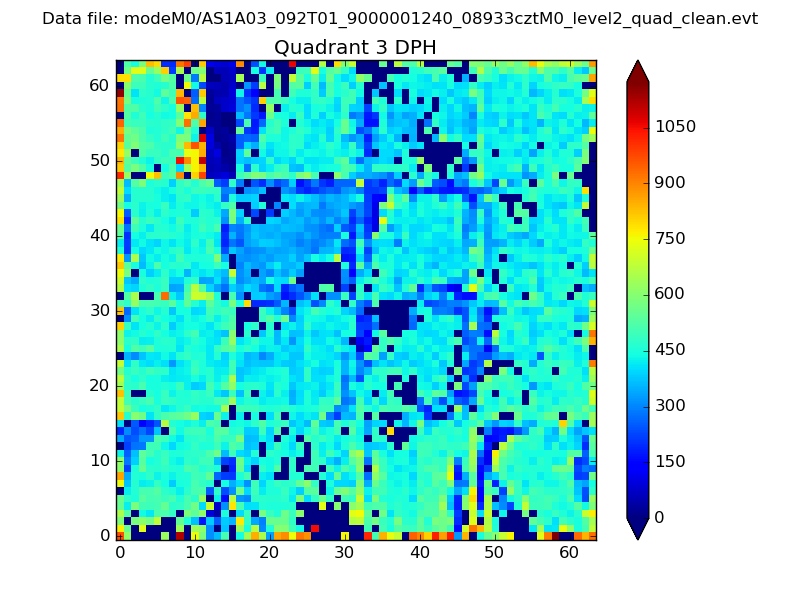 |
 |
Quadrant C |
| Plot type | Count rate plots | Images |
|---|---|---|
| Comparison with Poisson distribution Blue bars denote a histogram of data divided into 1 sec bins. Red curve is a Poisson curve with rate = median count rate of data. |
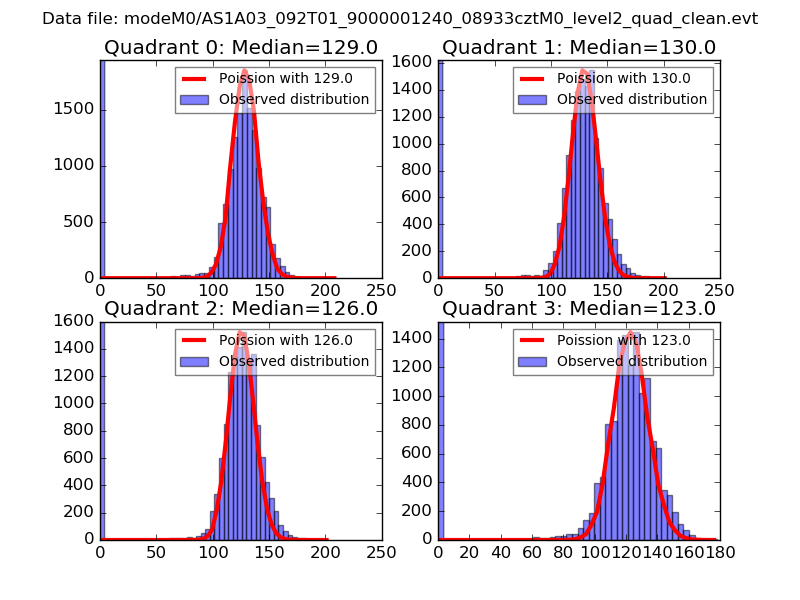 |
 |
| Quadrant-wise count rates Data is divided into 100 sec bins |
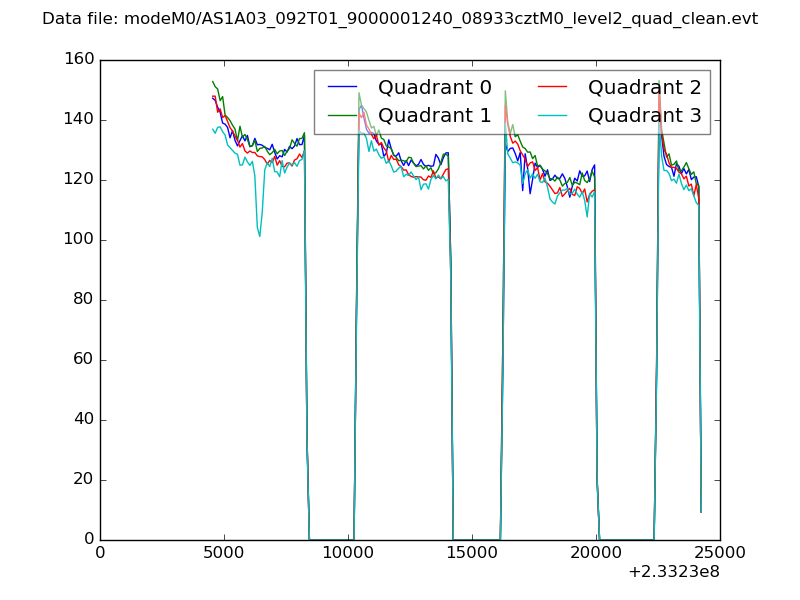 |
|
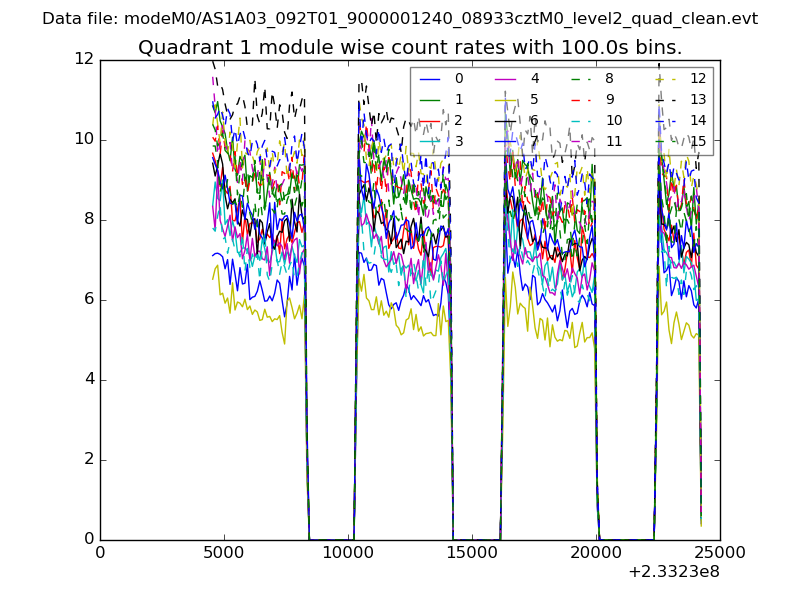
| Module-wise count rates for Quadrant A Data is divided into 100 sec bins |
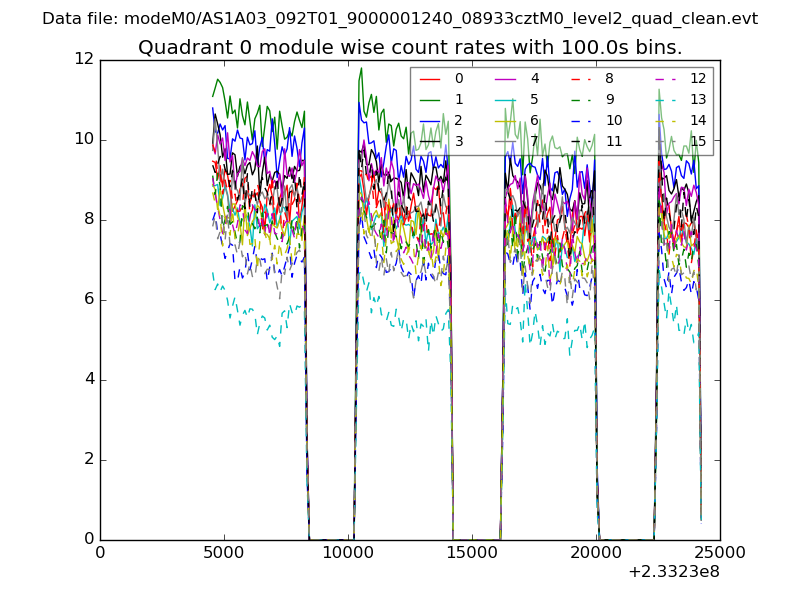 |
 |
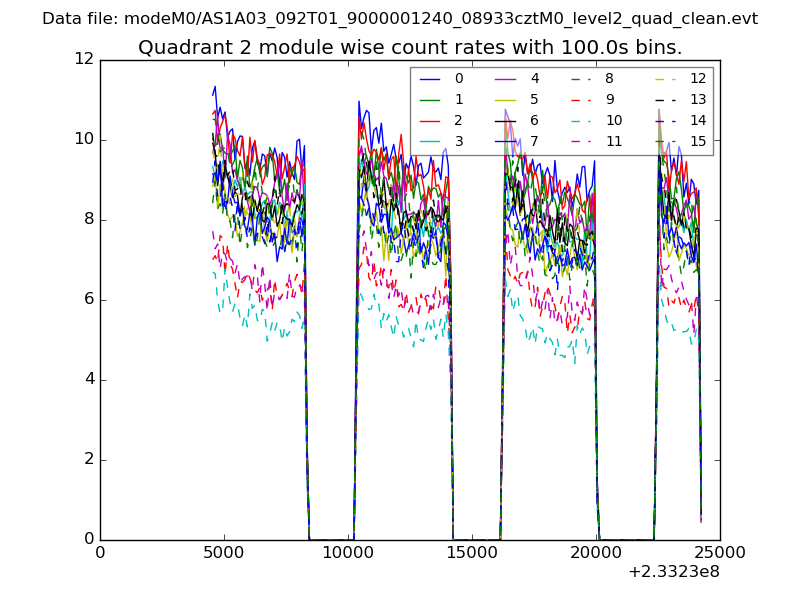
| Module-wise count rates for Quadrant B Data is divided into 100 sec bins |
 |
 |
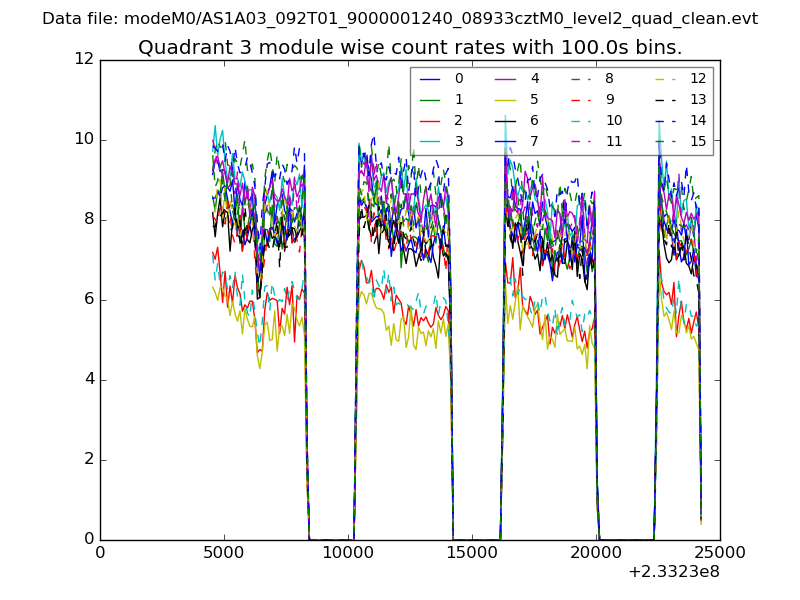
| Module-wise count rates for Quadrant C Data is divided into 100 sec bins |
 |
 |
| Module-wise count rates for Quadrant D Data is divided into 100 sec bins |
 |
 |
| Parameter | Plot |
|---|---|
| CZT HV Monitor | 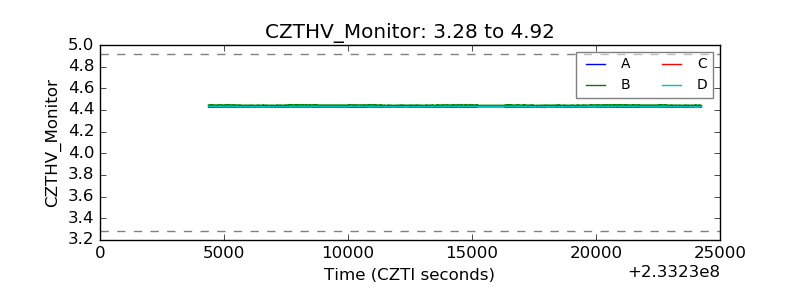 |
| D_VDD |  |
| Temperature 1 | 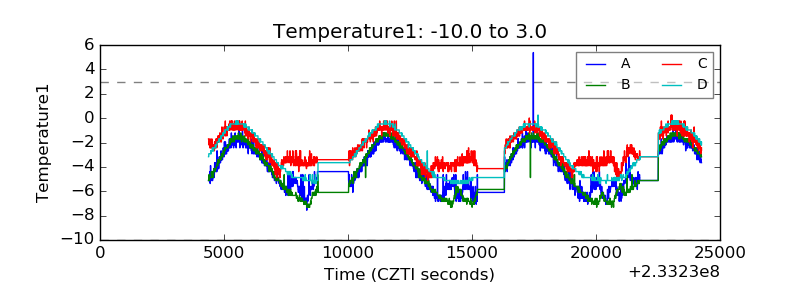 |
| Veto HV Monitor |  |
| Veto LLD | 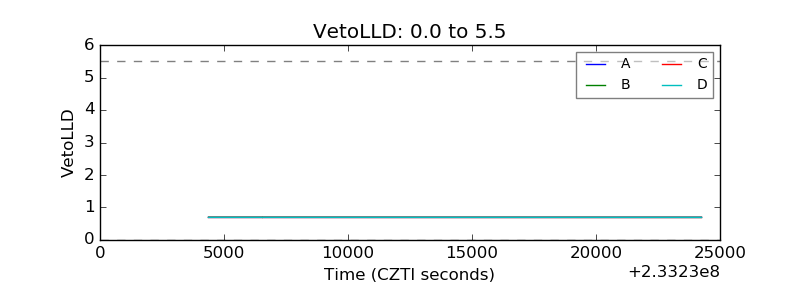 |
| Alpha Counter | 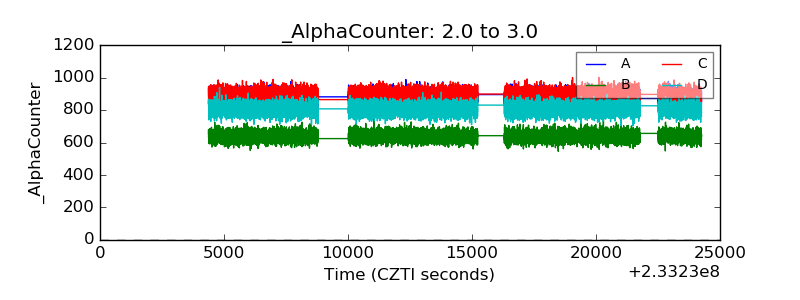 |
| _CPM_Rate | 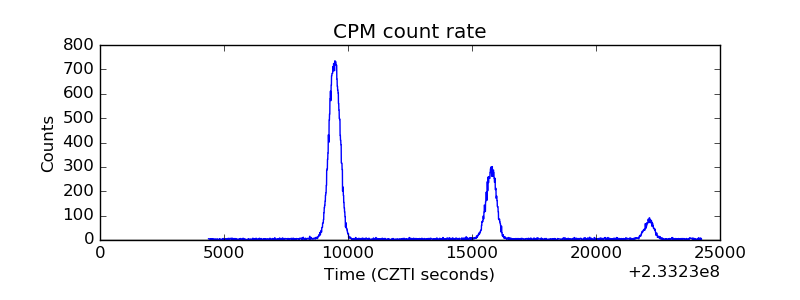 |
| CZT Counter | 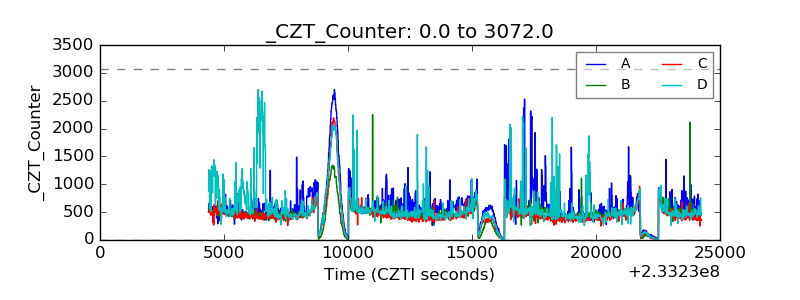 |
| +2.5 Volts monitor |  |
| +5 Volts monitor |  |
| _ROLL_ROT | 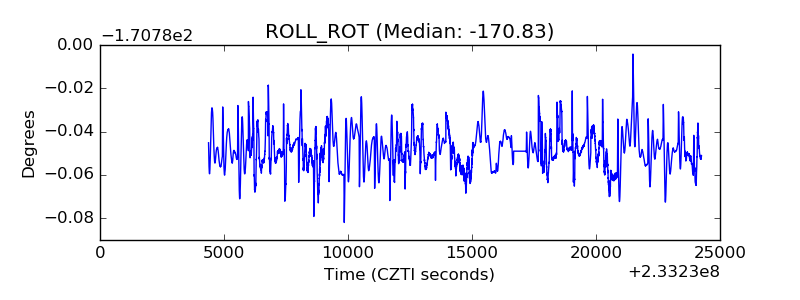 |
| _Roll_DEC | 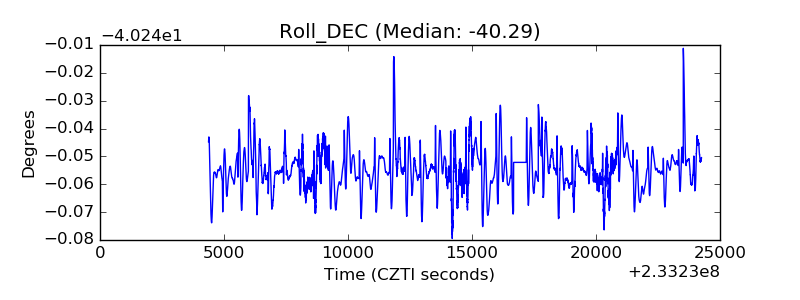 |
| _Roll_RA |  |
| Veto Counter | 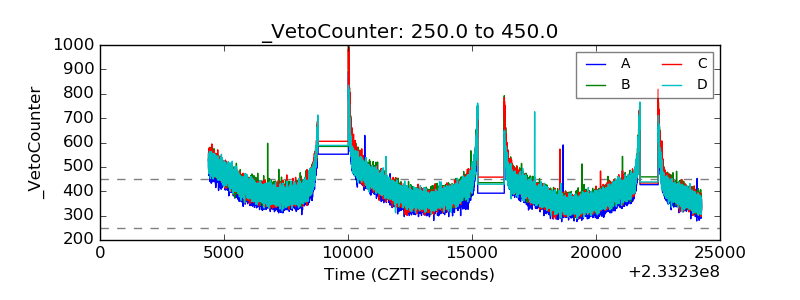 |