| Param | Original file | Final file |
|---|---|---|
| Filename | modeM0/AS1A03_092T01_9000001240_08934cztM0_level2.evt | modeM0/AS1A03_092T01_9000001240_08934cztM0_level2_quad_clean.evt |
| Size (bytes) | 569,646,720 | 104,094,720 |
| Size | 543.3 MB | 99.3 MB |
| Events in quadrant A | 5,710,421 | 647,004 |
| Events in quadrant B | 3,680,135 | 676,451 |
| Events in quadrant C | 3,345,419 | 662,970 |
| Events in quadrant D | 4,006,741 | 643,405 |
| Mode M9 | |||
|---|---|---|---|
| Quadrant | BADHDUFLAG | Total packets | Discarded packets |
| A | 0 | 4 | 0 |
| B | 0 | 4 | 0 |
| C | 0 | 4 | 0 |
| D | 0 | 4 | 0 |
| Mode SS | |||
|---|---|---|---|
| Quadrant | BADHDUFLAG | Total packets | Discarded packets |
| A | 0 | 152 | 0 |
| B | 0 | 152 | 0 |
| C | 0 | 152 | 0 |
| D | 0 | 152 | 0 |
| Mode M0 | |||
|---|---|---|---|
| Quadrant | BADHDUFLAG | Total packets | Discarded packets |
| A | 0 | 22112 | 3 |
| B | 0 | 15883 | 2 |
| C | 0 | 15419 | 2 |
| D | 0 | 17015 | 2 |
| Quadrant | Total seconds | Saturated seconds | Saturation percentage |
|---|---|---|---|
| A | 7508 | 519 | 6.912627% |
| B | 7508 | 68 | 0.905701% |
| C | 7508 | 15 | 0.199787% |
| D | 7508 | 89 | 1.185402% |
Noise dominated data is calculated using 1-second bins in cleaned event files. If a bin has >2000 counts, and if more than 50% of those come from <1% of pixels, then it is considered to be noise-dominated and hence unusable.
| Quadrant | # 1 sec bins | Bins with >0 counts | Bins with >2000 counts | High rate bins dominated by noise | Noise dominated (total time) | Noise dominated (detector-on time) | Marked lightcurve |
|---|---|---|---|---|---|---|---|
| A | 7903 | 7509 | 402 | 402 | 5.09% | 5.35% | 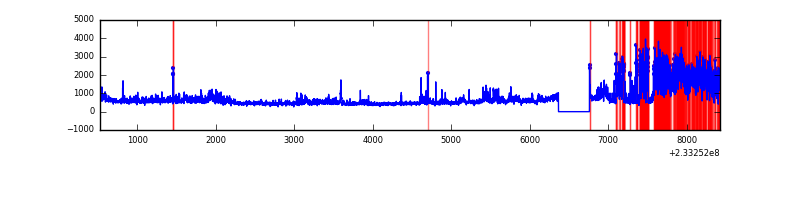 |
| B | 7903 | 7509 | 2 | 2 | 0.03% | 0.03% | 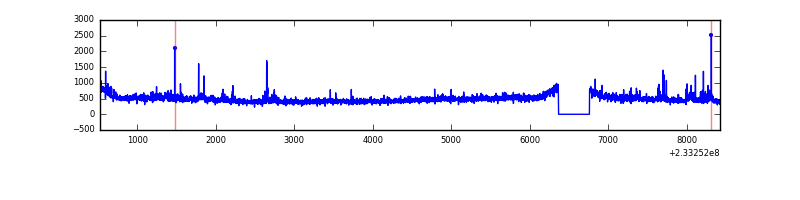 |
| C | 7903 | 7509 | 0 | 0 | 0.00% | 0.00% | 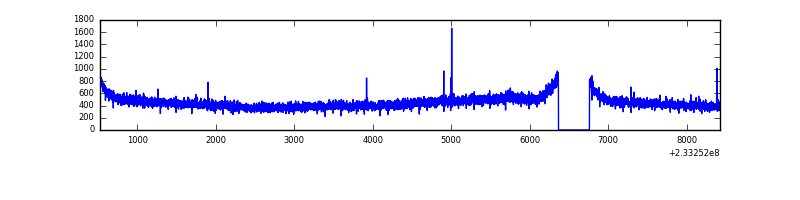 |
| D | 7903 | 7509 | 69 | 69 | 0.87% | 0.92% | 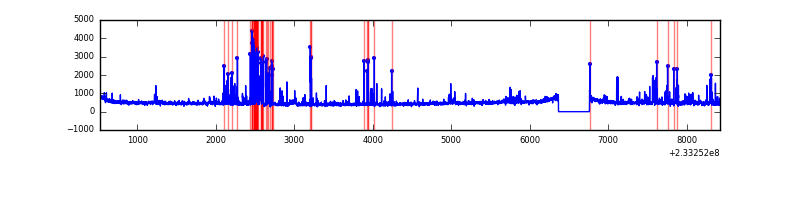 |
Top three noisy pixels from each quadrant. If the there are fewer than three noisy pixels in the level2.evt file, extra rows are filled as -1
| Pixel properties | Quadrant properties | ||||||
|---|---|---|---|---|---|---|---|
| Quadrant | DetID | PixID | Counts | Sigma | Mean | Median | Sigma |
| A | 0 | 128 | 1701041 | 9439.74 | 879 | 861 | 180.1 |
| A | 8 | 5 | 558099 | 3093.9 | 879 | 861 | 180.1 |
| A | 5 | 16 | 43451 | 236.47 | 879 | 861 | 180.1 |
| B | 0 | 214 | 45696 | 260.86 | 894 | 872 | 171.8 |
| B | 10 | 252 | 33495 | 189.85 | 894 | 872 | 171.8 |
| B | 0 | 231 | 24926 | 139.98 | 894 | 872 | 171.8 |
| C | 13 | 61 | 6614 | 29.09 | 855 | 860 | 197.8 |
| C | 14 | 234 | 4982 | 20.84 | 855 | 860 | 197.8 |
| C | 5 | 128 | 3222 | 11.94 | 855 | 860 | 197.8 |
| D | 13 | 104 | 408831 | 1771.75 | 853 | 832 | 230.3 |
| D | 8 | 195 | 122900 | 530.08 | 853 | 832 | 230.3 |
| D | 1 | 52 | 63075 | 270.29 | 853 | 832 | 230.3 |
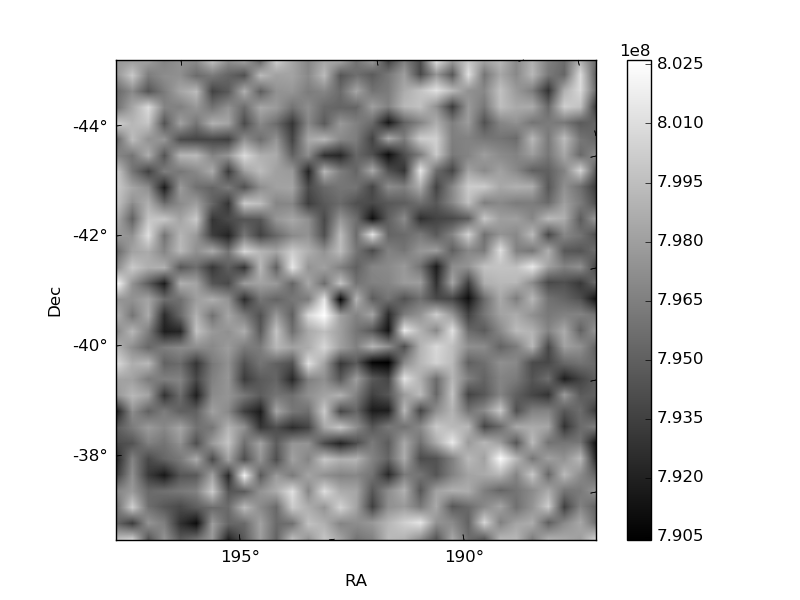
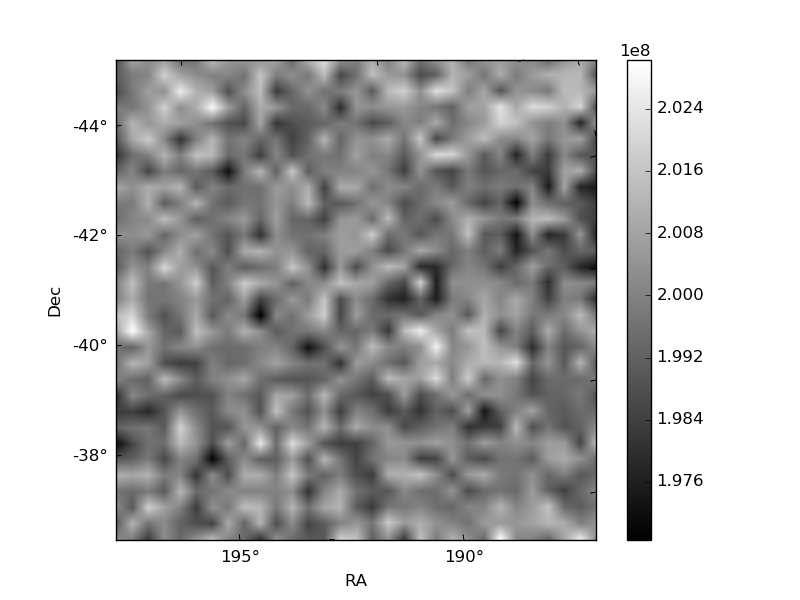
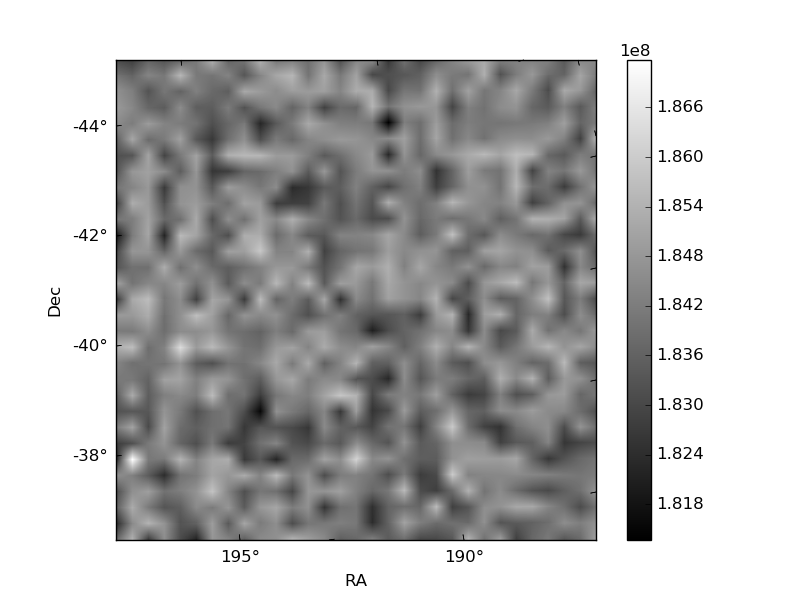
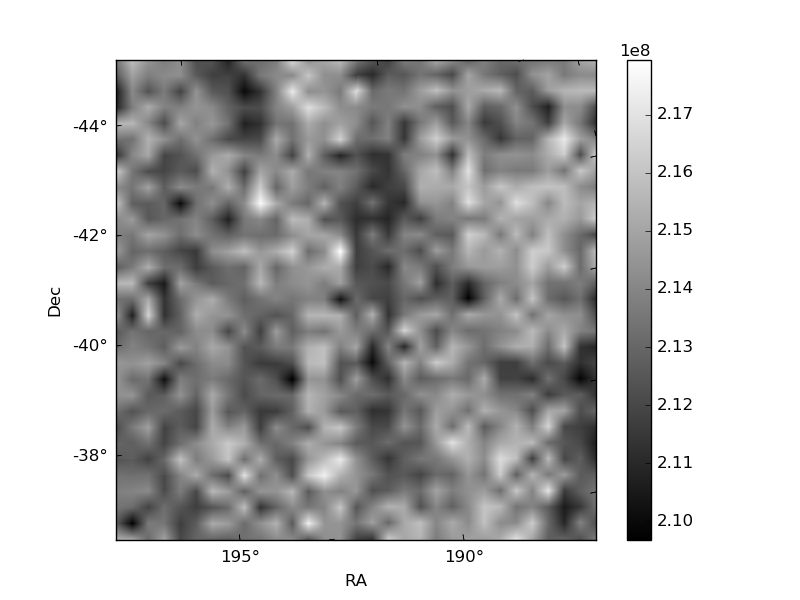
Histogram calculated using DETX and DETY for each event in the final _common_clean file
| Quadrant A | 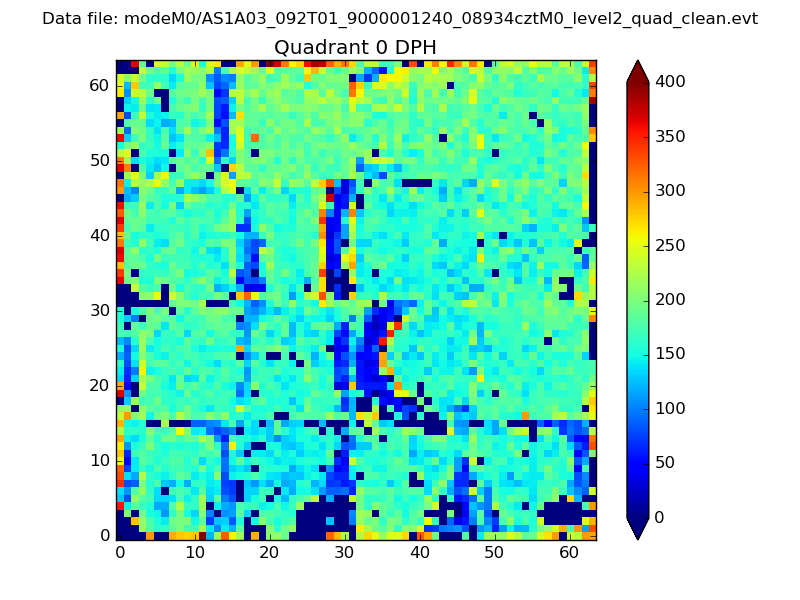 |
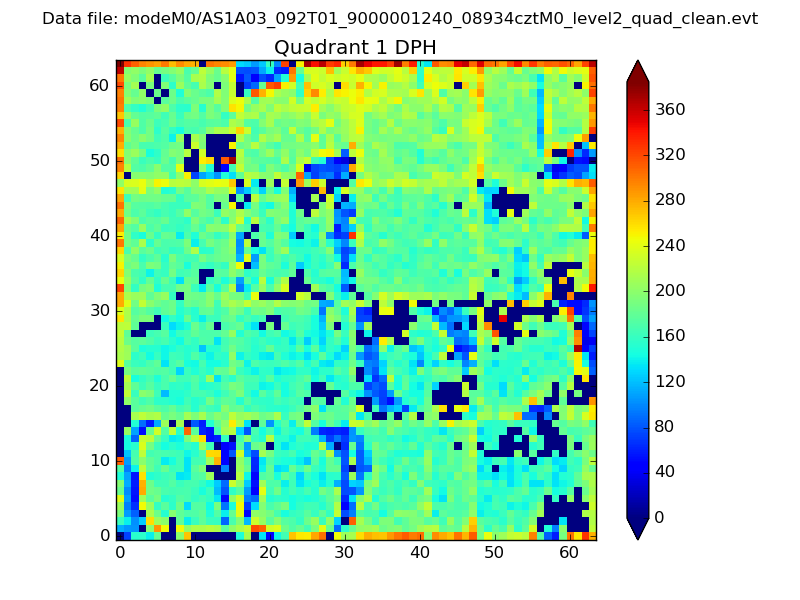 |
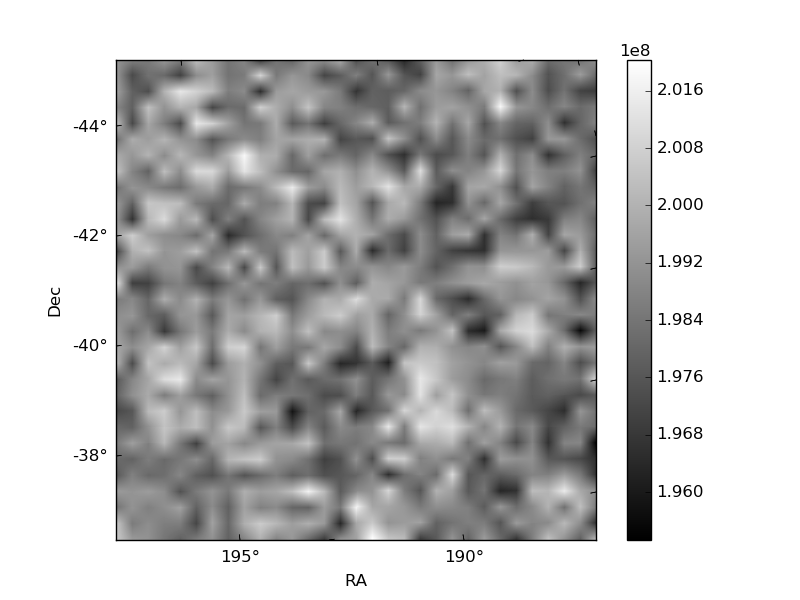
Quadrant B |
|---|---|---|---|
| Quadrant D | 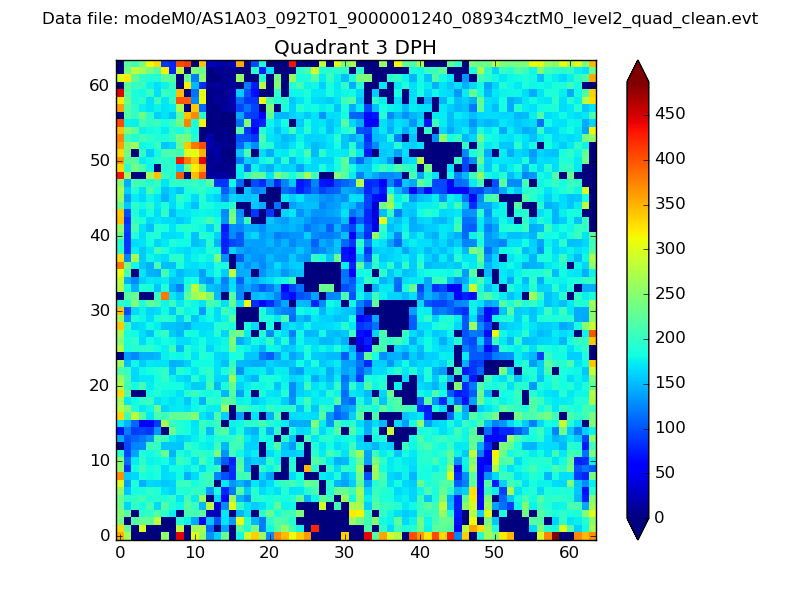 |
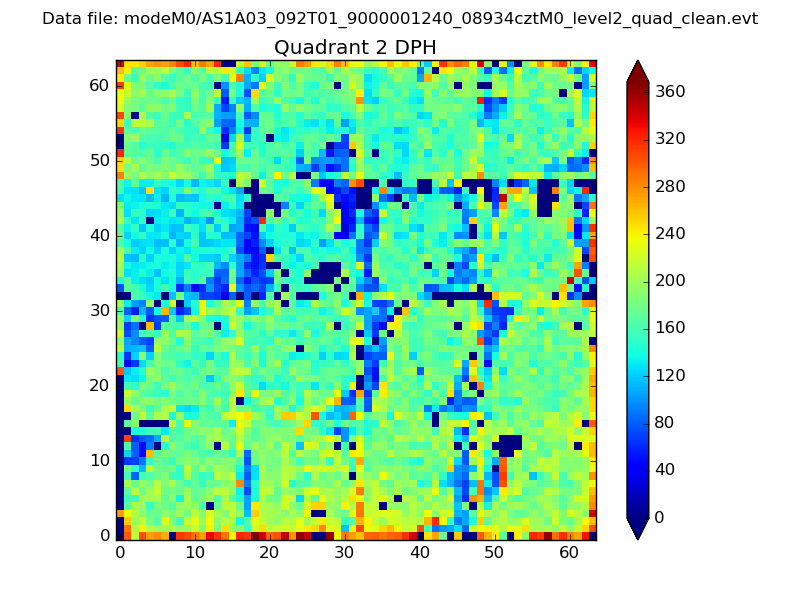 |
Quadrant C |
| Plot type | Count rate plots | Images |
|---|---|---|
| Comparison with Poisson distribution Blue bars denote a histogram of data divided into 1 sec bins. Red curve is a Poisson curve with rate = median count rate of data. |
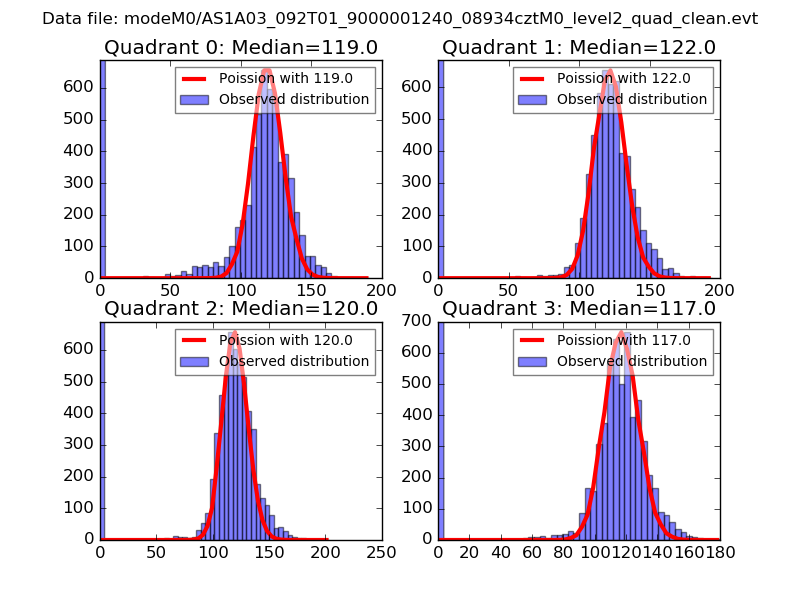 |
 |
| Quadrant-wise count rates Data is divided into 100 sec bins |
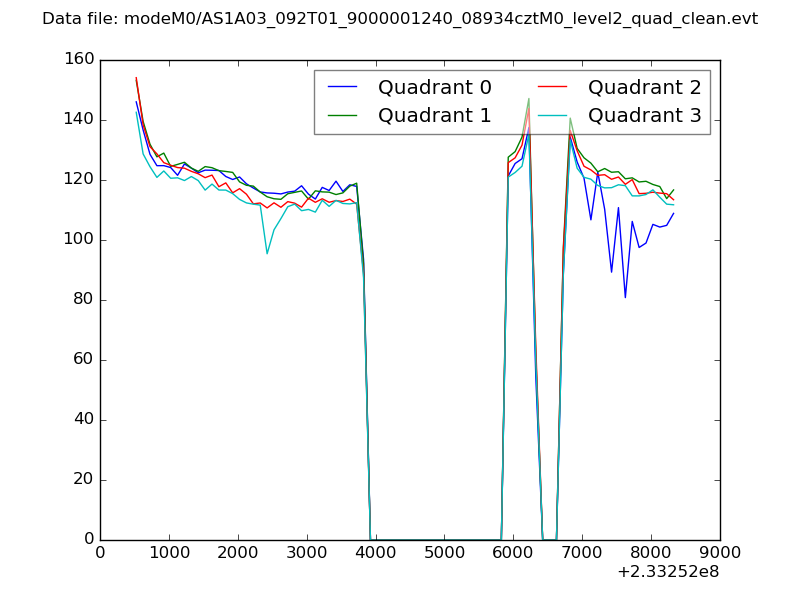 |
|
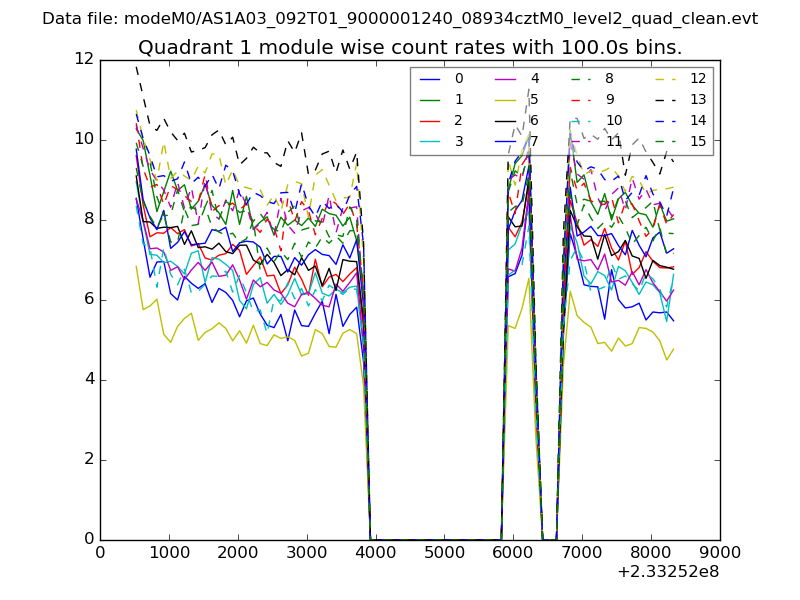
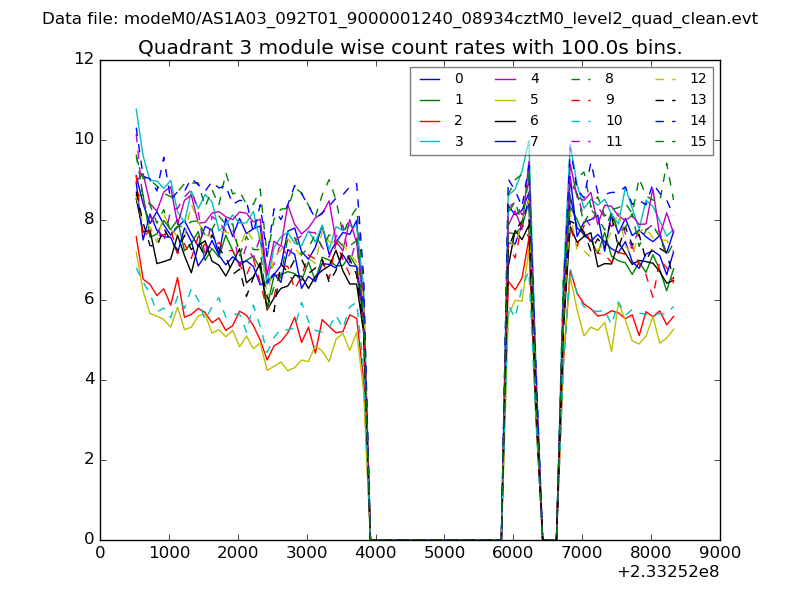
| Module-wise count rates for Quadrant A Data is divided into 100 sec bins |
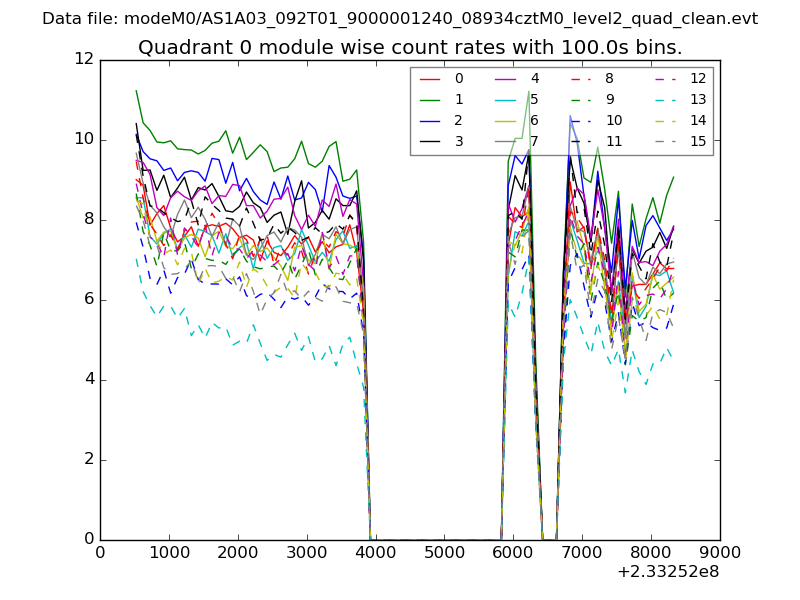 |
 |
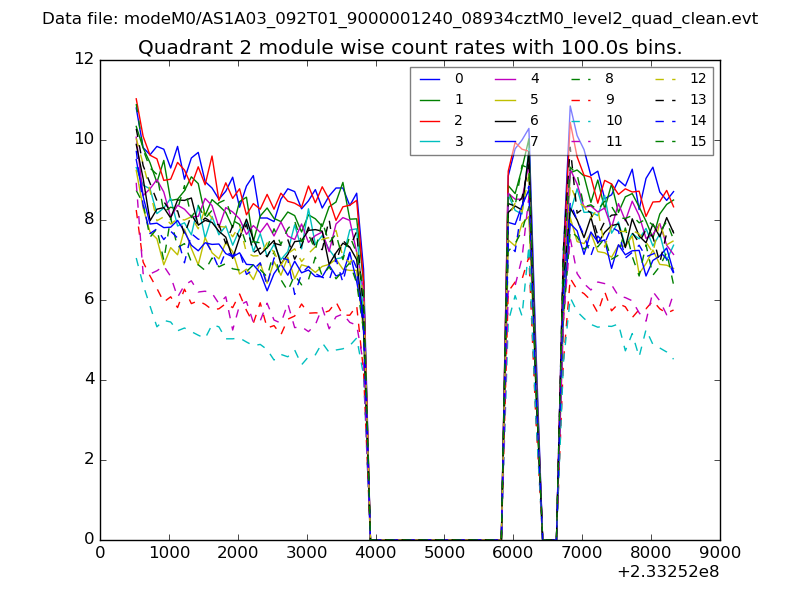
| Module-wise count rates for Quadrant B Data is divided into 100 sec bins |
 |
 |
| Module-wise count rates for Quadrant C Data is divided into 100 sec bins |
 |
 |
| Module-wise count rates for Quadrant D Data is divided into 100 sec bins |
 |
 |
| Parameter | Plot |
|---|---|
| CZT HV Monitor | 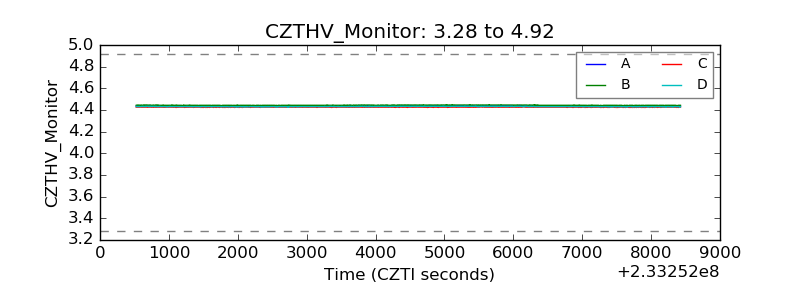 |
| D_VDD | 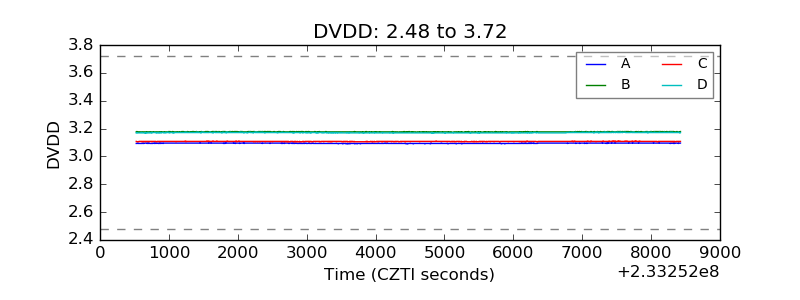 |
| Temperature 1 | 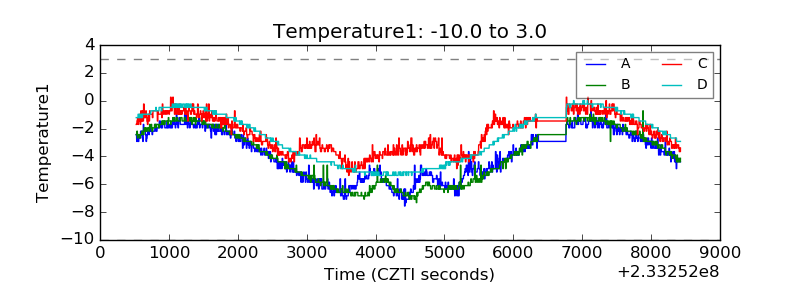 |
| Veto HV Monitor |  |
| Veto LLD | 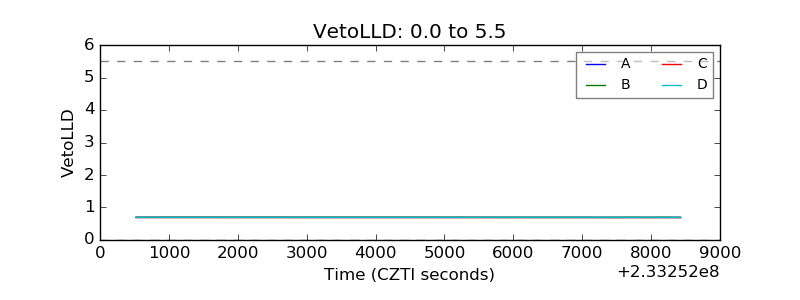 |
| Alpha Counter | 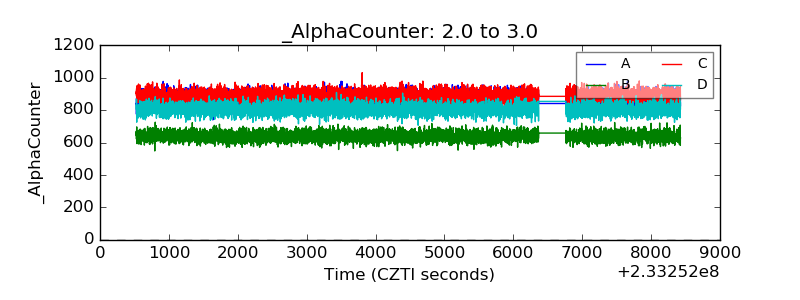 |
| _CPM_Rate | 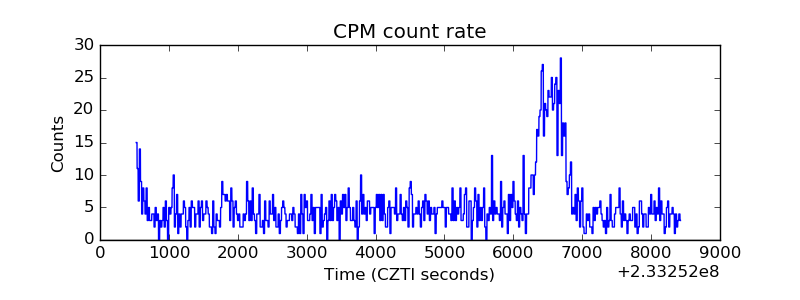 |
| CZT Counter | 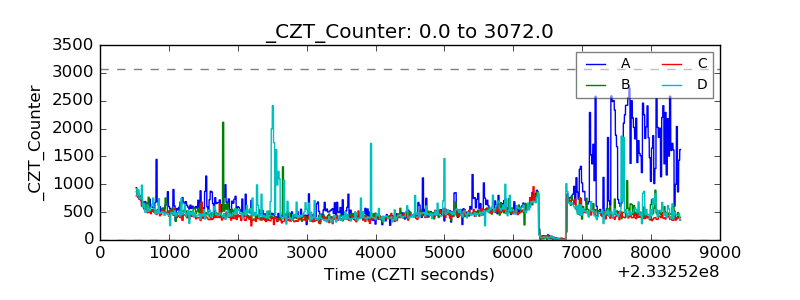 |
| +2.5 Volts monitor |  |
| +5 Volts monitor |  |
| _ROLL_ROT | 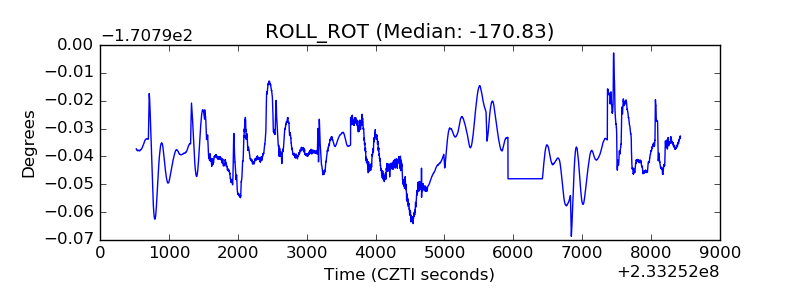 |
| _Roll_DEC |  |
| _Roll_RA | 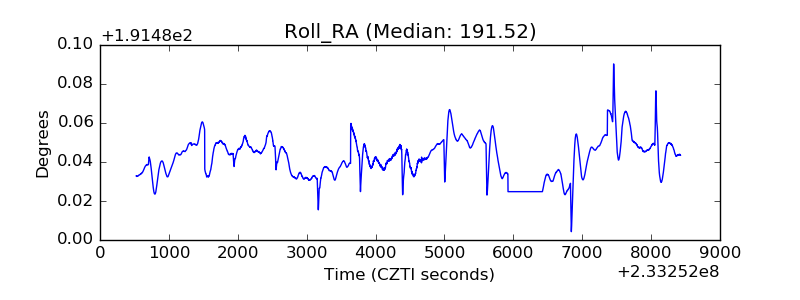 |
| Veto Counter | 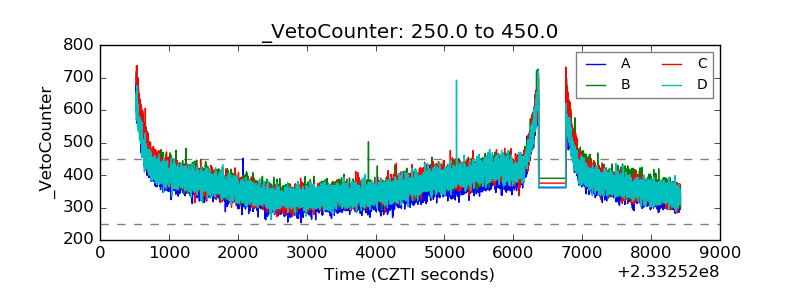 |