| Param | Original file | Final file |
|---|---|---|
| Filename | modeM0/AS1A03_092T01_9000001240_08938cztM0_level2.evt | modeM0/AS1A03_092T01_9000001240_08938cztM0_level2_quad_clean.evt |
| Size (bytes) | 851,198,400 | 159,606,720 |
| Size | 811.8 MB | 152.2 MB |
| Events in quadrant A | 7,150,181 | 1,005,005 |
| Events in quadrant B | 5,815,330 | 1,019,863 |
| Events in quadrant C | 5,420,764 | 994,426 |
| Events in quadrant D | 6,559,007 | 963,703 |
| Mode M9 | |||
|---|---|---|---|
| Quadrant | BADHDUFLAG | Total packets | Discarded packets |
| A | 0 | 16 | 0 |
| B | 0 | 16 | 0 |
| C | 0 | 16 | 0 |
| D | 0 | 16 | 0 |
| Mode SS | |||
|---|---|---|---|
| Quadrant | BADHDUFLAG | Total packets | Discarded packets |
| A | 0 | 254 | 0 |
| B | 0 | 254 | 0 |
| C | 0 | 254 | 0 |
| D | 0 | 254 | 0 |
| Mode M0 | |||
|---|---|---|---|
| Quadrant | BADHDUFLAG | Total packets | Discarded packets |
| A | 0 | 29379 | 4 |
| B | 0 | 25482 | 3 |
| C | 0 | 24999 | 3 |
| D | 0 | 28278 | 3 |
| Quadrant | Total seconds | Saturated seconds | Saturation percentage |
|---|---|---|---|
| A | 12302 | 127 | 1.032352% |
| B | 12302 | 57 | 0.463339% |
| C | 12302 | 24 | 0.195090% |
| D | 12302 | 274 | 2.227280% |
Noise dominated data is calculated using 1-second bins in cleaned event files. If a bin has >2000 counts, and if more than 50% of those come from <1% of pixels, then it is considered to be noise-dominated and hence unusable.
| Quadrant | # 1 sec bins | Bins with >0 counts | Bins with >2000 counts | High rate bins dominated by noise | Noise dominated (total time) | Noise dominated (detector-on time) | Marked lightcurve |
|---|---|---|---|---|---|---|---|
| A | 13962 | 12305 | 43 | 43 | 0.31% | 0.35% |  |
| B | 13962 | 12305 | 5 | 5 | 0.04% | 0.04% |  |
| C | 13962 | 12305 | 4 | 4 | 0.03% | 0.03% | 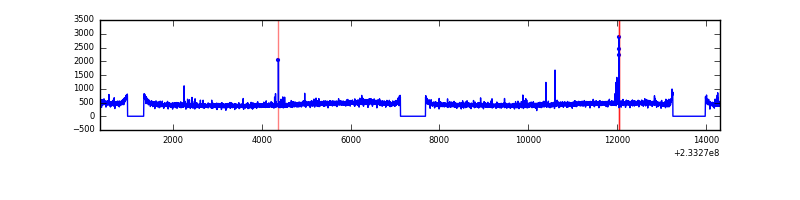 |
| D | 13962 | 12305 | 246 | 246 | 1.76% | 2.00% | 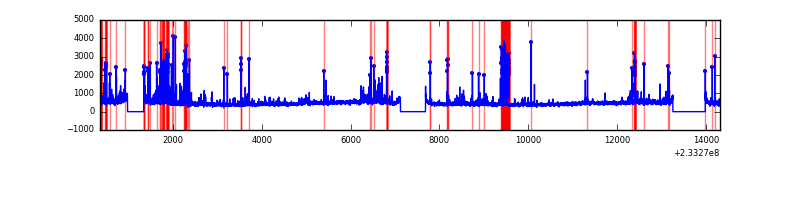 |
Top three noisy pixels from each quadrant. If the there are fewer than three noisy pixels in the level2.evt file, extra rows are filled as -1
| Pixel properties | Quadrant properties | ||||||
|---|---|---|---|---|---|---|---|
| Quadrant | DetID | PixID | Counts | Sigma | Mean | Median | Sigma |
| A | 8 | 5 | 1506552 | 5182.81 | 1425 | 1394 | 290.4 |
| A | 5 | 16 | 136627 | 465.66 | 1425 | 1394 | 290.4 |
| A | 0 | 226 | 13203 | 40.66 | 1425 | 1394 | 290.4 |
| B | 0 | 214 | 37686 | 132.78 | 1435 | 1401 | 273.3 |
| B | 0 | 219 | 37541 | 132.25 | 1435 | 1401 | 273.3 |
| B | 6 | 51 | 37514 | 132.15 | 1435 | 1401 | 273.3 |
| C | 14 | 234 | 31186 | 93.78 | 1373 | 1381 | 317.8 |
| C | 1 | 3 | 16227 | 46.71 | 1373 | 1381 | 317.8 |
| C | 8 | 128 | 12817 | 35.98 | 1373 | 1381 | 317.8 |
| D | 1 | 52 | 494153 | 1345.42 | 1360 | 1331 | 366.3 |
| D | 12 | 233 | 399669 | 1087.48 | 1360 | 1331 | 366.3 |
| D | 7 | 71 | 152837 | 413.62 | 1360 | 1331 | 366.3 |
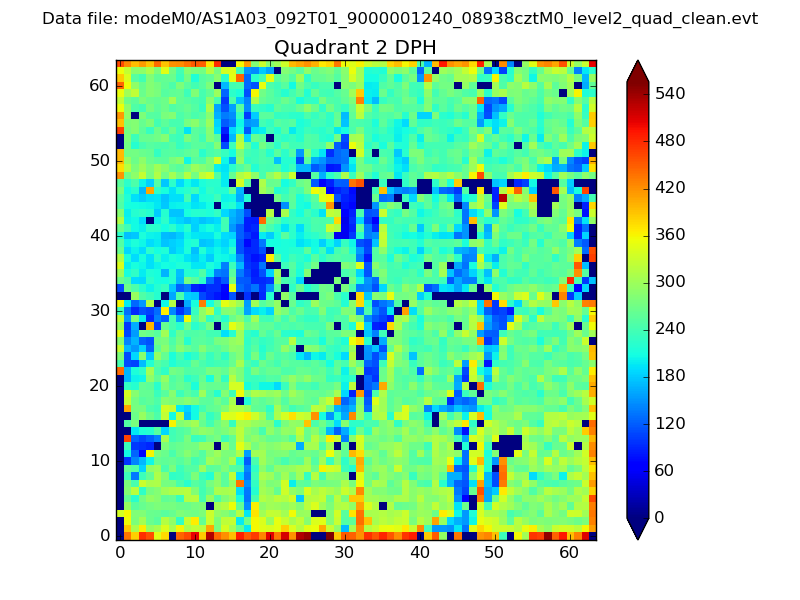
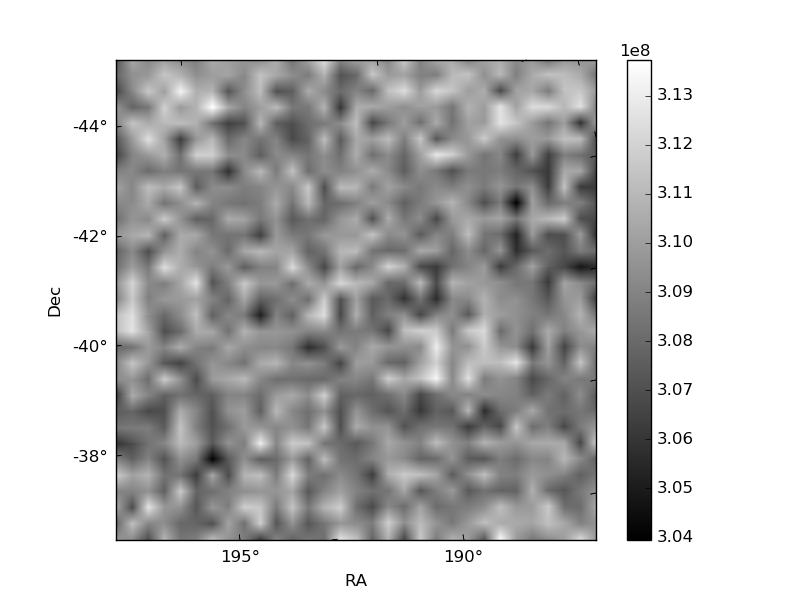
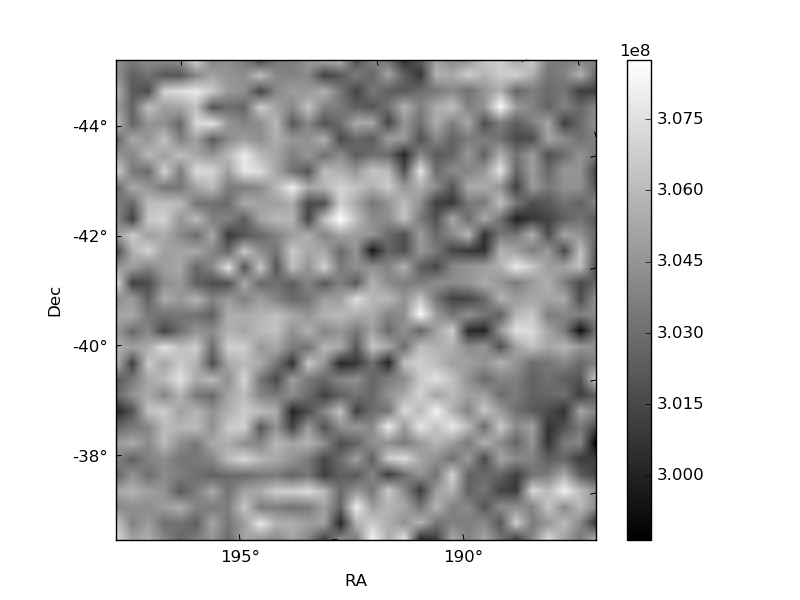
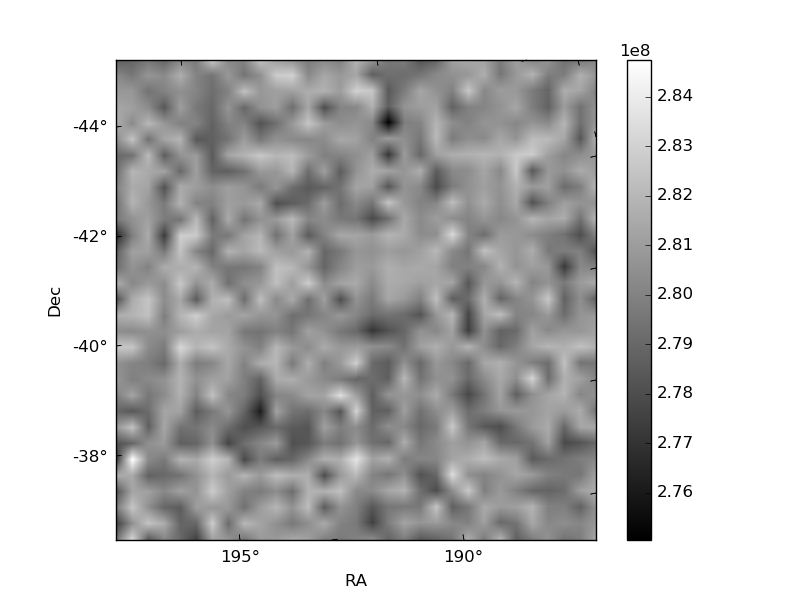
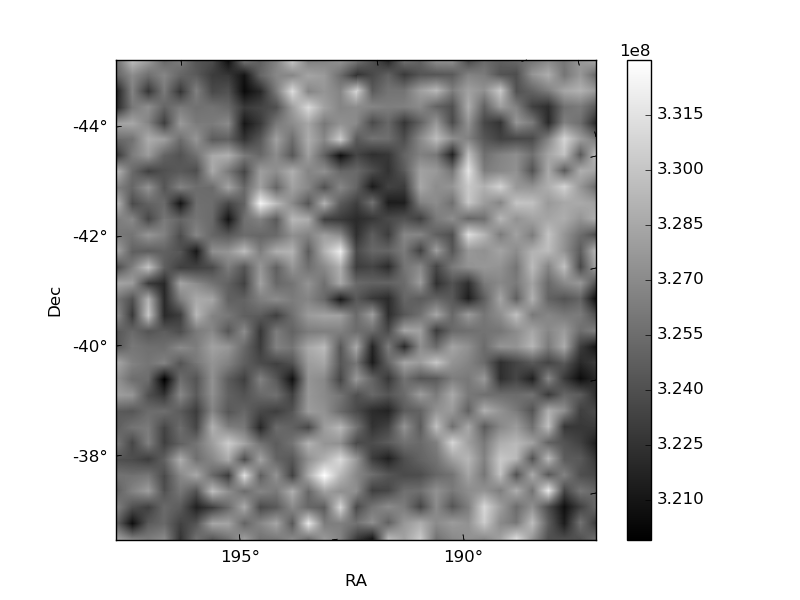
Histogram calculated using DETX and DETY for each event in the final _common_clean file
| Quadrant A | 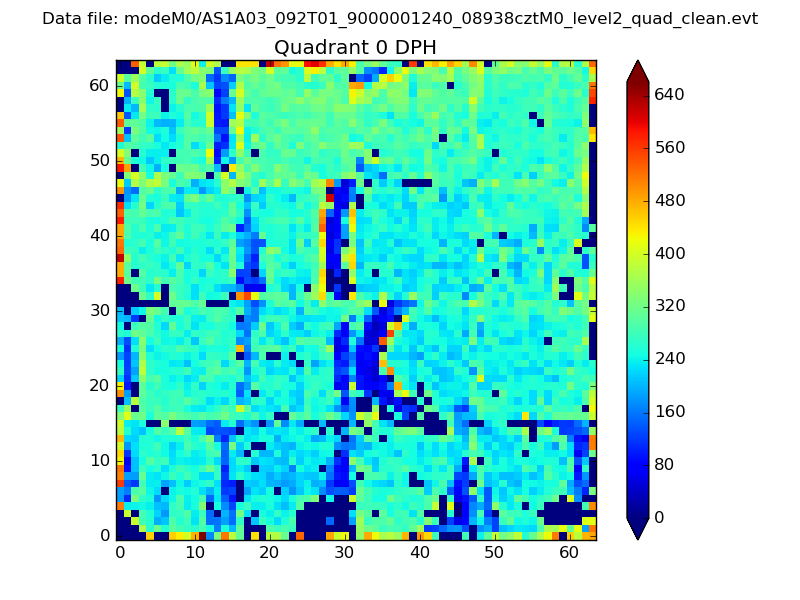 |
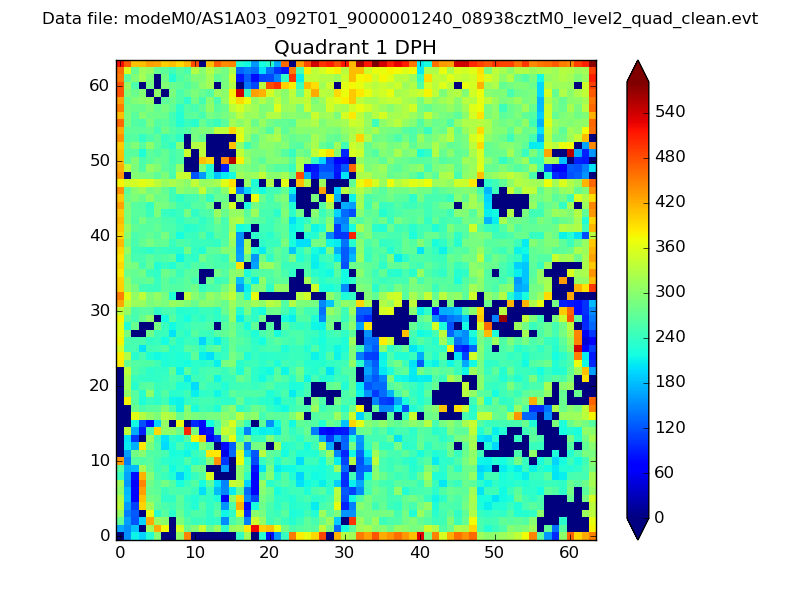 |
Quadrant B |
|---|---|---|---|
| Quadrant D | 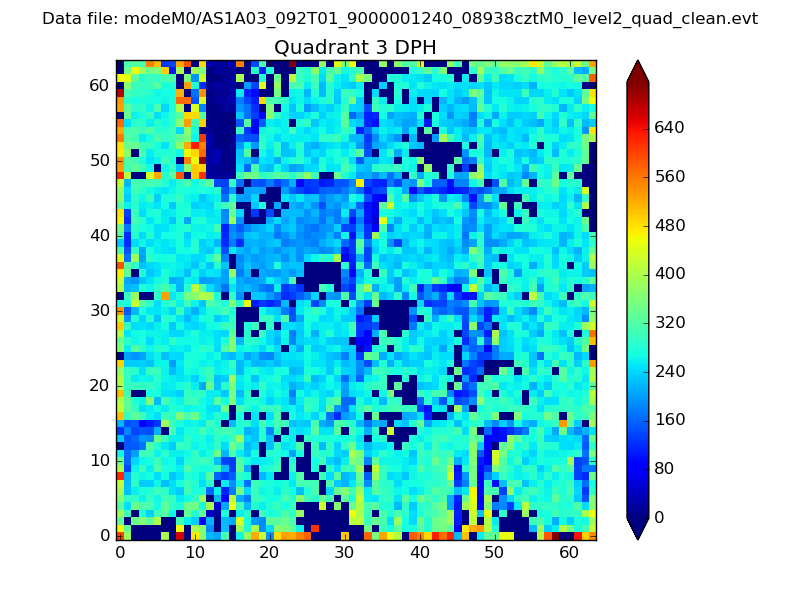 |
 |
Quadrant C |
| Plot type | Count rate plots | Images |
|---|---|---|
| Comparison with Poisson distribution Blue bars denote a histogram of data divided into 1 sec bins. Red curve is a Poisson curve with rate = median count rate of data. |
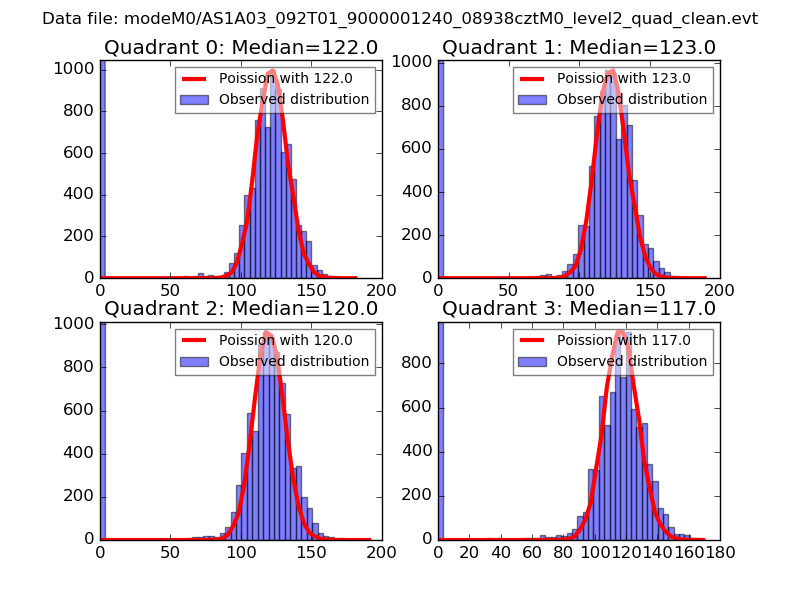 |
 |
| Quadrant-wise count rates Data is divided into 100 sec bins |
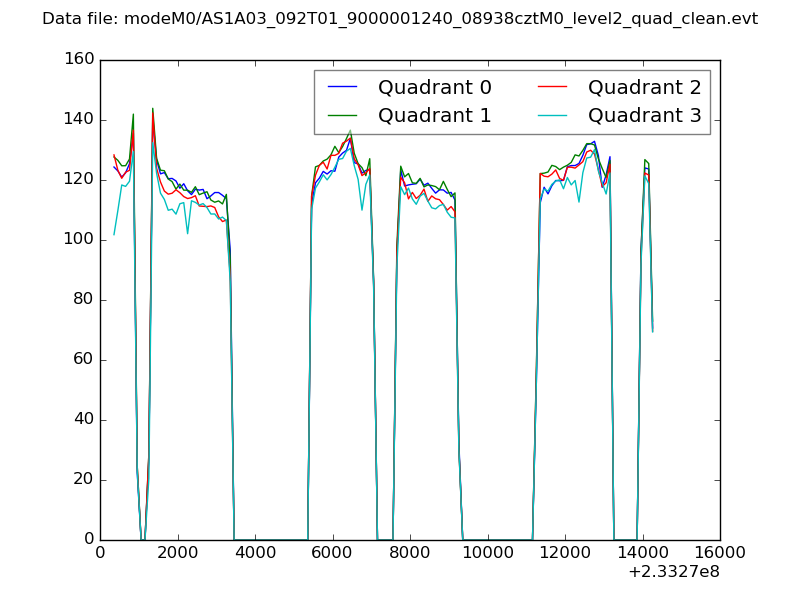 |
|
| Module-wise count rates for Quadrant A Data is divided into 100 sec bins |
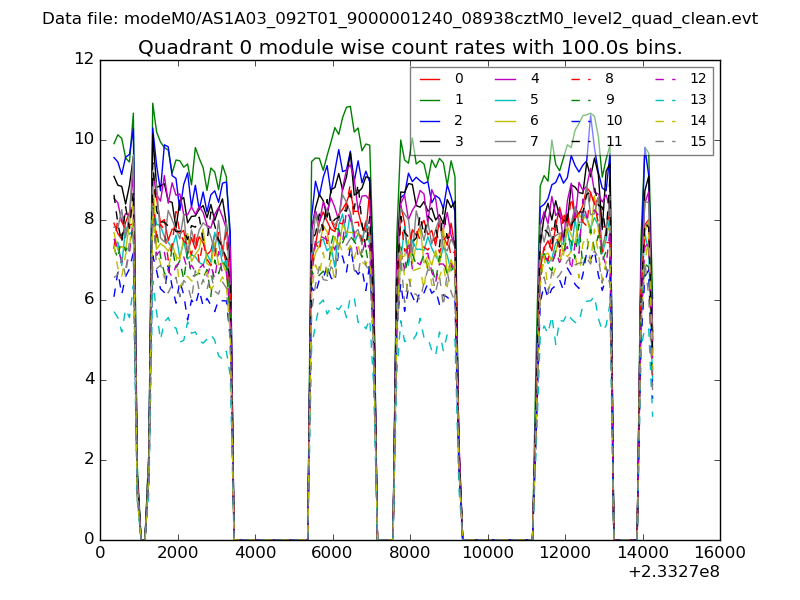 |
 |
| Module-wise count rates for Quadrant B Data is divided into 100 sec bins |
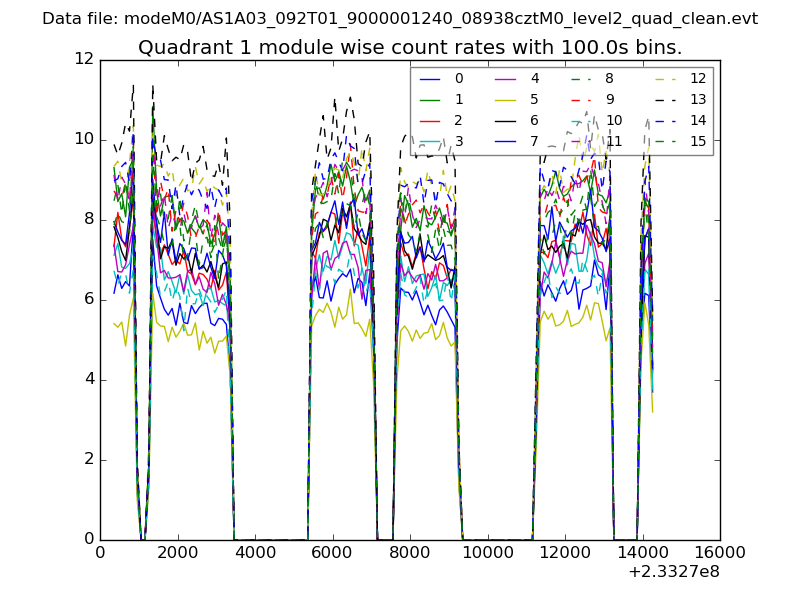 |
 |
| Module-wise count rates for Quadrant C Data is divided into 100 sec bins |
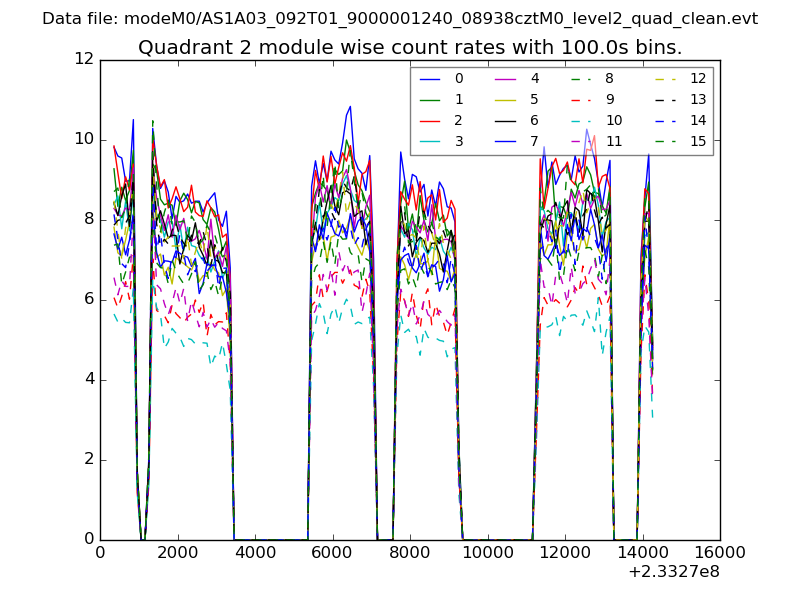 |
 |
| Module-wise count rates for Quadrant D Data is divided into 100 sec bins |
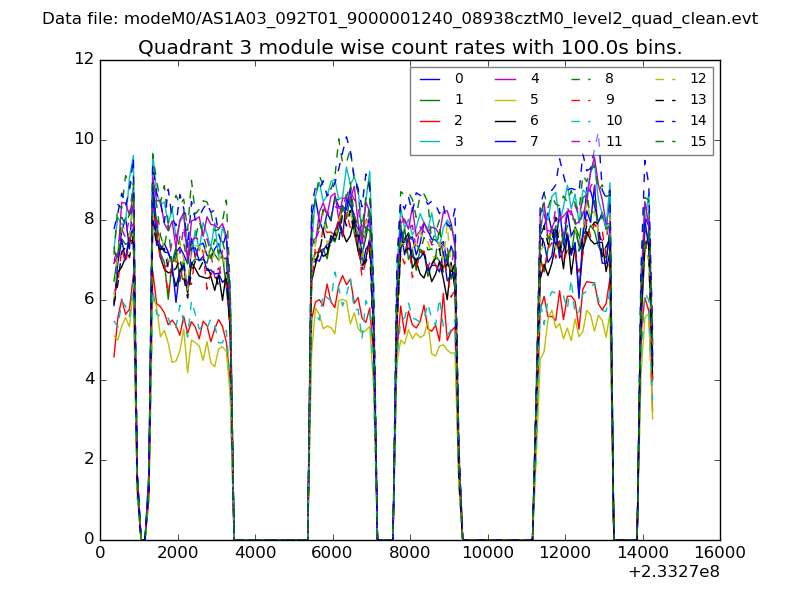 |
 |
| Parameter | Plot |
|---|---|
| CZT HV Monitor | 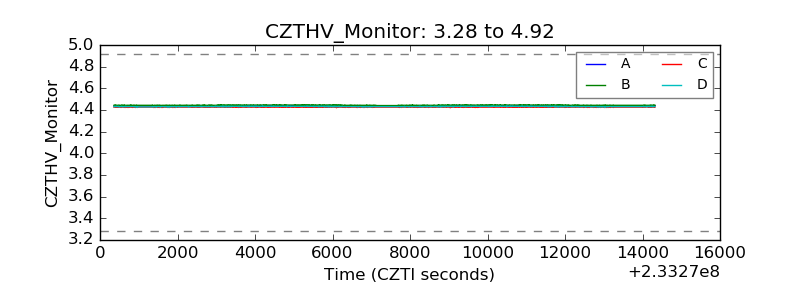 |
| D_VDD | 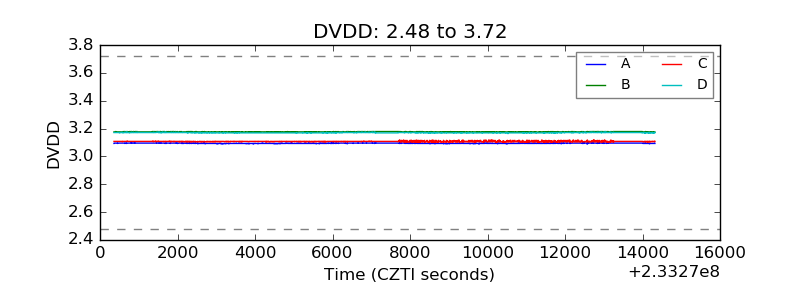 |
| Temperature 1 | 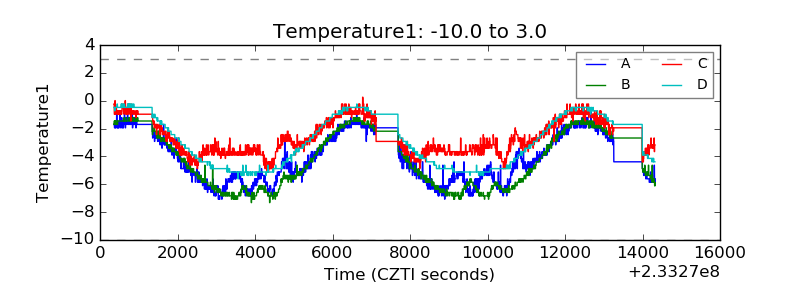 |
| Veto HV Monitor |  |
| Veto LLD | 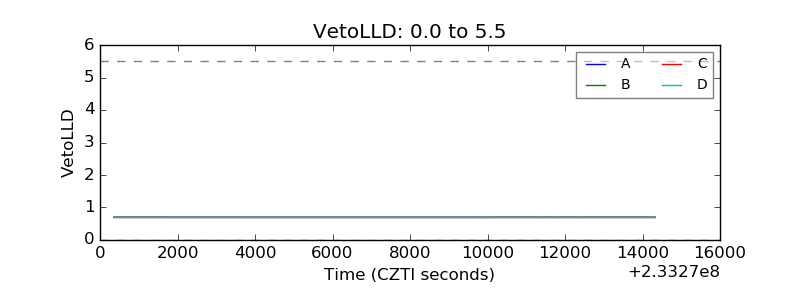 |
| Alpha Counter | 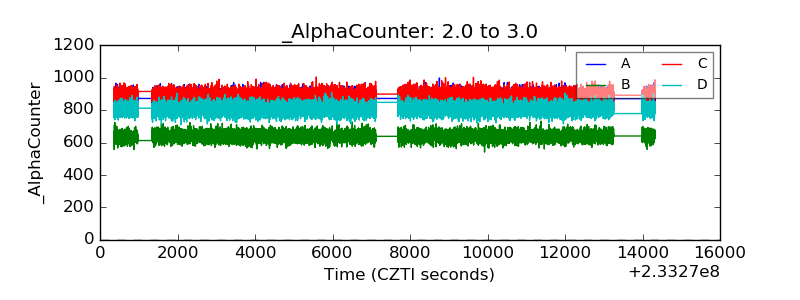 |
| _CPM_Rate | 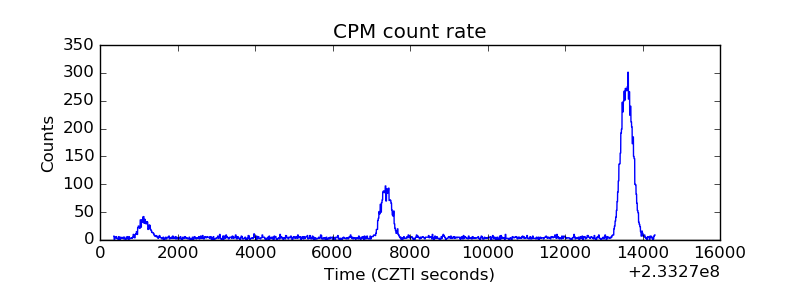 |
| CZT Counter | 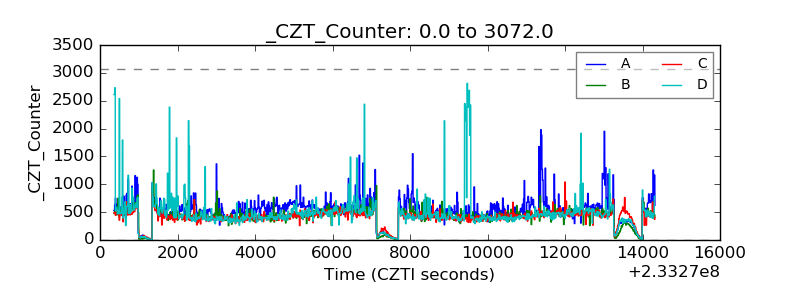 |
| +2.5 Volts monitor |  |
| +5 Volts monitor |  |
| _ROLL_ROT | 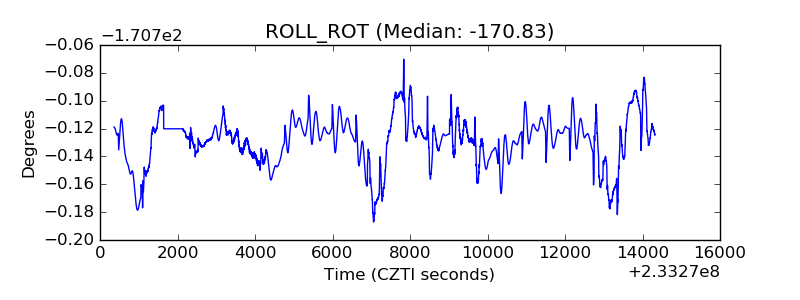 |
| _Roll_DEC |  |
| _Roll_RA | 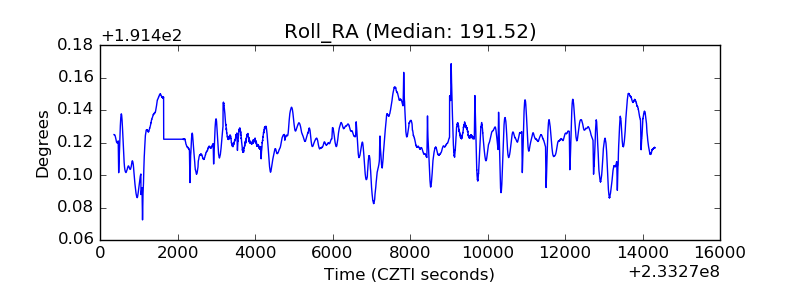 |
| Veto Counter | 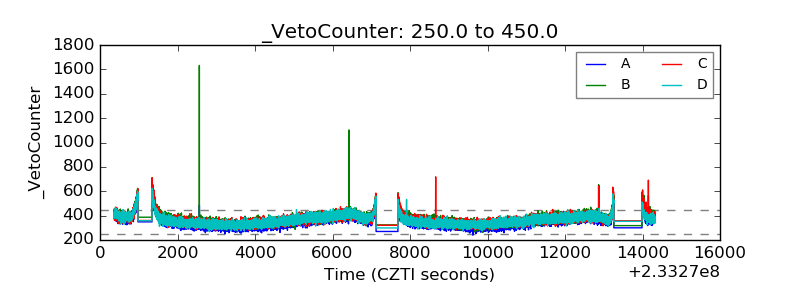 |