| Param | Original file | Final file |
|---|---|---|
| Filename | modeM0/AS1A03_092T01_9000001240_08940cztM0_level2.evt | modeM0/AS1A03_092T01_9000001240_08940cztM0_level2_quad_clean.evt |
| Size (bytes) | 2,493,380,160 | 421,159,680 |
| Size | 2.3 GB | 401.6 MB |
| Events in quadrant A | 21,653,098 | 2,598,127 |
| Events in quadrant B | 16,426,146 | 2,659,480 |
| Events in quadrant C | 15,413,732 | 2,599,772 |
| Events in quadrant D | 19,658,270 | 2,495,292 |
| Mode M9 | |||
|---|---|---|---|
| Quadrant | BADHDUFLAG | Total packets | Discarded packets |
| A | 0 | 37 | 0 |
| B | 0 | 37 | 0 |
| C | 0 | 37 | 0 |
| D | 0 | 37 | 0 |
| Mode SS | |||
|---|---|---|---|
| Quadrant | BADHDUFLAG | Total packets | Discarded packets |
| A | 0 | 714 | 0 |
| B | 0 | 714 | 0 |
| C | 0 | 714 | 0 |
| D | 0 | 714 | 0 |
| Mode M0 | |||
|---|---|---|---|
| Quadrant | BADHDUFLAG | Total packets | Discarded packets |
| A | 0 | 87144 | 7 |
| B | 0 | 72328 | 6 |
| C | 0 | 71119 | 8 |
| D | 0 | 82622 | 6 |
| Quadrant | Total seconds | Saturated seconds | Saturation percentage |
|---|---|---|---|
| A | 34975 | 856 | 2.447462% |
| B | 34975 | 172 | 0.491780% |
| C | 34974 | 84 | 0.240178% |
| D | 34975 | 955 | 2.730522% |
Noise dominated data is calculated using 1-second bins in cleaned event files. If a bin has >2000 counts, and if more than 50% of those come from <1% of pixels, then it is considered to be noise-dominated and hence unusable.
| Quadrant | # 1 sec bins | Bins with >0 counts | Bins with >2000 counts | High rate bins dominated by noise | Noise dominated (total time) | Noise dominated (detector-on time) | Marked lightcurve |
|---|---|---|---|---|---|---|---|
| A | 38765 | 34981 | 635 | 635 | 1.64% | 1.82% | 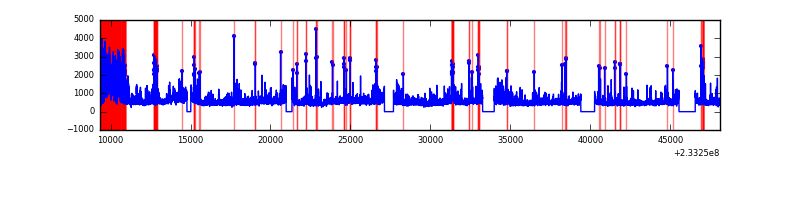 |
| B | 38765 | 34981 | 16 | 16 | 0.04% | 0.05% | 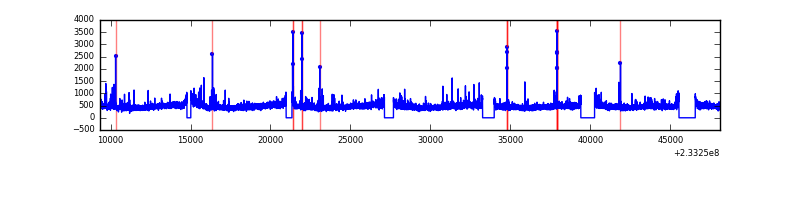 |
| C | 38765 | 34981 | 9 | 9 | 0.02% | 0.03% | 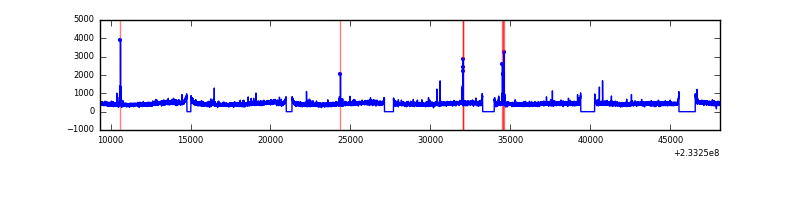 |
| D | 38765 | 34981 | 820 | 820 | 2.12% | 2.34% | 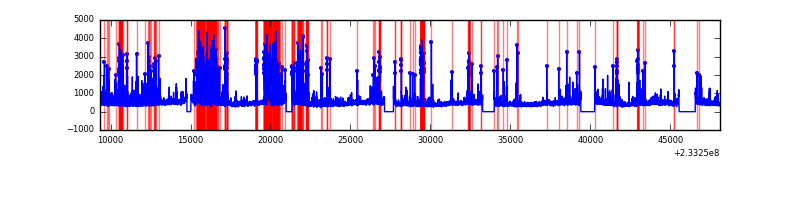 |
Top three noisy pixels from each quadrant. If the there are fewer than three noisy pixels in the level2.evt file, extra rows are filled as -1
| Pixel properties | Quadrant properties | ||||||
|---|---|---|---|---|---|---|---|
| Quadrant | DetID | PixID | Counts | Sigma | Mean | Median | Sigma |
| A | 8 | 5 | 3369386 | 4160.17 | 4015 | 3929 | 809.0 |
| A | 0 | 128 | 2323489 | 2867.29 | 4015 | 3929 | 809.0 |
| A | 5 | 16 | 319355 | 389.91 | 4015 | 3929 | 809.0 |
| B | 0 | 219 | 114661 | 144.69 | 4069 | 3974 | 765.0 |
| B | 0 | 168 | 95183 | 119.23 | 4069 | 3974 | 765.0 |
| B | 12 | 111 | 82023 | 102.03 | 4069 | 3974 | 765.0 |
| C | 14 | 234 | 80233 | 84.87 | 3907 | 3925 | 899.1 |
| C | 5 | 128 | 52567 | 54.1 | 3907 | 3925 | 899.1 |
| C | 1 | 3 | 39955 | 40.07 | 3907 | 3925 | 899.1 |
| D | 1 | 52 | 1770796 | 1717.25 | 3852 | 3765 | 1029.0 |
| D | 12 | 233 | 1383779 | 1341.13 | 3852 | 3765 | 1029.0 |
| D | 8 | 195 | 646589 | 624.71 | 3852 | 3765 | 1029.0 |
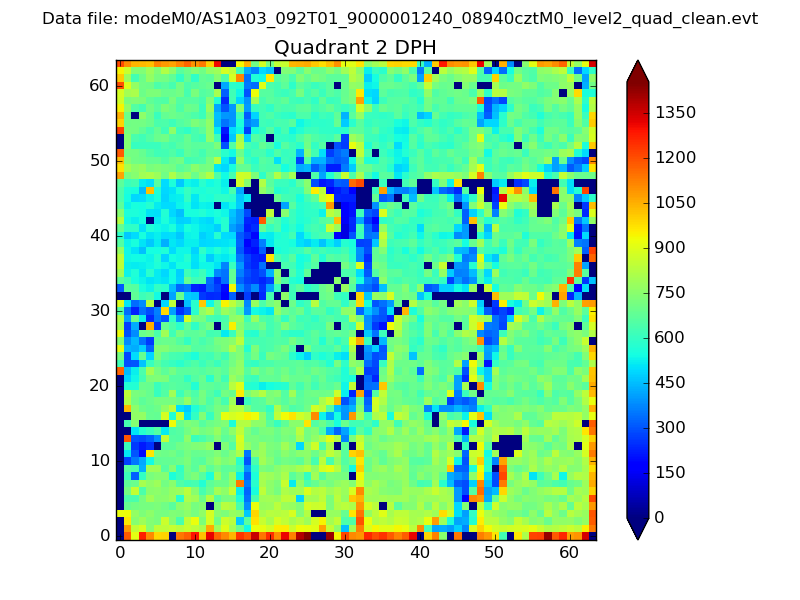
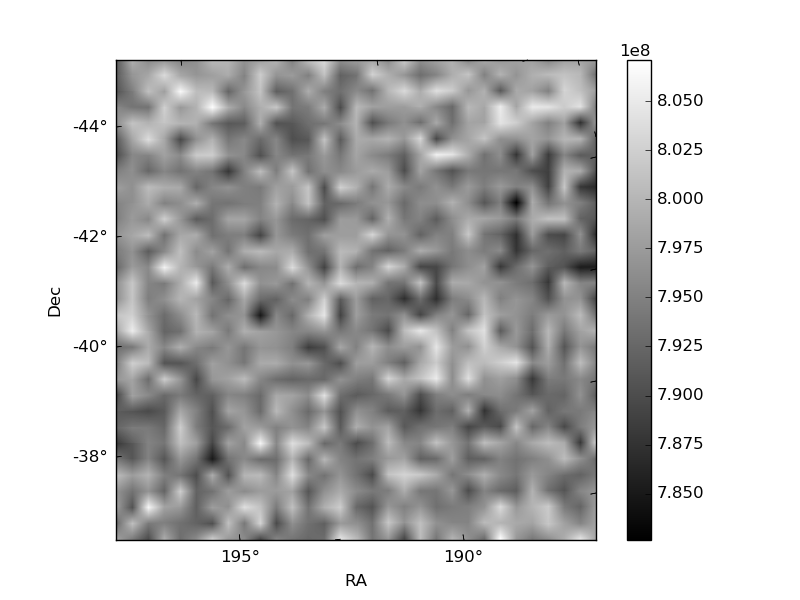
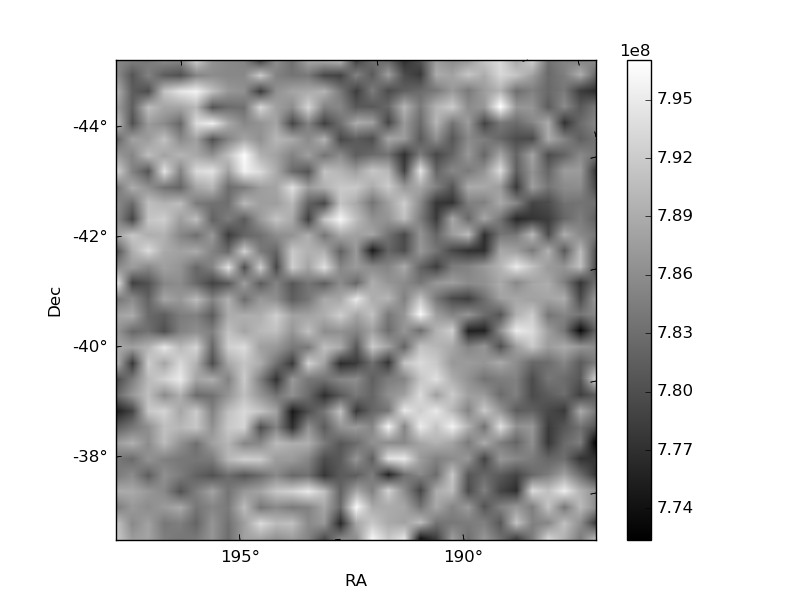
Histogram calculated using DETX and DETY for each event in the final _common_clean file
| Quadrant A | 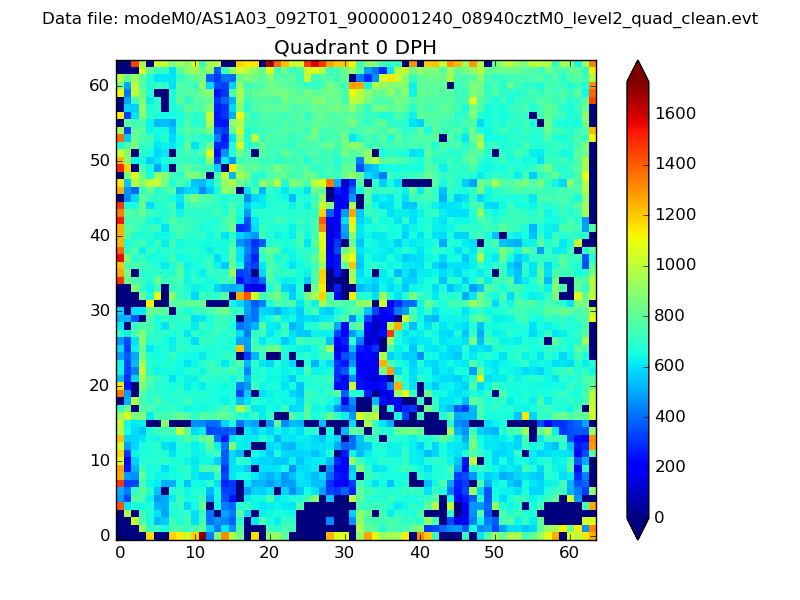 |
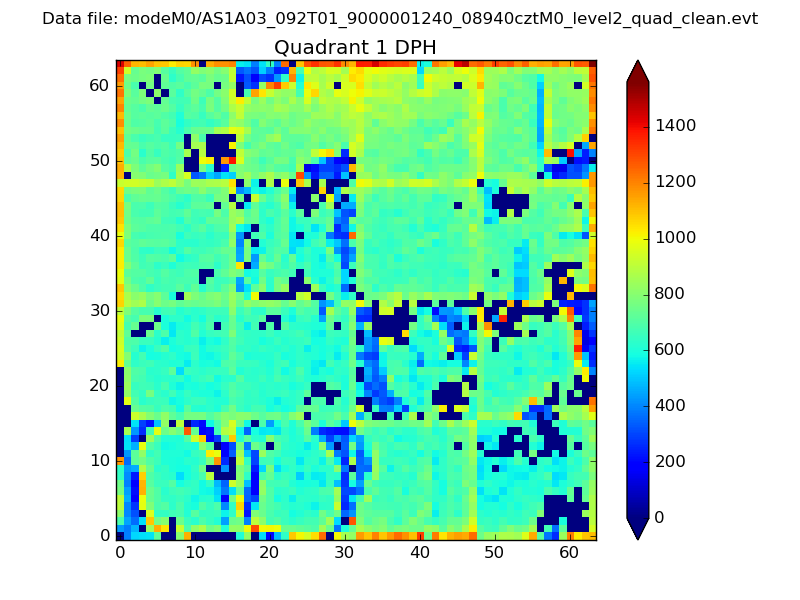 |
Quadrant B |
|---|---|---|---|
| Quadrant D | 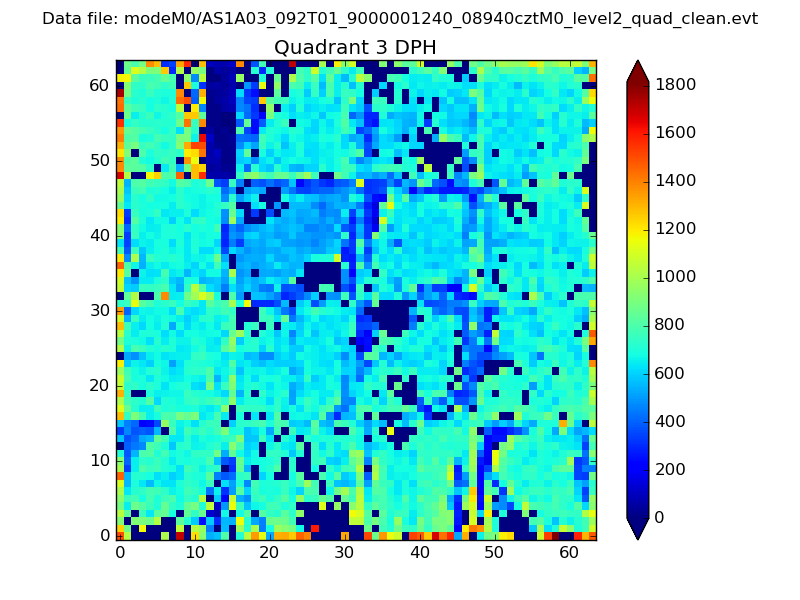 |
 |
Quadrant C |
| Plot type | Count rate plots | Images |
|---|---|---|
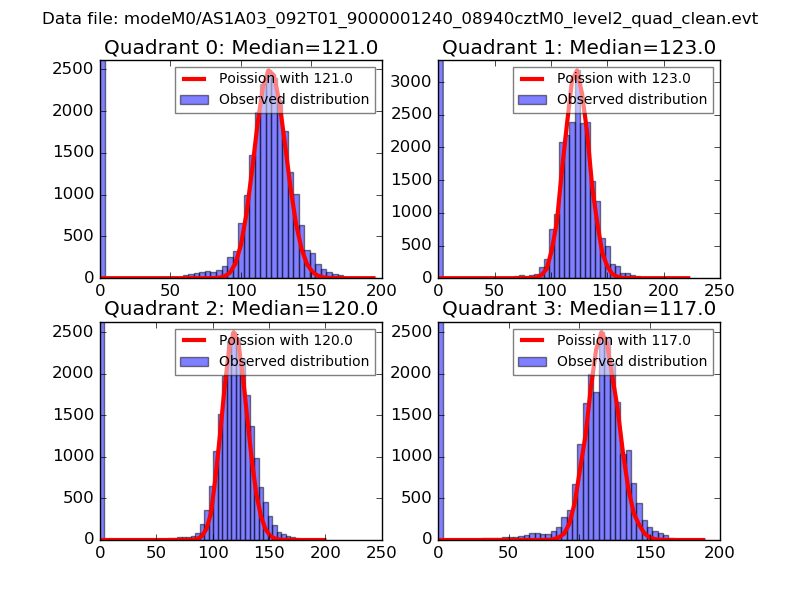
| Comparison with Poisson distribution Blue bars denote a histogram of data divided into 1 sec bins. Red curve is a Poisson curve with rate = median count rate of data. |
 |
 |
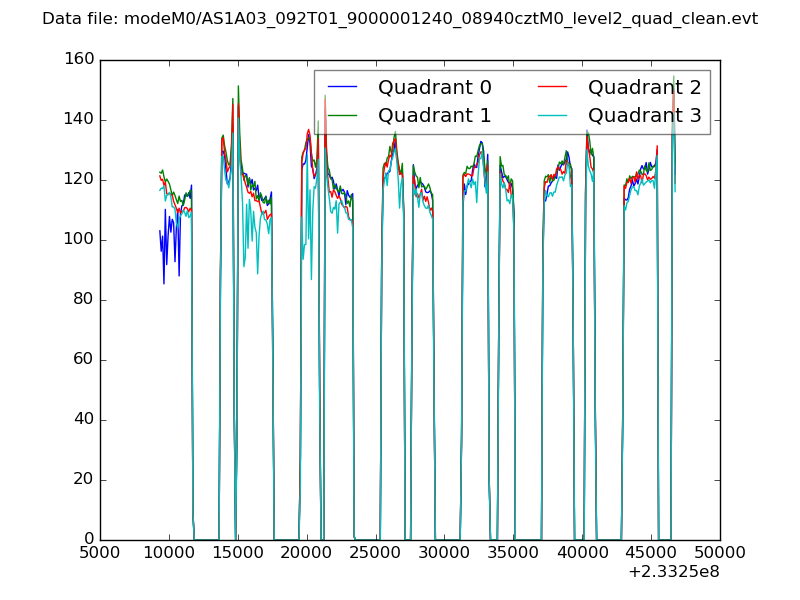
| Quadrant-wise count rates Data is divided into 100 sec bins |
 |
|
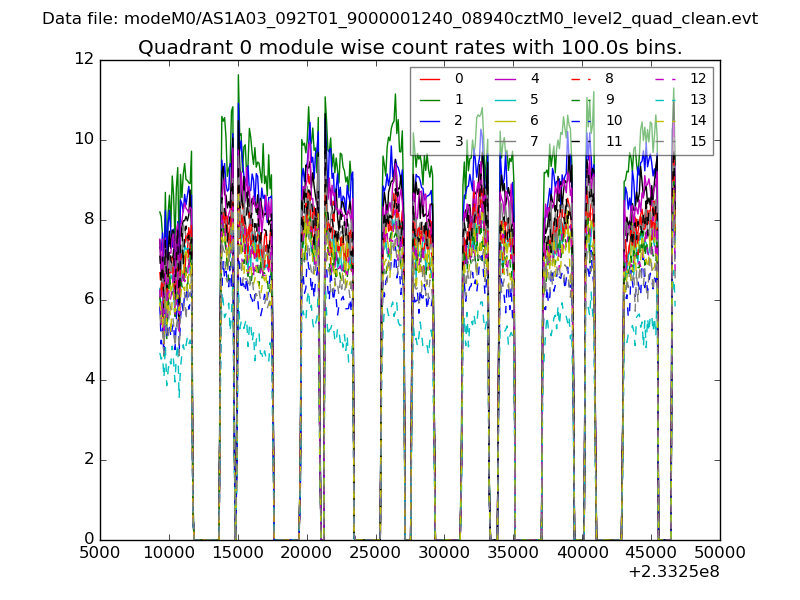
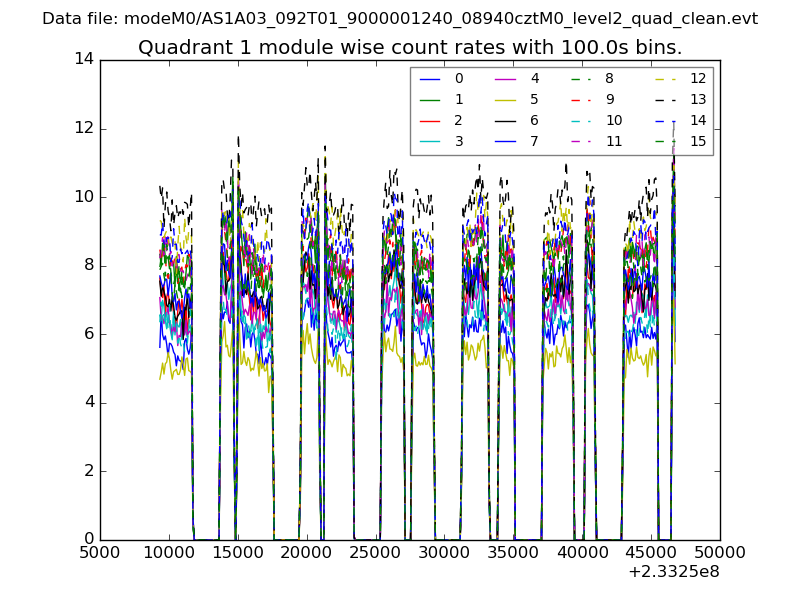
| Module-wise count rates for Quadrant A Data is divided into 100 sec bins |
 |
 |
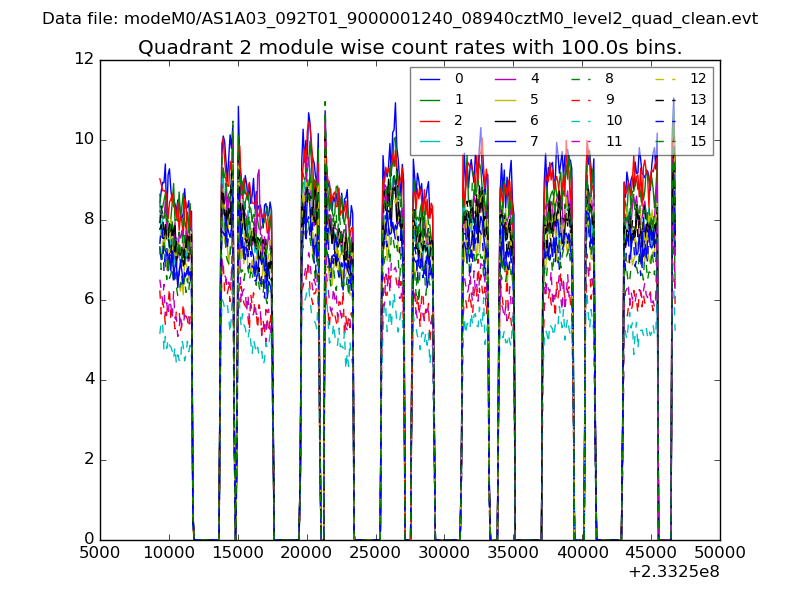
| Module-wise count rates for Quadrant B Data is divided into 100 sec bins |
 |
 |
| Module-wise count rates for Quadrant C Data is divided into 100 sec bins |
 |
 |
| Module-wise count rates for Quadrant D Data is divided into 100 sec bins |
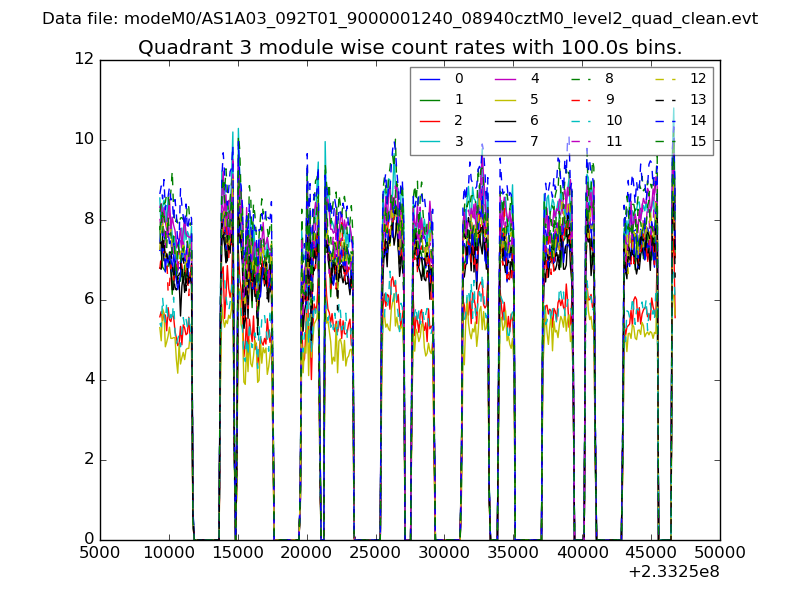 |
 |
| Parameter | Plot |
|---|---|
| CZT HV Monitor | 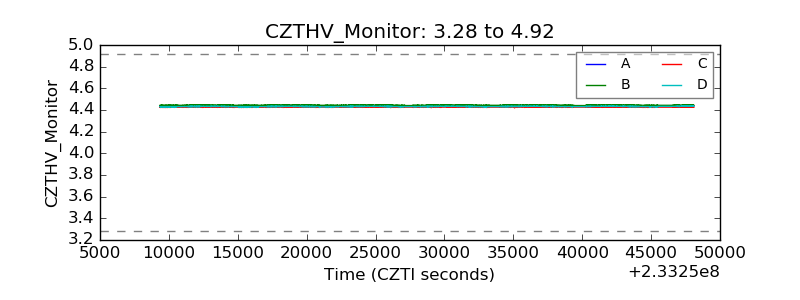 |
| D_VDD | 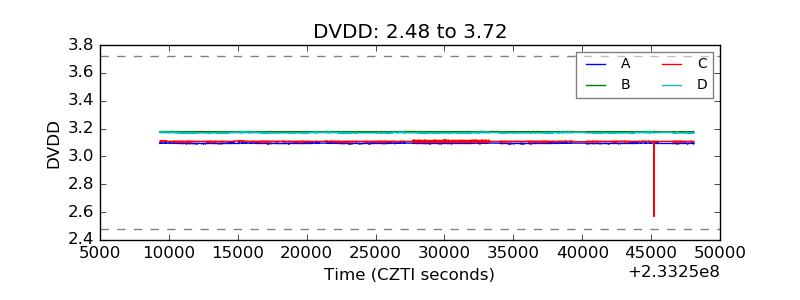 |
| Temperature 1 | 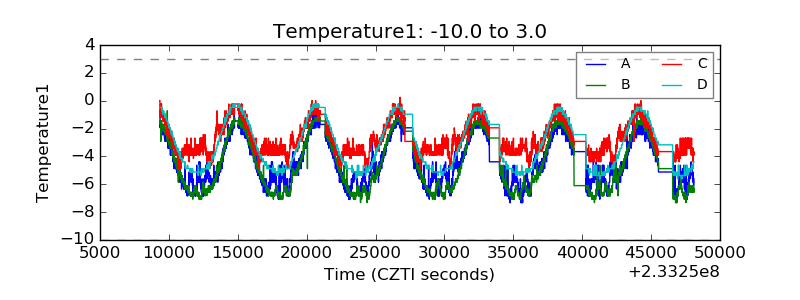 |
| Veto HV Monitor | 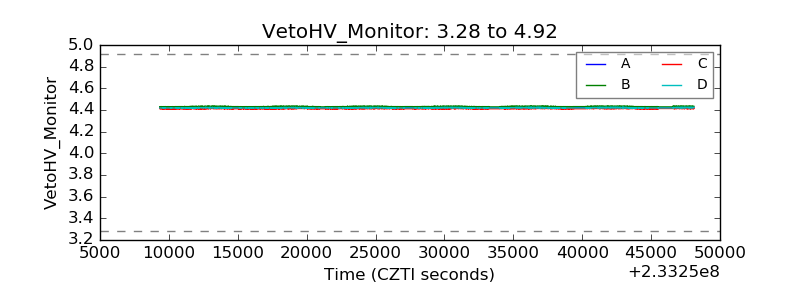 |
| Veto LLD | 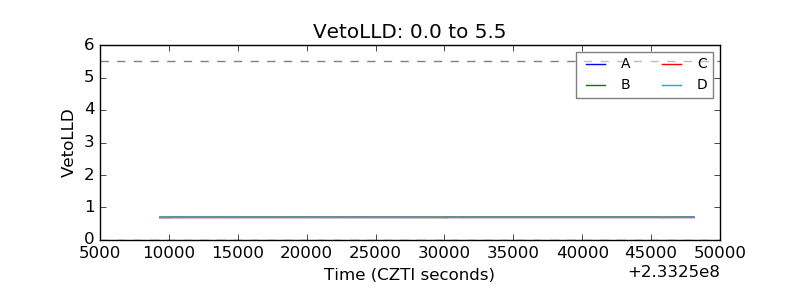 |
| Alpha Counter | 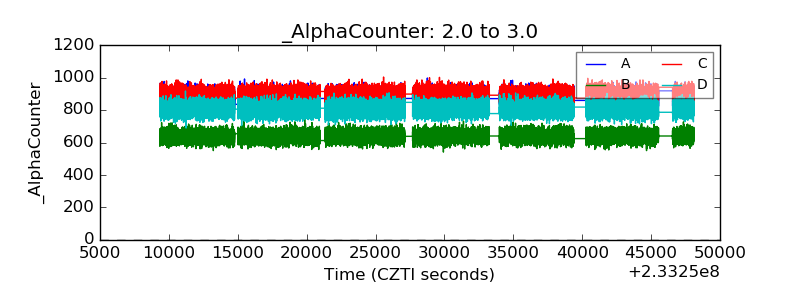 |
| _CPM_Rate | 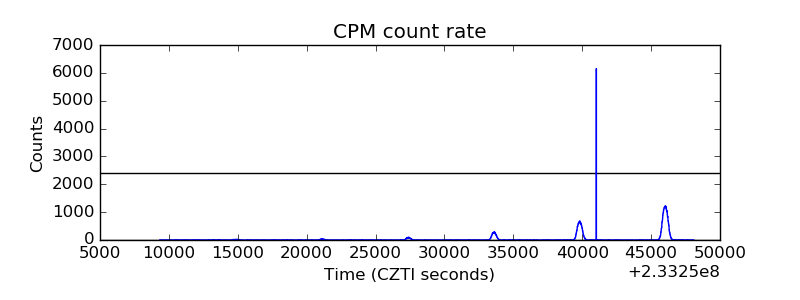 |
| CZT Counter | 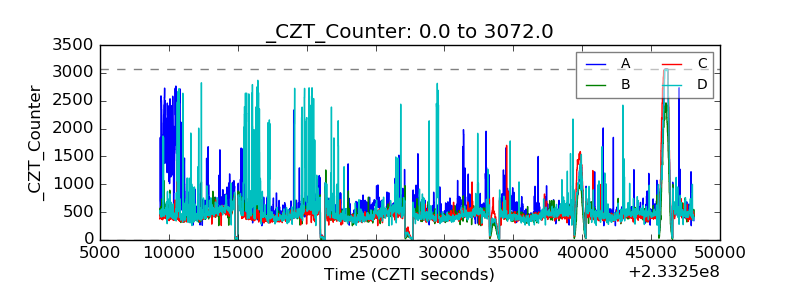 |
| +2.5 Volts monitor |  |
| +5 Volts monitor |  |
| _ROLL_ROT | 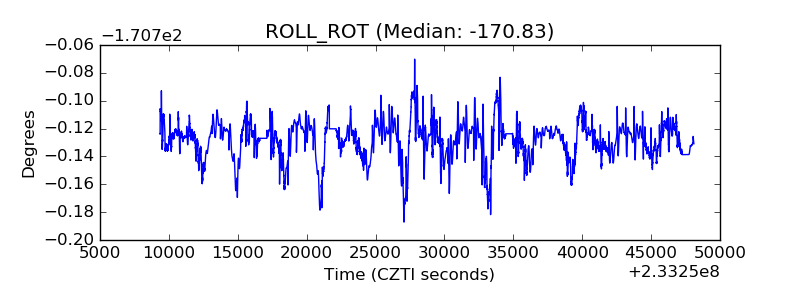 |
| _Roll_DEC | 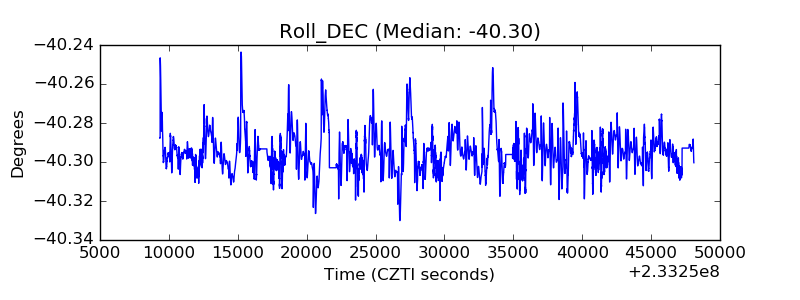 |
| _Roll_RA | 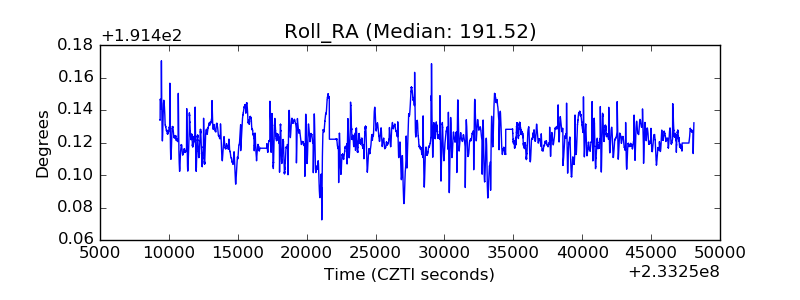 |
| Veto Counter | 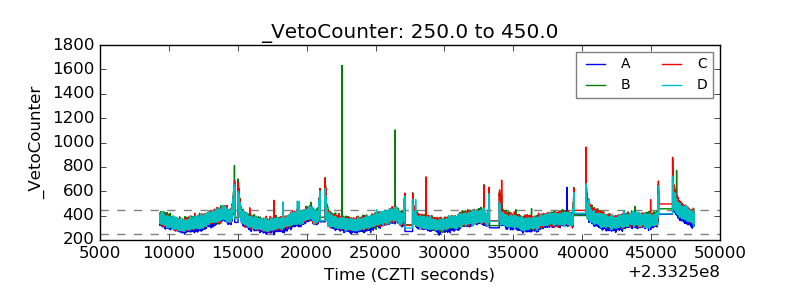 |