| Param | Original file | Final file |
|---|---|---|
| Filename | modeM0/AS1A03_092T01_9000001240_08942cztM0_level2.evt | modeM0/AS1A03_092T01_9000001240_08942cztM0_level2_quad_clean.evt |
| Size (bytes) | 872,789,760 | 134,478,720 |
| Size | 832.4 MB | 128.2 MB |
| Events in quadrant A | 6,896,145 | 821,134 |
| Events in quadrant B | 5,997,900 | 831,970 |
| Events in quadrant C | 5,433,514 | 818,934 |
| Events in quadrant D | 7,301,472 | 778,975 |
| Mode M9 | |||
|---|---|---|---|
| Quadrant | BADHDUFLAG | Total packets | Discarded packets |
| A | 0 | 22 | 0 |
| B | 0 | 22 | 0 |
| C | 0 | 22 | 0 |
| D | 0 | 22 | 0 |
| Mode SS | |||
|---|---|---|---|
| Quadrant | BADHDUFLAG | Total packets | Discarded packets |
| A | 0 | 240 | 0 |
| B | 0 | 240 | 0 |
| C | 0 | 240 | 0 |
| D | 0 | 240 | 0 |
| Mode M0 | |||
|---|---|---|---|
| Quadrant | BADHDUFLAG | Total packets | Discarded packets |
| A | 0 | 28175 | 5 |
| B | 0 | 25586 | 3 |
| C | 0 | 24410 | 3 |
| D | 0 | 29413 | 3 |
| Quadrant | Total seconds | Saturated seconds | Saturation percentage |
|---|---|---|---|
| A | 11883 | 200 | 1.683077% |
| B | 11883 | 126 | 1.060338% |
| C | 11883 | 54 | 0.454431% |
| D | 11883 | 359 | 3.021123% |
Noise dominated data is calculated using 1-second bins in cleaned event files. If a bin has >2000 counts, and if more than 50% of those come from <1% of pixels, then it is considered to be noise-dominated and hence unusable.
| Quadrant | # 1 sec bins | Bins with >0 counts | Bins with >2000 counts | High rate bins dominated by noise | Noise dominated (total time) | Noise dominated (detector-on time) | Marked lightcurve |
|---|---|---|---|---|---|---|---|
| A | 42092 | 11886 | 57 | 57 | 0.14% | 0.48% | 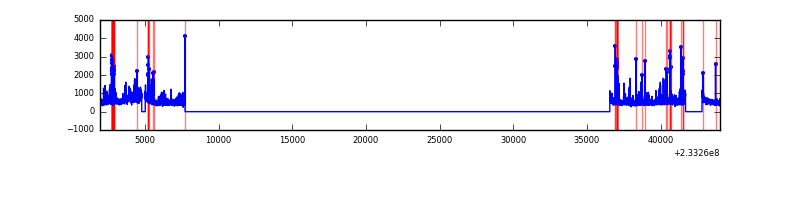 |
| B | 42092 | 11886 | 17 | 17 | 0.04% | 0.14% | 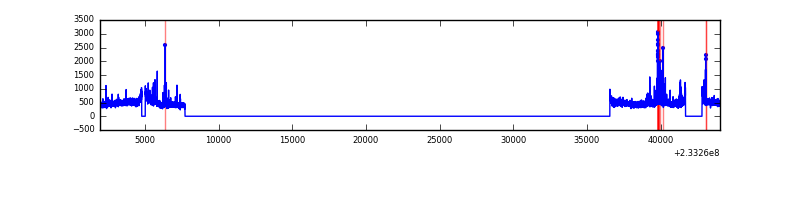 |
| C | 42092 | 11886 | 0 | 0 | 0.00% | 0.00% | 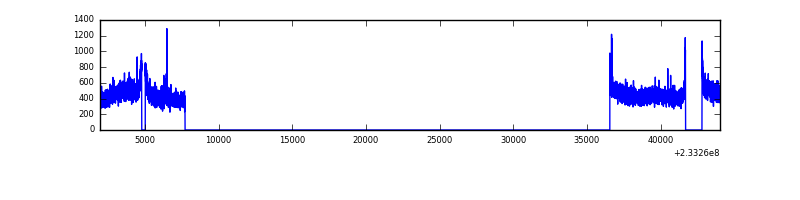 |
| D | 42092 | 11885 | 303 | 303 | 0.72% | 2.55% | 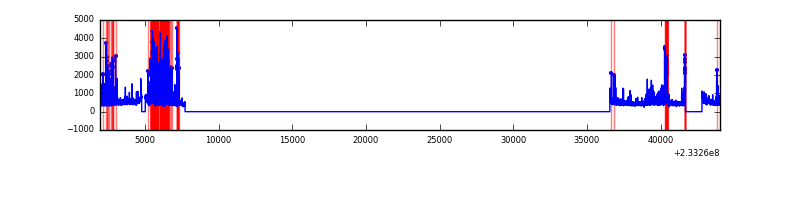 |
Top three noisy pixels from each quadrant. If the there are fewer than three noisy pixels in the level2.evt file, extra rows are filled as -1
| Pixel properties | Quadrant properties | ||||||
|---|---|---|---|---|---|---|---|
| Quadrant | DetID | PixID | Counts | Sigma | Mean | Median | Sigma |
| A | 8 | 5 | 1096952 | 3848.51 | 1421 | 1392 | 284.7 |
| A | 5 | 16 | 118466 | 411.26 | 1421 | 1392 | 284.7 |
| A | 3 | 1 | 100584 | 348.44 | 1421 | 1392 | 284.7 |
| B | 6 | 51 | 201974 | 736.64 | 1436 | 1399 | 272.3 |
| B | 0 | 168 | 88572 | 320.16 | 1436 | 1399 | 272.3 |
| B | 0 | 219 | 47967 | 171.03 | 1436 | 1399 | 272.3 |
| C | 1 | 3 | 12574 | 35.0 | 1386 | 1391 | 319.6 |
| C | 5 | 128 | 11907 | 32.91 | 1386 | 1391 | 319.6 |
| C | 13 | 61 | 10563 | 28.7 | 1386 | 1391 | 319.6 |
| D | 12 | 233 | 915869 | 2506.28 | 1365 | 1333 | 364.9 |
| D | 1 | 52 | 399898 | 1092.27 | 1365 | 1333 | 364.9 |
| D | 8 | 195 | 354542 | 967.97 | 1365 | 1333 | 364.9 |
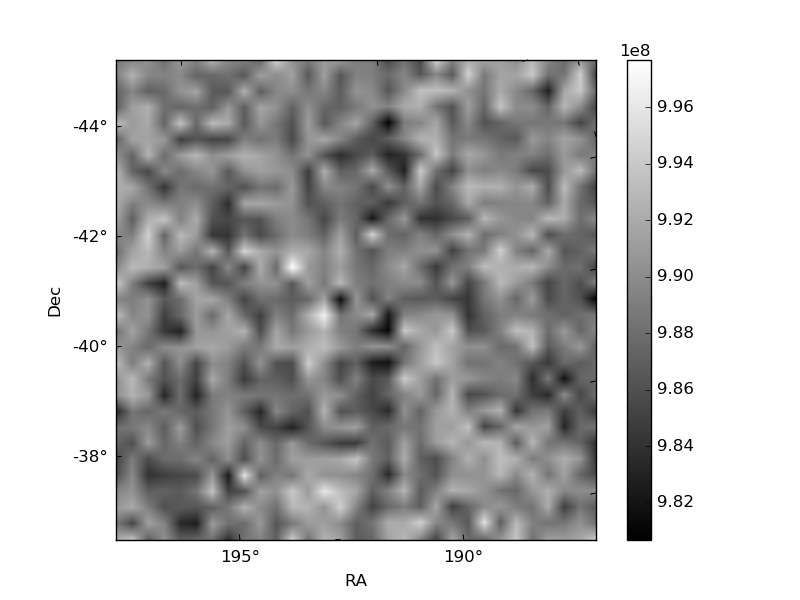
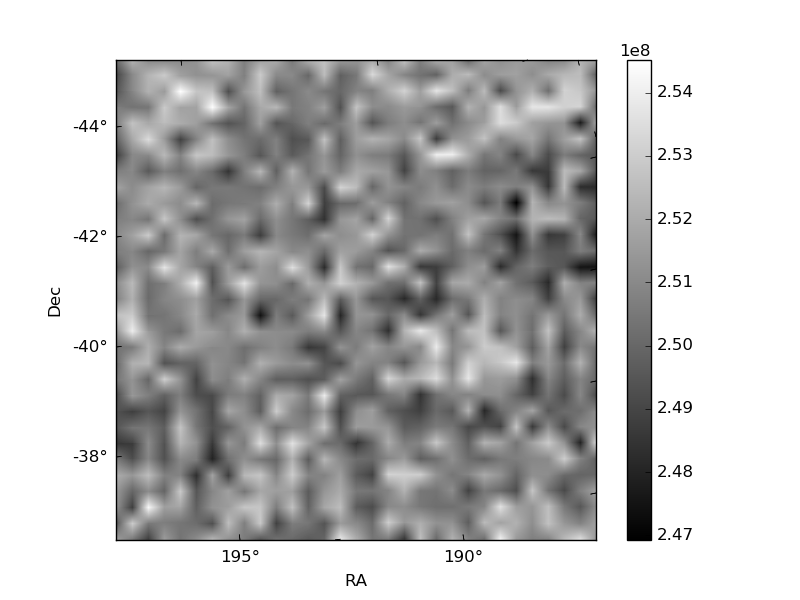
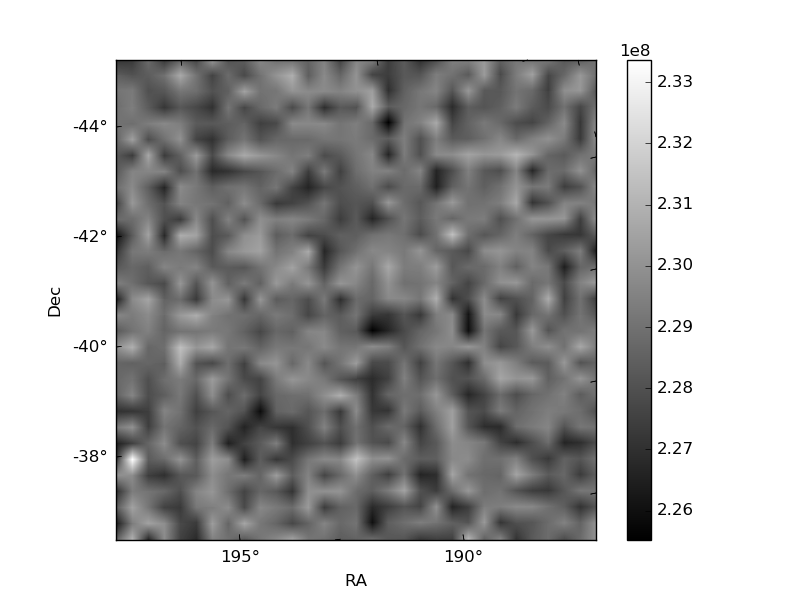
Histogram calculated using DETX and DETY for each event in the final _common_clean file
| Quadrant A | 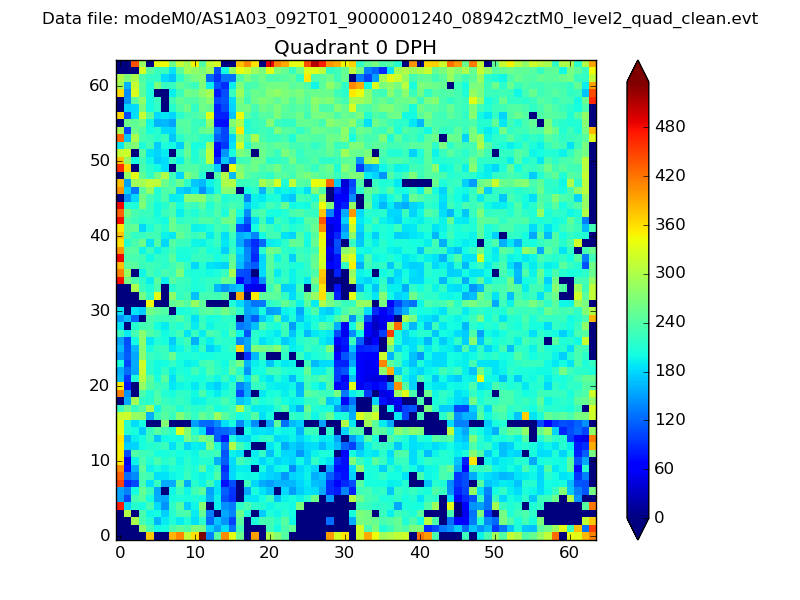 |
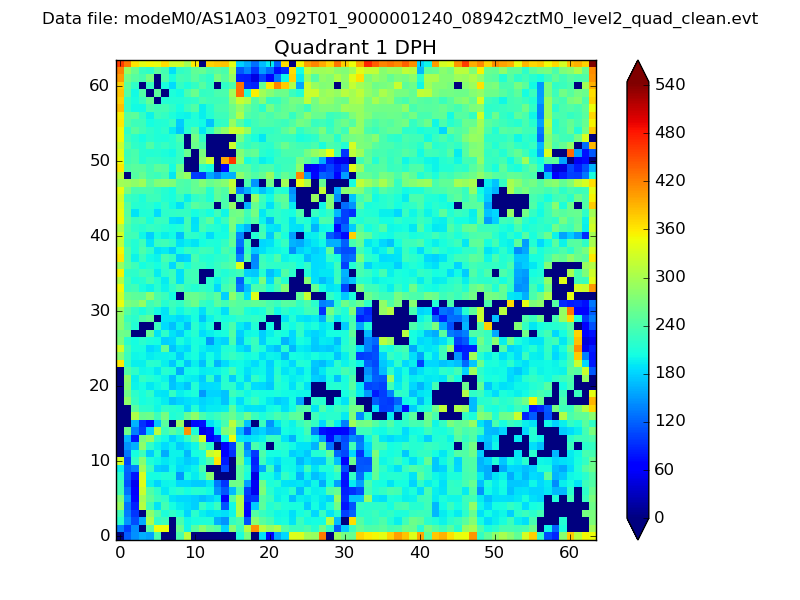 |
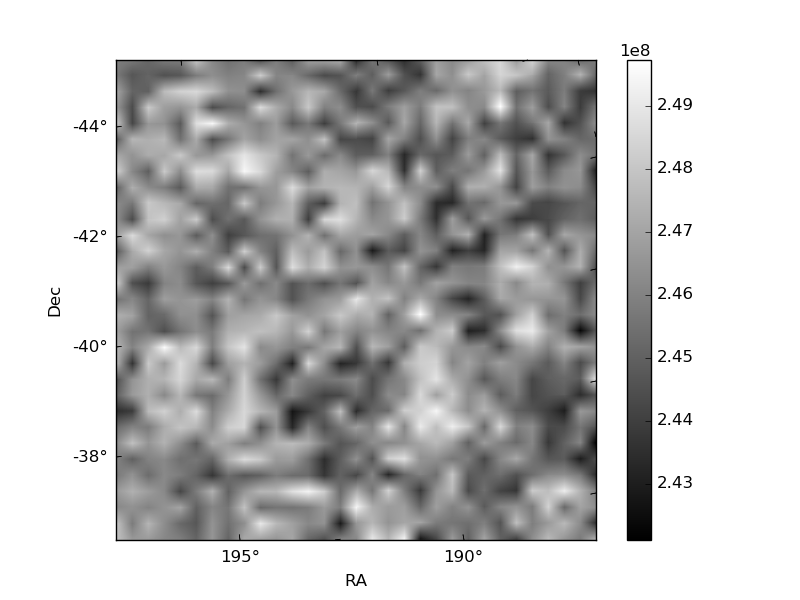
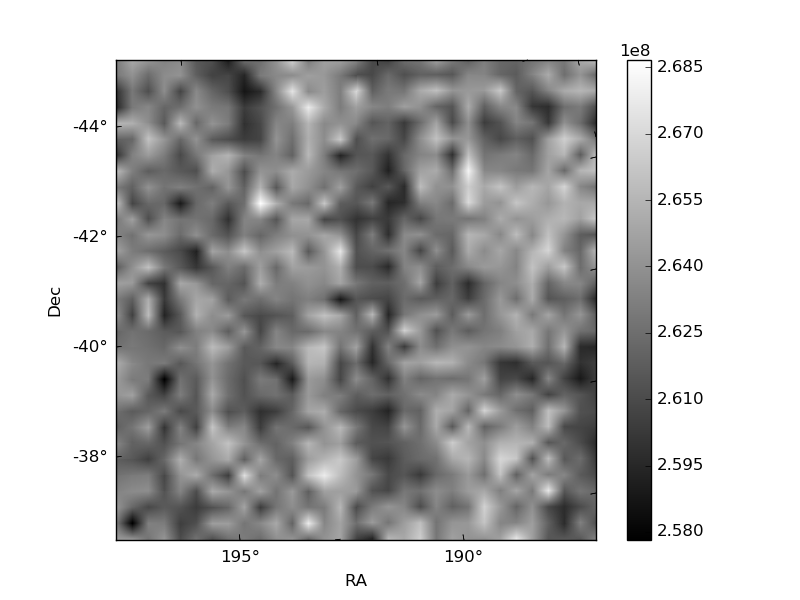
Quadrant B |
|---|---|---|---|
| Quadrant D | 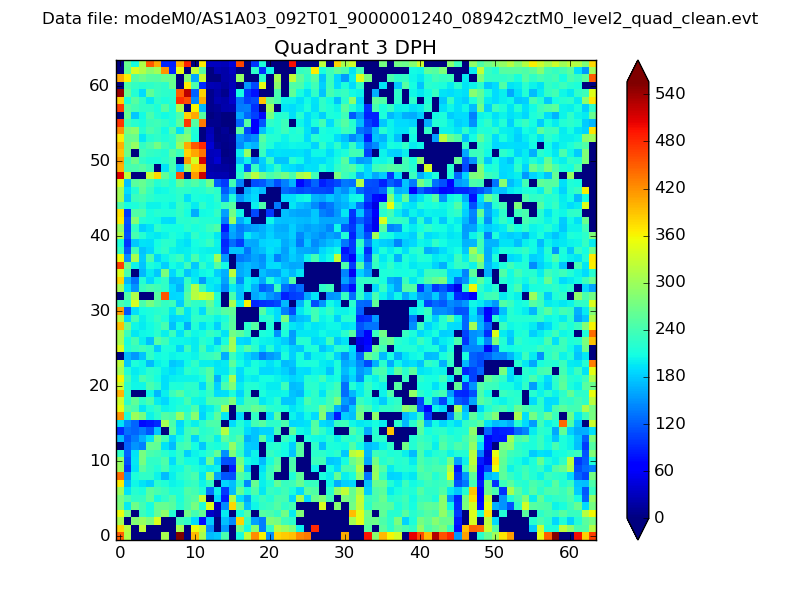 |
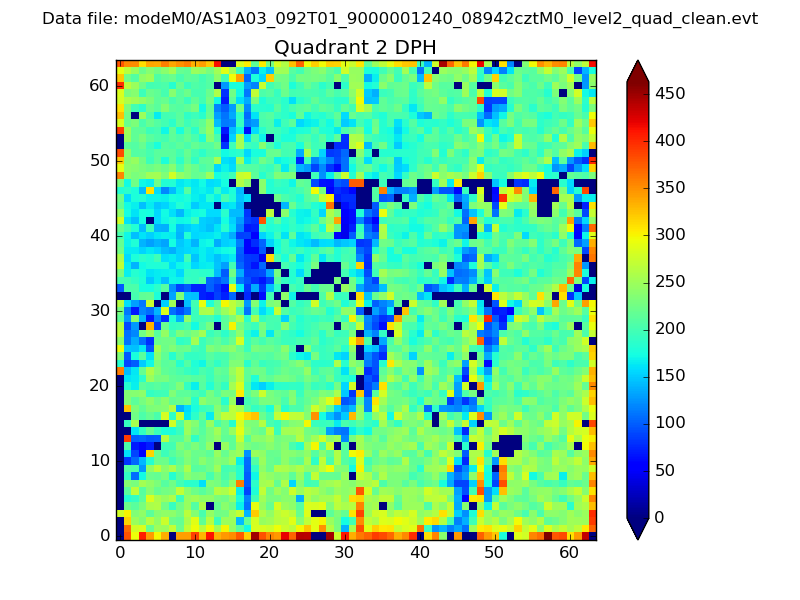 |
Quadrant C |
| Plot type | Count rate plots | Images |
|---|---|---|
| Comparison with Poisson distribution Blue bars denote a histogram of data divided into 1 sec bins. Red curve is a Poisson curve with rate = median count rate of data. |
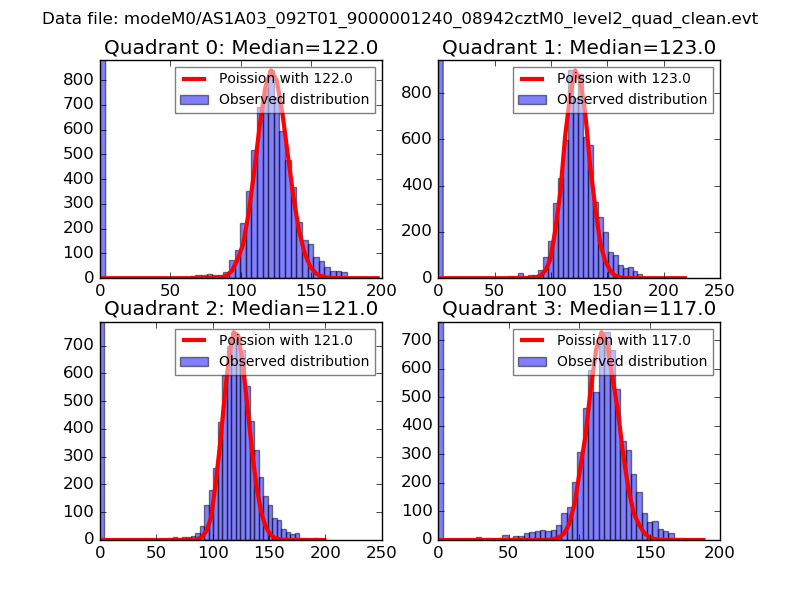 |
 |
| Quadrant-wise count rates Data is divided into 100 sec bins |
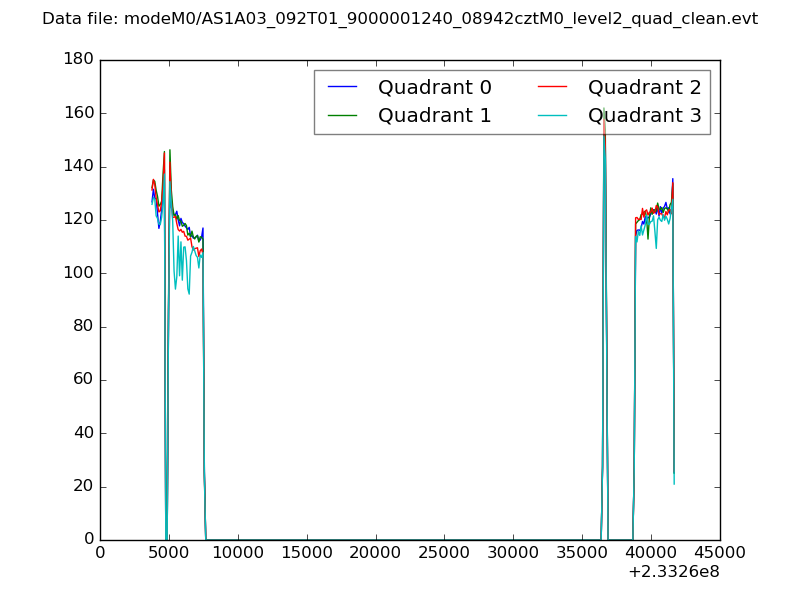 |
|
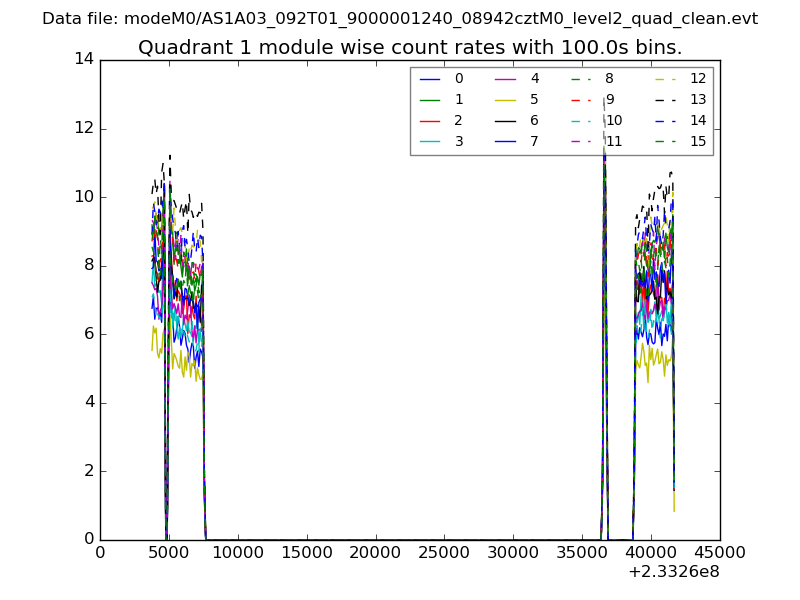
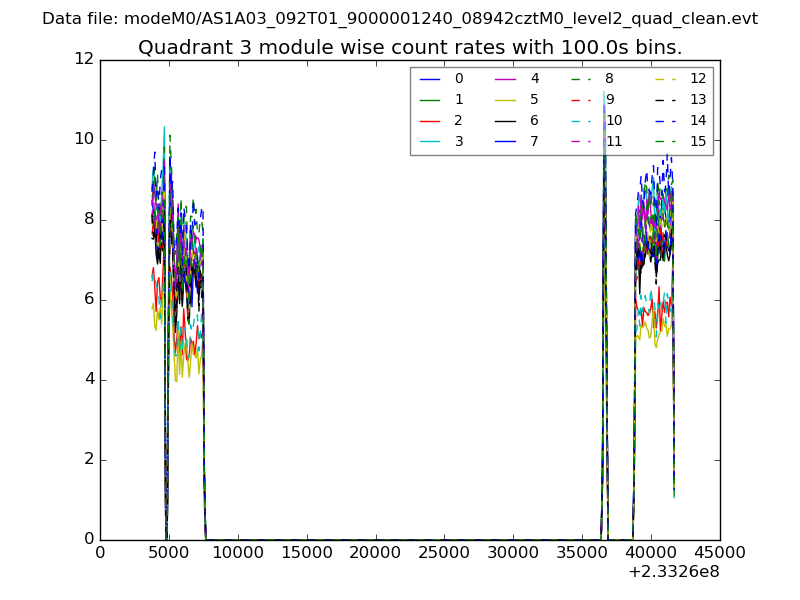
| Module-wise count rates for Quadrant A Data is divided into 100 sec bins |
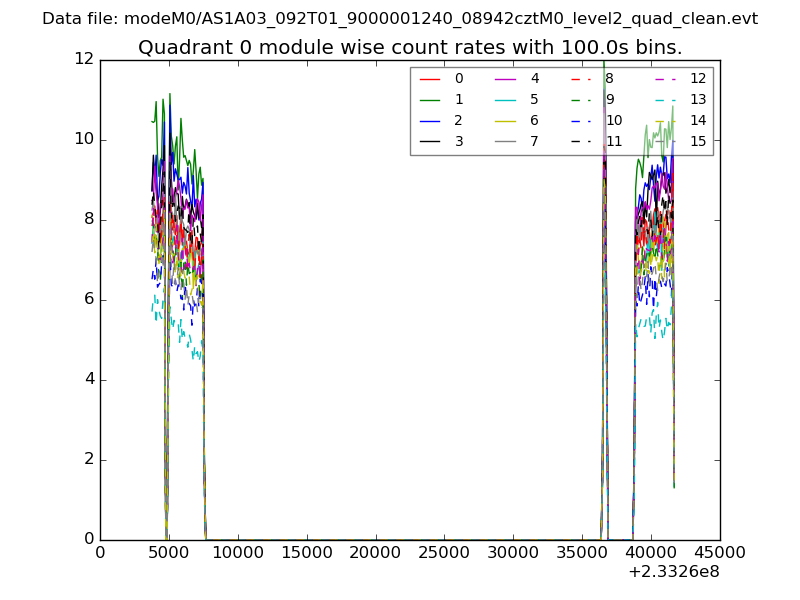 |
 |
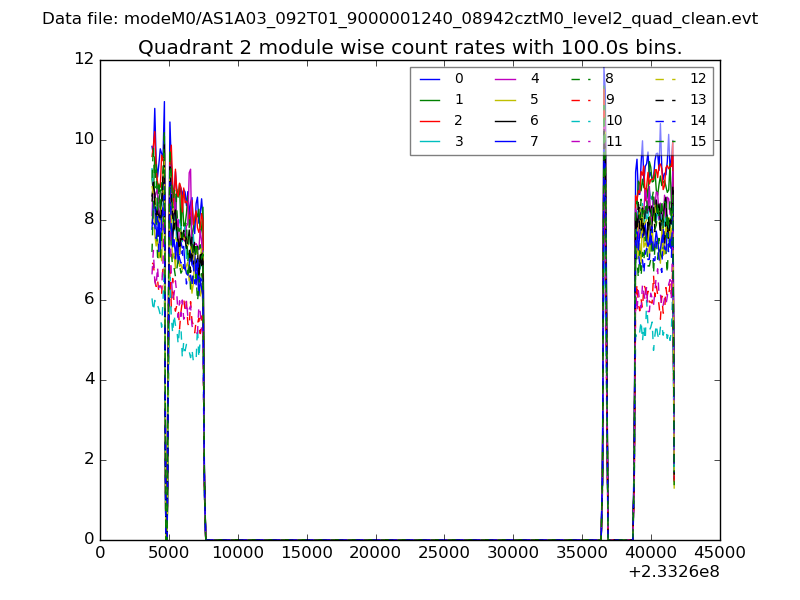
| Module-wise count rates for Quadrant B Data is divided into 100 sec bins |
 |
 |
| Module-wise count rates for Quadrant C Data is divided into 100 sec bins |
 |
 |
| Module-wise count rates for Quadrant D Data is divided into 100 sec bins |
 |
 |
| Parameter | Plot |
|---|---|
| CZT HV Monitor | 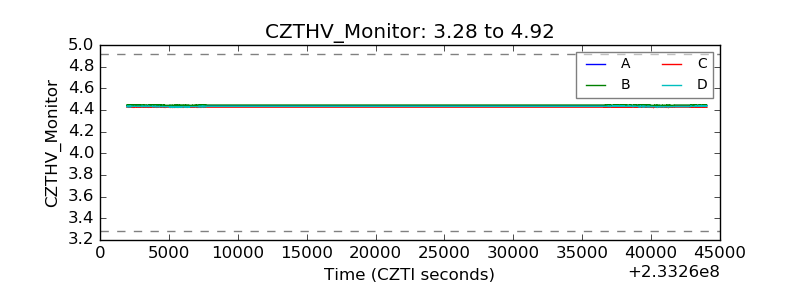 |
| D_VDD | 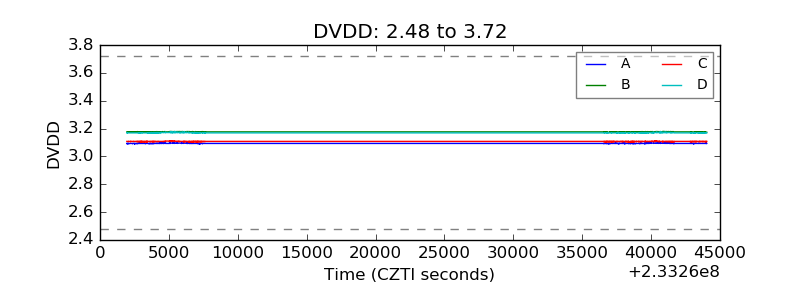 |
| Temperature 1 | 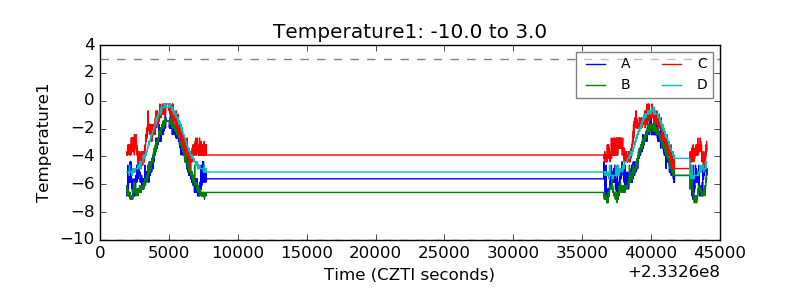 |
| Veto HV Monitor | 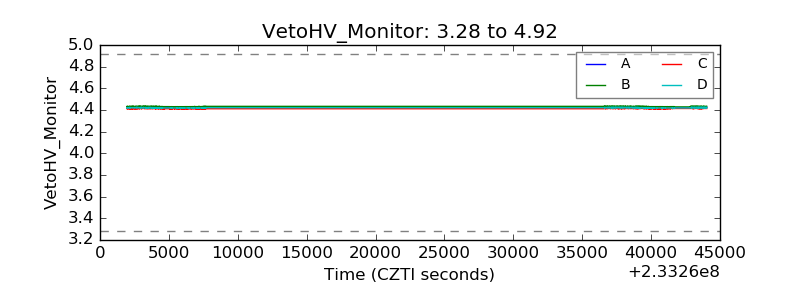 |
| Veto LLD | 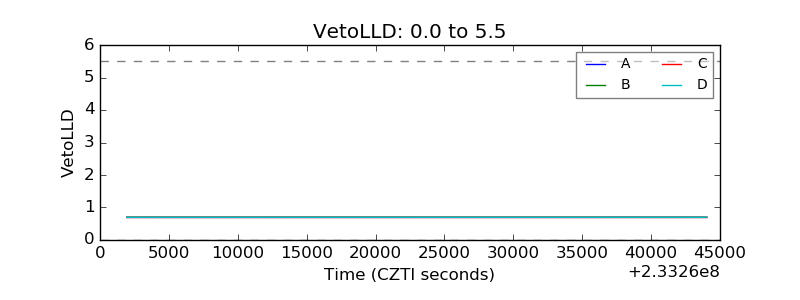 |
| Alpha Counter | 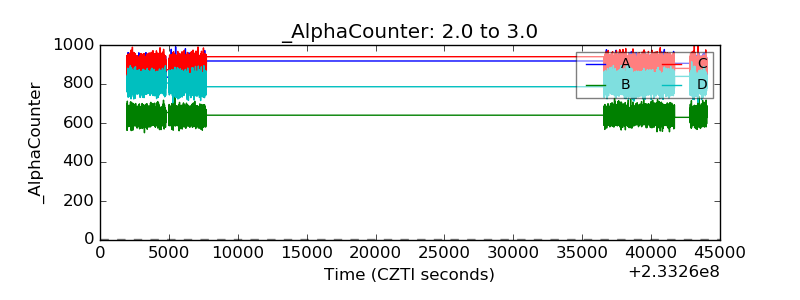 |
| _CPM_Rate | 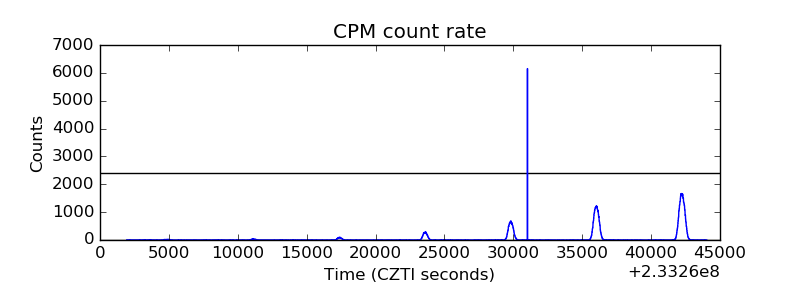 |
| CZT Counter | 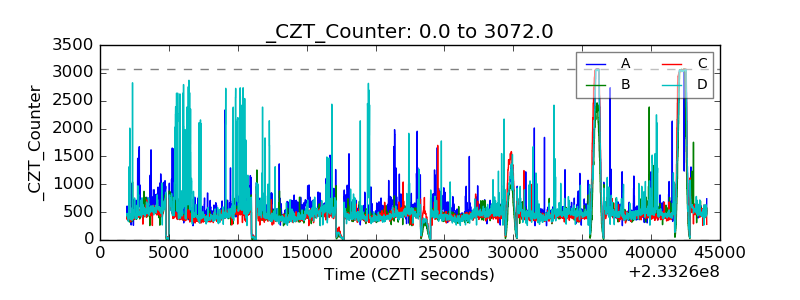 |
| +2.5 Volts monitor |  |
| +5 Volts monitor |  |
| _ROLL_ROT | 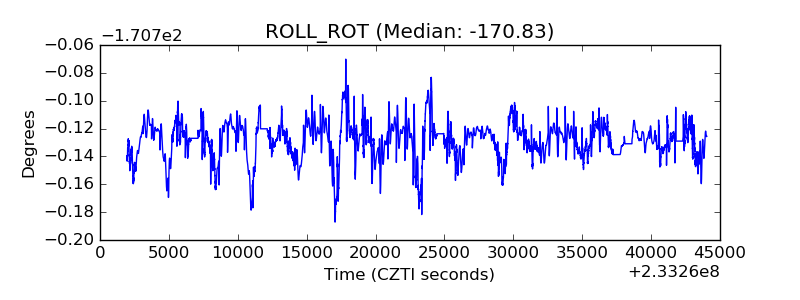 |
| _Roll_DEC |  |
| _Roll_RA | 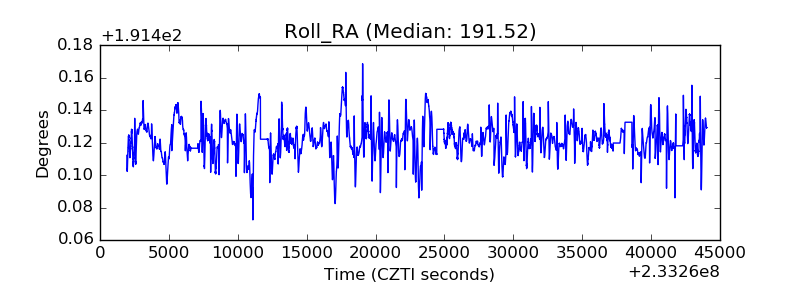 |
| Veto Counter | 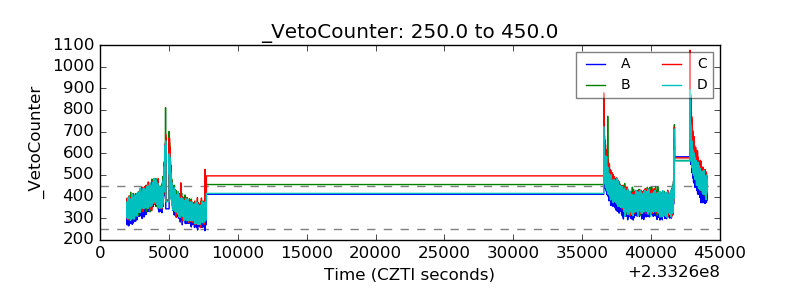 |