| Param | Original file | Final file |
|---|---|---|
| Filename | modeM0/AS1A03_092T01_9000001240_08943cztM0_level2.evt | modeM0/AS1A03_092T01_9000001240_08943cztM0_level2_quad_clean.evt |
| Size (bytes) | 469,483,200 | 67,299,840 |
| Size | 447.7 MB | 64.2 MB |
| Events in quadrant A | 3,551,936 | 400,701 |
| Events in quadrant B | 3,216,999 | 409,786 |
| Events in quadrant C | 3,020,455 | 405,629 |
| Events in quadrant D | 4,006,314 | 387,113 |
| Mode M9 | |||
|---|---|---|---|
| Quadrant | BADHDUFLAG | Total packets | Discarded packets |
| A | 0 | 17 | 0 |
| B | 0 | 17 | 0 |
| C | 0 | 17 | 0 |
| D | 0 | 18 | 0 |
| Mode SS | |||
|---|---|---|---|
| Quadrant | BADHDUFLAG | Total packets | Discarded packets |
| A | 0 | 126 | 0 |
| B | 0 | 126 | 0 |
| C | 0 | 126 | 0 |
| D | 0 | 126 | 0 |
| Mode M0 | |||
|---|---|---|---|
| Quadrant | BADHDUFLAG | Total packets | Discarded packets |
| A | 0 | 14362 | 3 |
| B | 0 | 13362 | 2 |
| C | 0 | 13018 | 2 |
| D | 0 | 15856 | 2 |
| Quadrant | Total seconds | Saturated seconds | Saturation percentage |
|---|---|---|---|
| A | 6225 | 144 | 2.313253% |
| B | 6225 | 114 | 1.831325% |
| C | 6225 | 85 | 1.365462% |
| D | 6225 | 237 | 3.807229% |
Noise dominated data is calculated using 1-second bins in cleaned event files. If a bin has >2000 counts, and if more than 50% of those come from <1% of pixels, then it is considered to be noise-dominated and hence unusable.
| Quadrant | # 1 sec bins | Bins with >0 counts | Bins with >2000 counts | High rate bins dominated by noise | Noise dominated (total time) | Noise dominated (detector-on time) | Marked lightcurve |
|---|---|---|---|---|---|---|---|
| A | 7415 | 6225 | 24 | 24 | 0.32% | 0.39% | 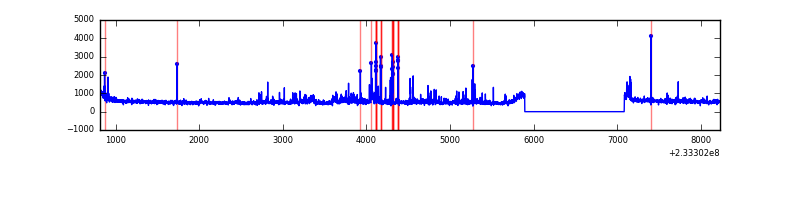 |
| B | 7415 | 6225 | 4 | 4 | 0.05% | 0.06% | 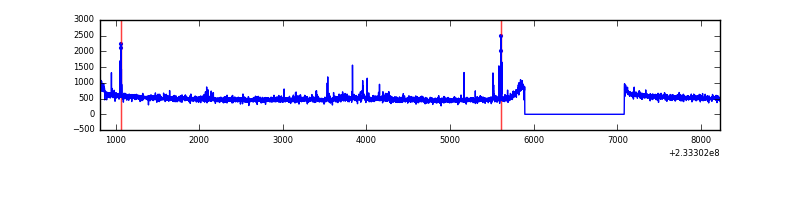 |
| C | 7415 | 6225 | 0 | 0 | 0.00% | 0.00% | 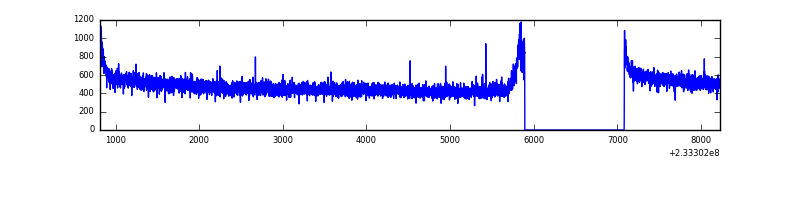 |
| D | 7415 | 6225 | 144 | 144 | 1.94% | 2.31% | 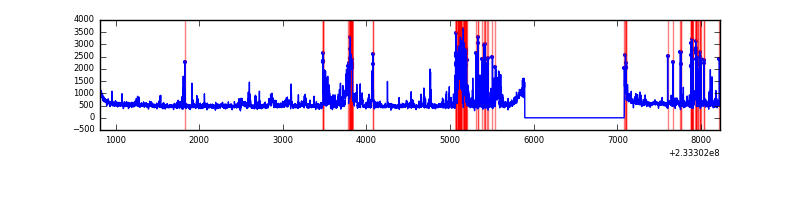 |
Top three noisy pixels from each quadrant. If the there are fewer than three noisy pixels in the level2.evt file, extra rows are filled as -1
| Pixel properties | Quadrant properties | ||||||
|---|---|---|---|---|---|---|---|
| Quadrant | DetID | PixID | Counts | Sigma | Mean | Median | Sigma |
| A | 8 | 5 | 416384 | 2614.33 | 790 | 773 | 159.0 |
| A | 5 | 16 | 65127 | 404.81 | 790 | 773 | 159.0 |
| A | 0 | 128 | 9493 | 54.85 | 790 | 773 | 159.0 |
| B | 0 | 219 | 61198 | 404.1 | 797 | 780 | 149.5 |
| B | 6 | 51 | 23159 | 149.68 | 797 | 780 | 149.5 |
| B | 0 | 197 | 17641 | 112.77 | 797 | 780 | 149.5 |
| C | 13 | 61 | 5917 | 29.07 | 773 | 777 | 176.8 |
| C | 12 | 4 | 4675 | 22.04 | 773 | 777 | 176.8 |
| C | 3 | 202 | 1991 | 6.87 | 773 | 777 | 176.8 |
| D | 1 | 52 | 315779 | 1636.26 | 763 | 744 | 192.5 |
| D | 13 | 29 | 188419 | 974.76 | 763 | 744 | 192.5 |
| D | 10 | 199 | 150597 | 778.32 | 763 | 744 | 192.5 |
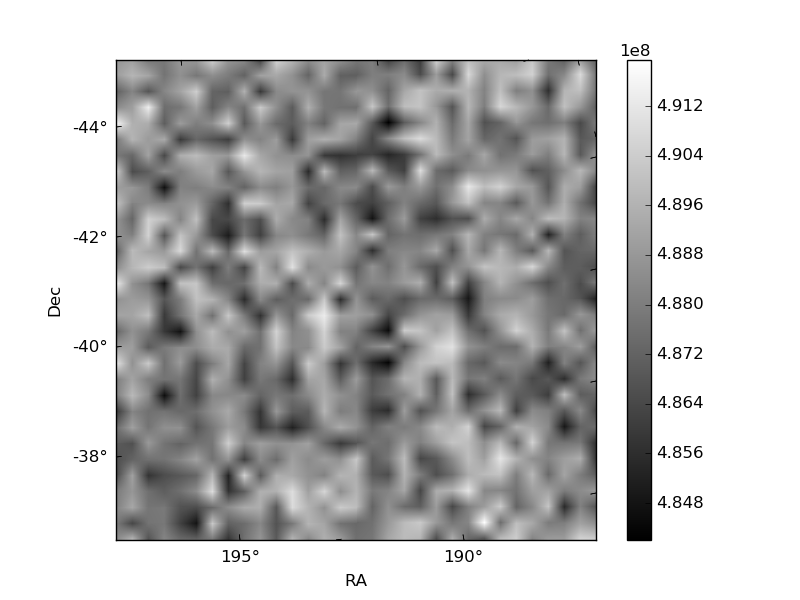
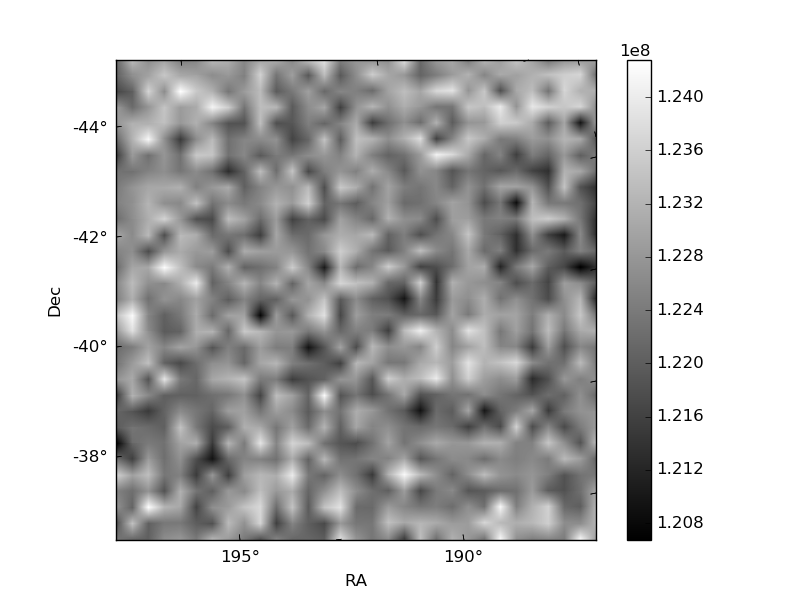
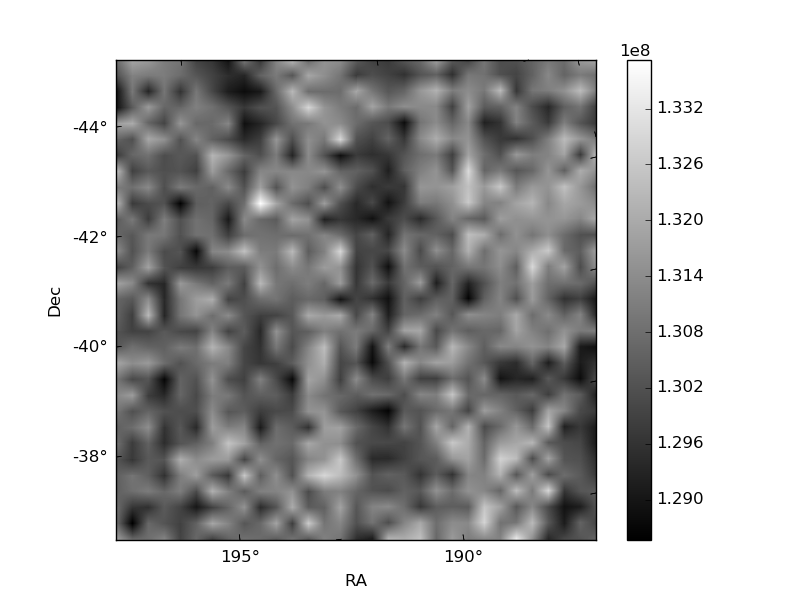
Histogram calculated using DETX and DETY for each event in the final _common_clean file
| Quadrant A | 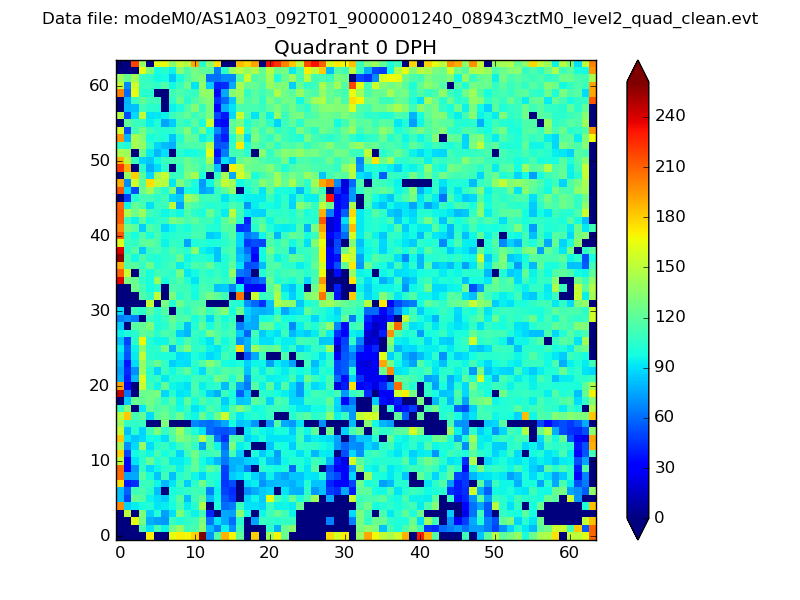 |
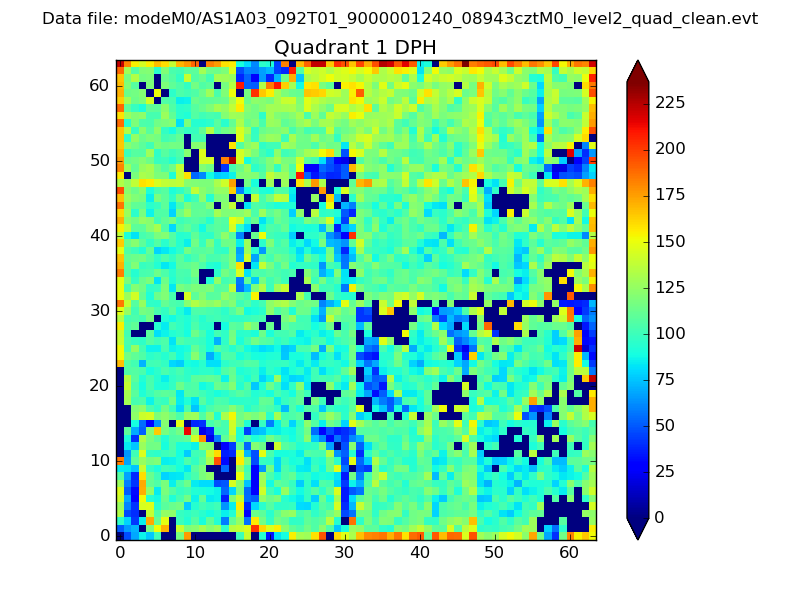 |
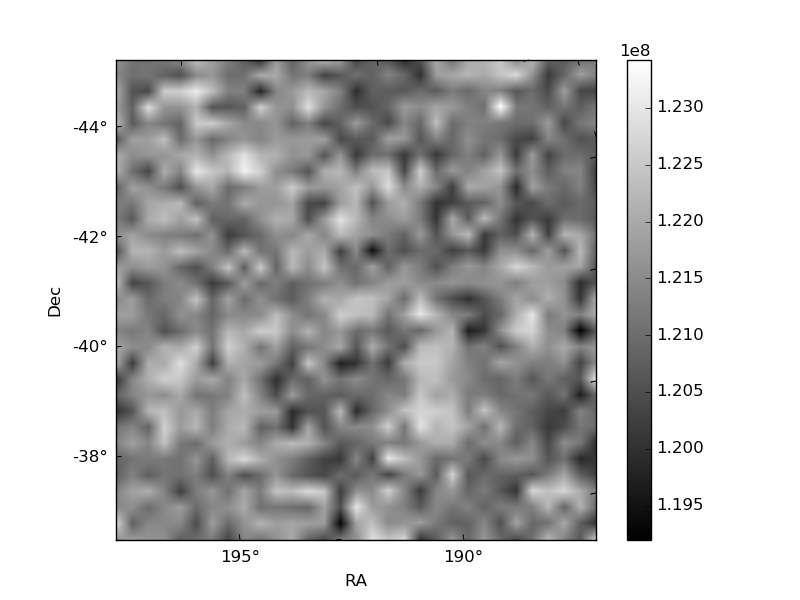
Quadrant B |
|---|---|---|---|
| Quadrant D | 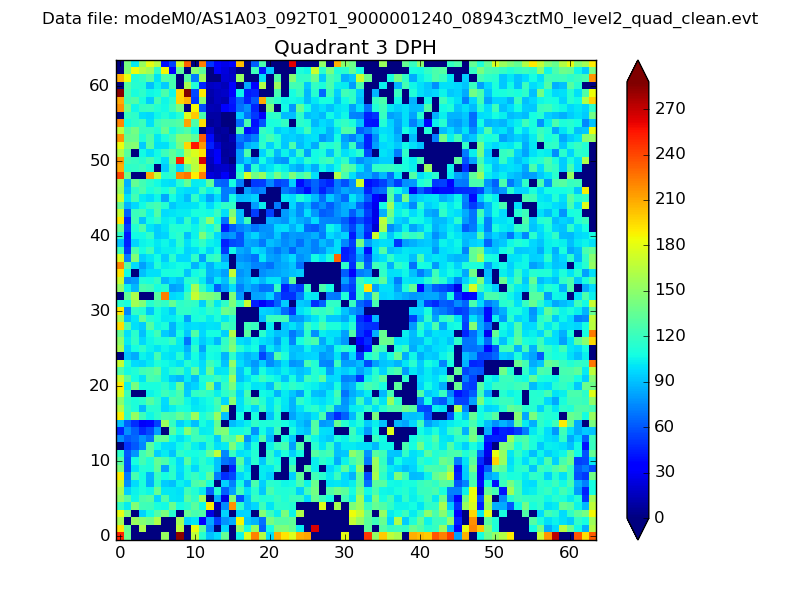 |
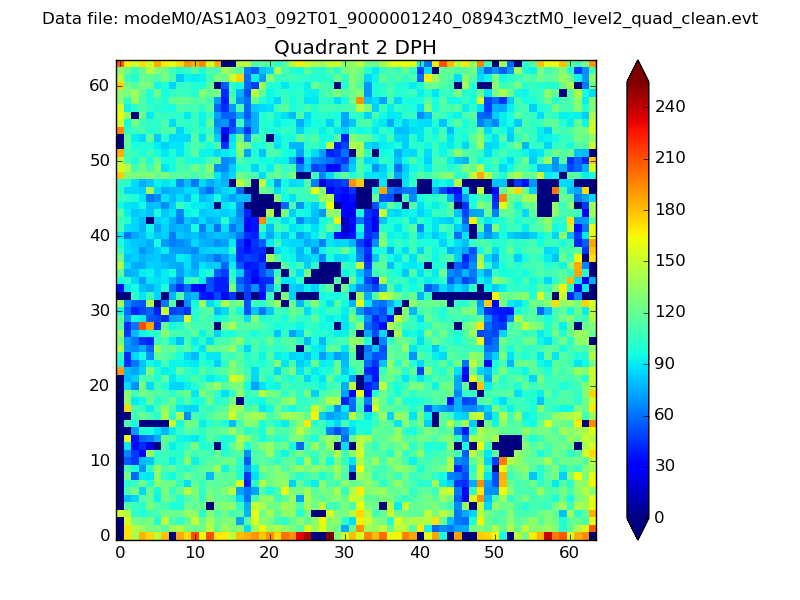 |
Quadrant C |
| Plot type | Count rate plots | Images |
|---|---|---|
| Comparison with Poisson distribution Blue bars denote a histogram of data divided into 1 sec bins. Red curve is a Poisson curve with rate = median count rate of data. |
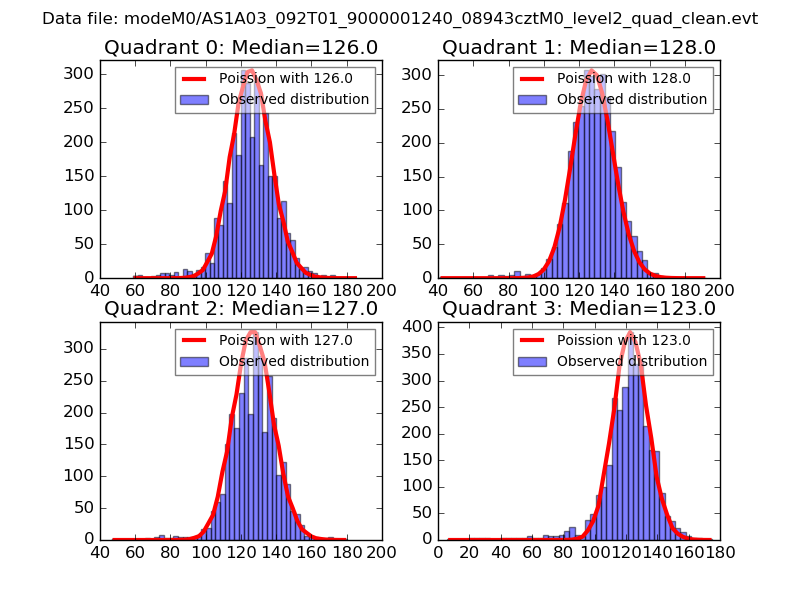 |
 |
| Quadrant-wise count rates Data is divided into 100 sec bins |
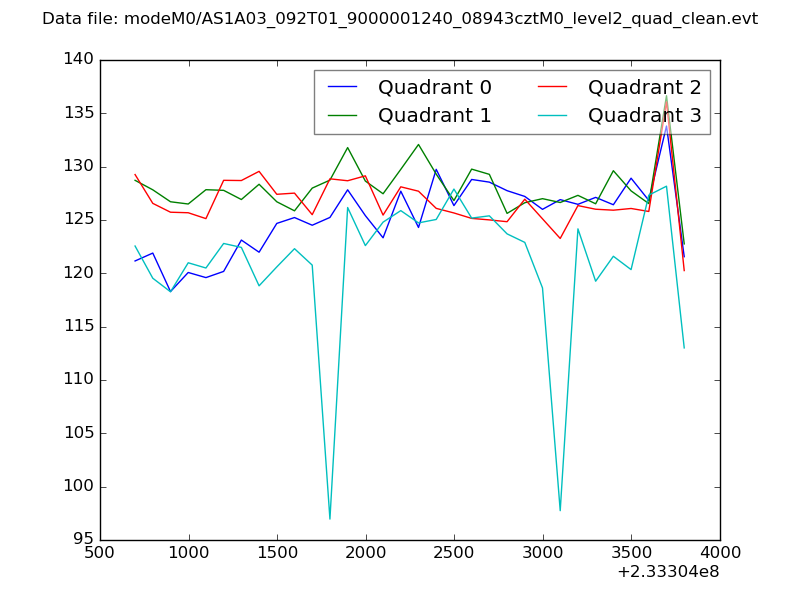 |
|
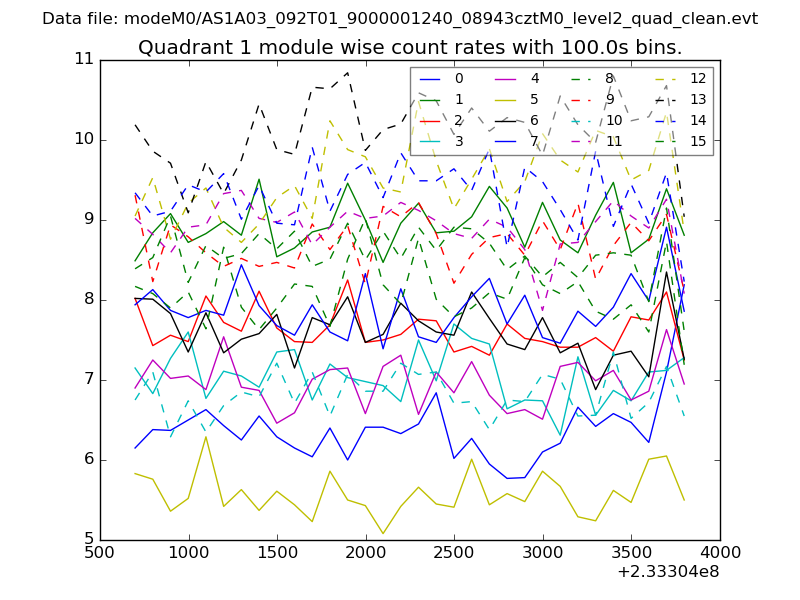
| Module-wise count rates for Quadrant A Data is divided into 100 sec bins |
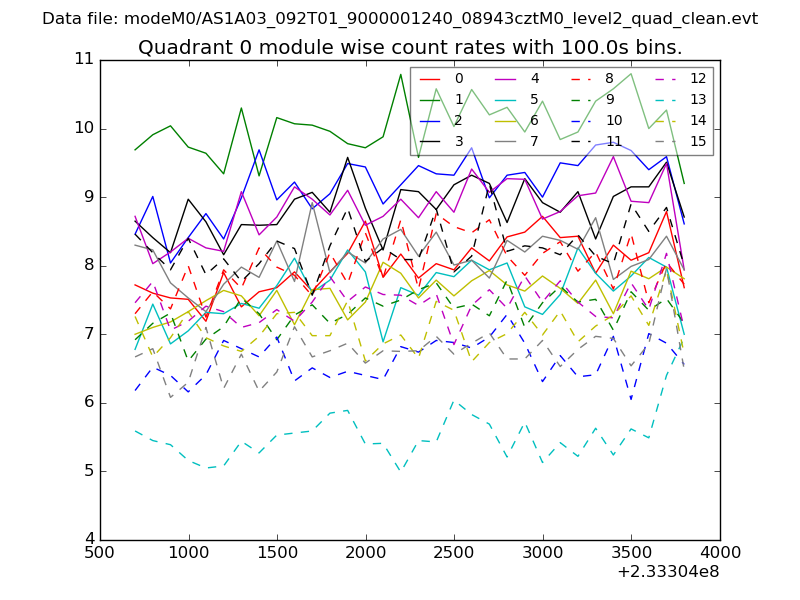 |
 |
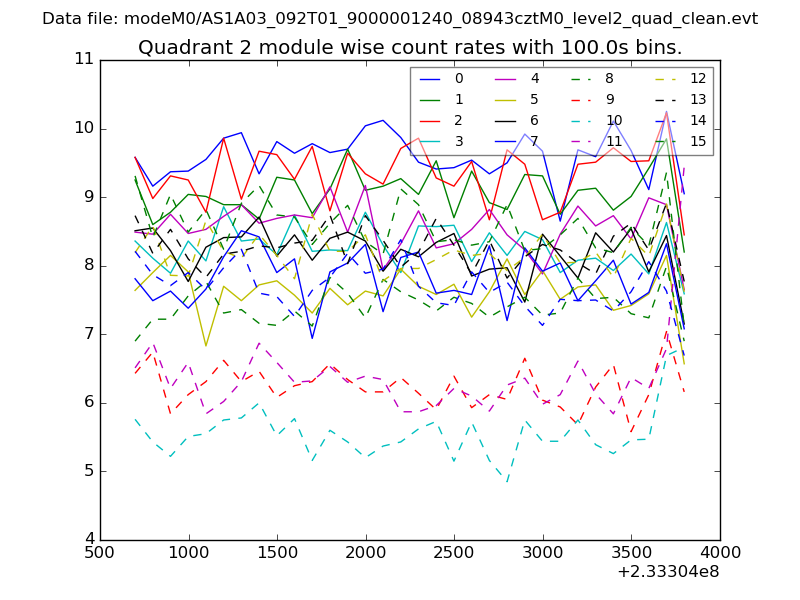
| Module-wise count rates for Quadrant B Data is divided into 100 sec bins |
 |
 |
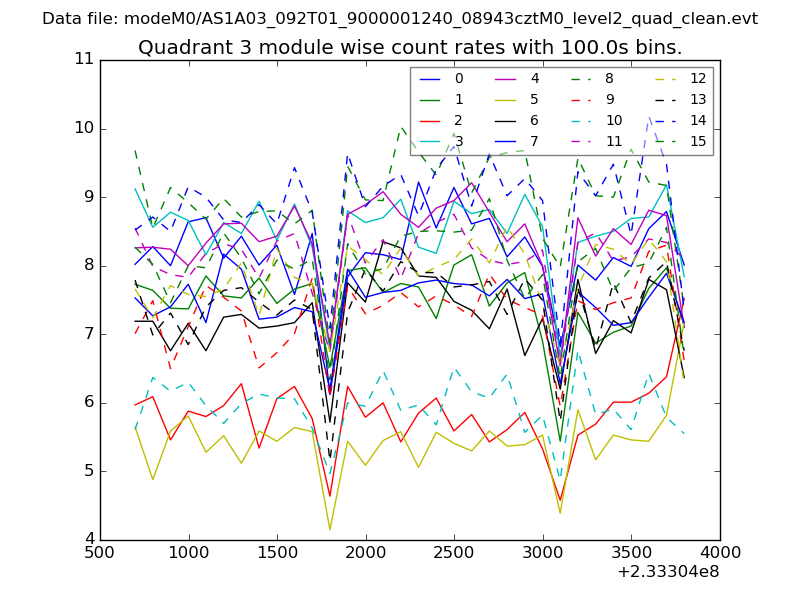
| Module-wise count rates for Quadrant C Data is divided into 100 sec bins |
 |
 |
| Module-wise count rates for Quadrant D Data is divided into 100 sec bins |
 |
 |
| Parameter | Plot |
|---|---|
| CZT HV Monitor | 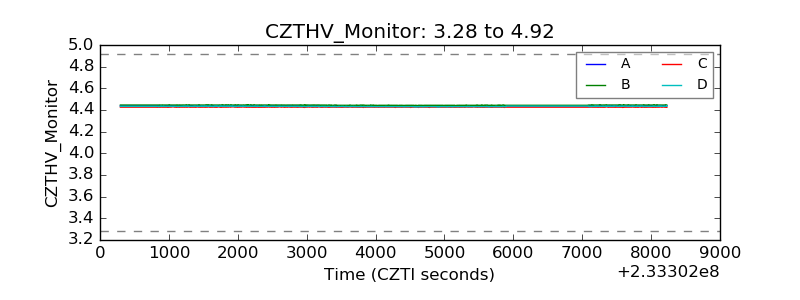 |
| D_VDD | 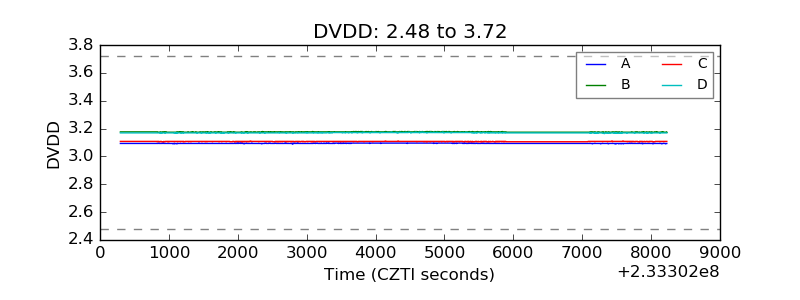 |
| Temperature 1 | 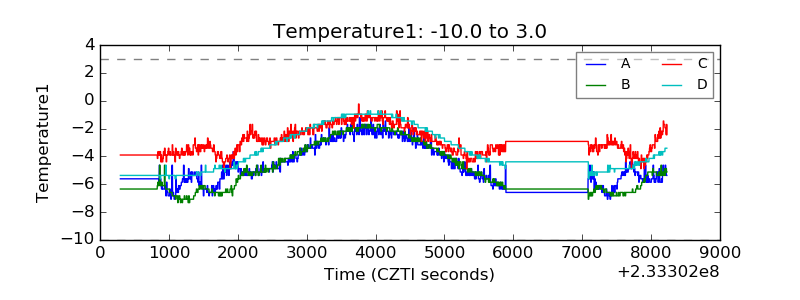 |
| Veto HV Monitor |  |
| Veto LLD | 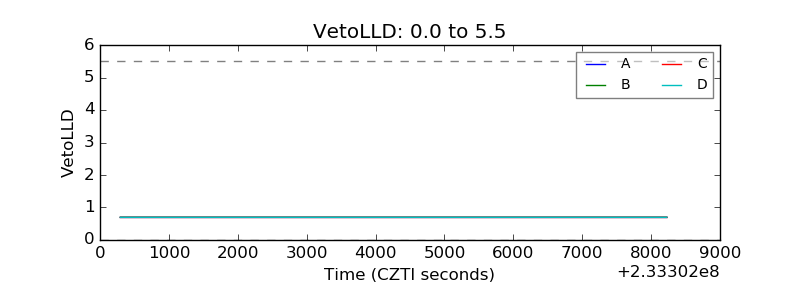 |
| Alpha Counter | 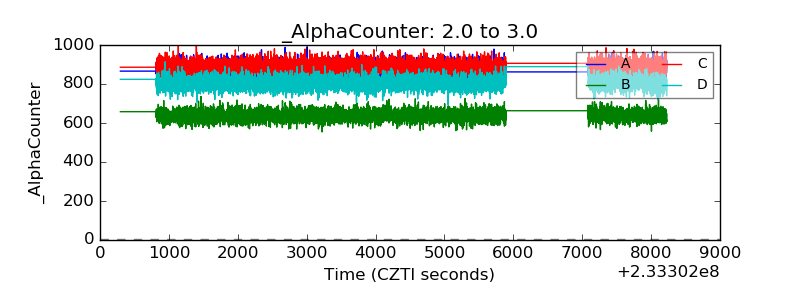 |
| _CPM_Rate | 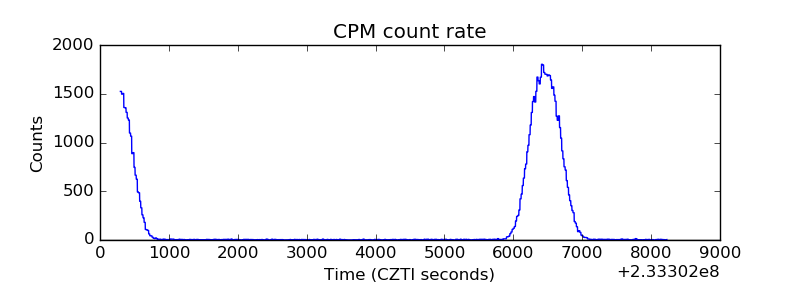 |
| CZT Counter | 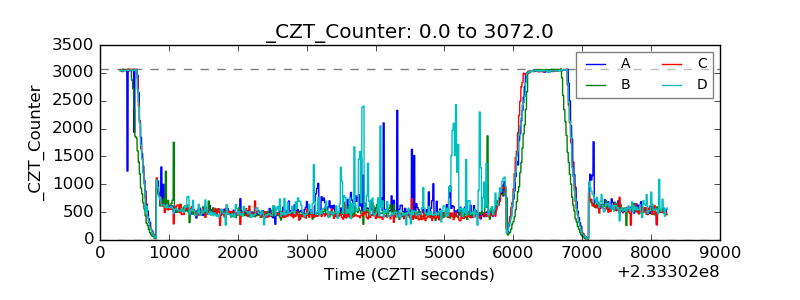 |
| +2.5 Volts monitor | 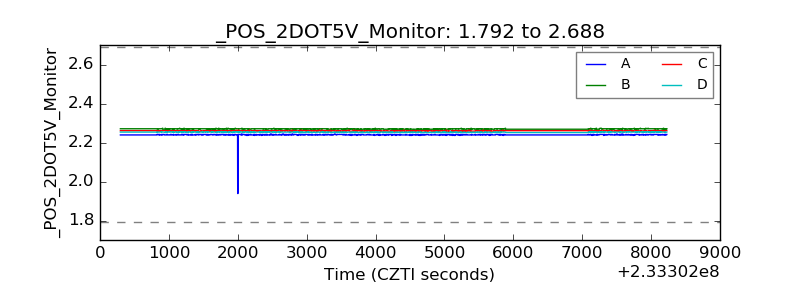 |
| +5 Volts monitor |  |
| _ROLL_ROT | 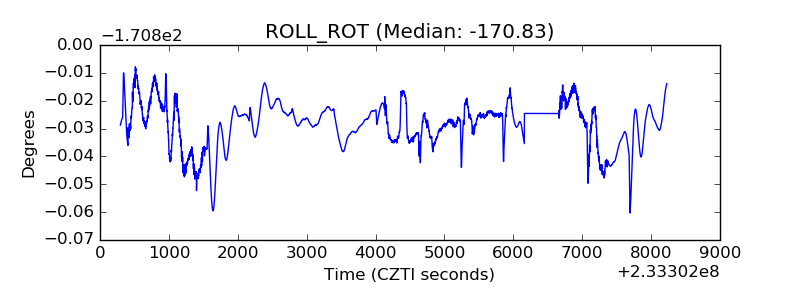 |
| _Roll_DEC | 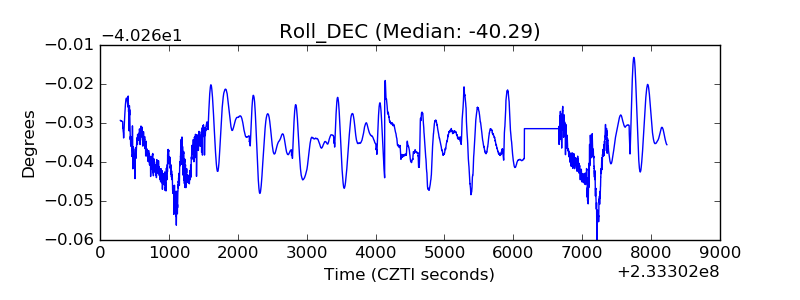 |
| _Roll_RA | 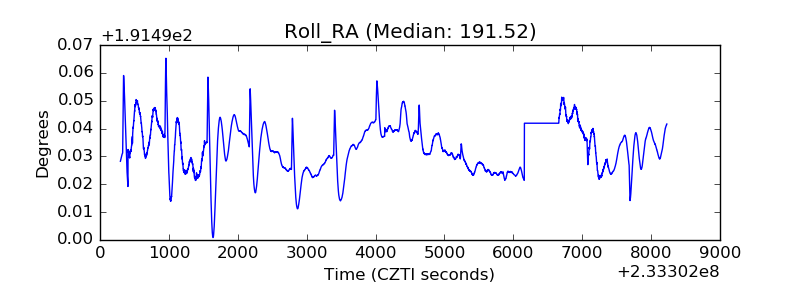 |
| Veto Counter | 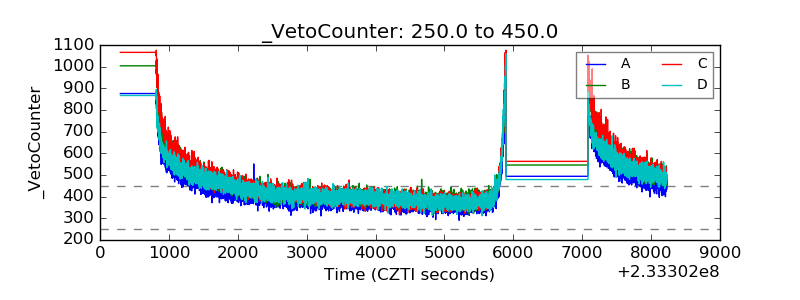 |