| Param | Original file | Final file |
|---|---|---|
| Filename | modeM0/AS1A03_092T01_9000001240_08944cztM0_level2.evt | modeM0/AS1A03_092T01_9000001240_08944cztM0_level2_quad_clean.evt |
| Size (bytes) | 490,086,720 | 80,847,360 |
| Size | 467.4 MB | 77.1 MB |
| Events in quadrant A | 3,537,666 | 504,487 |
| Events in quadrant B | 3,280,376 | 511,174 |
| Events in quadrant C | 3,135,450 | 505,629 |
| Events in quadrant D | 4,459,444 | 485,446 |
| Mode M9 | |||
|---|---|---|---|
| Quadrant | BADHDUFLAG | Total packets | Discarded packets |
| A | 0 | 16 | 0 |
| B | 0 | 16 | 0 |
| C | 0 | 16 | 0 |
| D | 0 | 17 | 0 |
| Mode SS | |||
|---|---|---|---|
| Quadrant | BADHDUFLAG | Total packets | Discarded packets |
| A | 0 | 128 | 0 |
| B | 0 | 128 | 0 |
| C | 0 | 128 | 0 |
| D | 0 | 128 | 0 |
| Mode M0 | |||
|---|---|---|---|
| Quadrant | BADHDUFLAG | Total packets | Discarded packets |
| A | 0 | 14457 | 3 |
| B | 0 | 13516 | 2 |
| C | 0 | 13285 | 2 |
| D | 0 | 17302 | 2 |
| Quadrant | Total seconds | Saturated seconds | Saturation percentage |
|---|---|---|---|
| A | 6327 | 126 | 1.991465% |
| B | 6327 | 112 | 1.770191% |
| C | 6327 | 88 | 1.390865% |
| D | 6327 | 336 | 5.310574% |
Noise dominated data is calculated using 1-second bins in cleaned event files. If a bin has >2000 counts, and if more than 50% of those come from <1% of pixels, then it is considered to be noise-dominated and hence unusable.
| Quadrant | # 1 sec bins | Bins with >0 counts | Bins with >2000 counts | High rate bins dominated by noise | Noise dominated (total time) | Noise dominated (detector-on time) | Marked lightcurve |
|---|---|---|---|---|---|---|---|
| A | 7567 | 6327 | 15 | 15 | 0.20% | 0.24% | 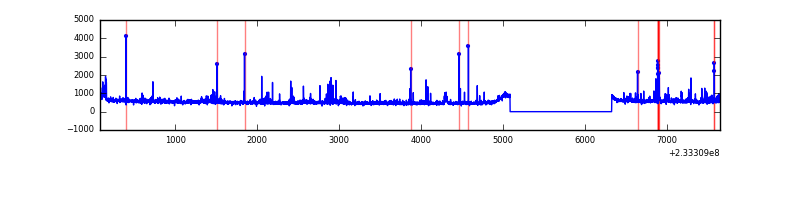 |
| B | 7567 | 6327 | 1 | 1 | 0.01% | 0.02% | 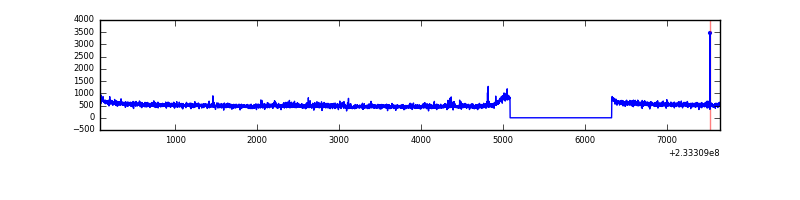 |
| C | 7567 | 6327 | 0 | 0 | 0.00% | 0.00% | 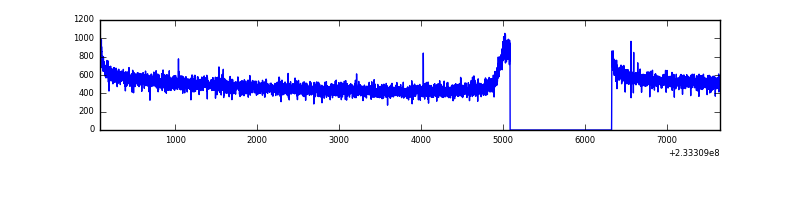 |
| D | 7567 | 6327 | 200 | 200 | 2.64% | 3.16% | 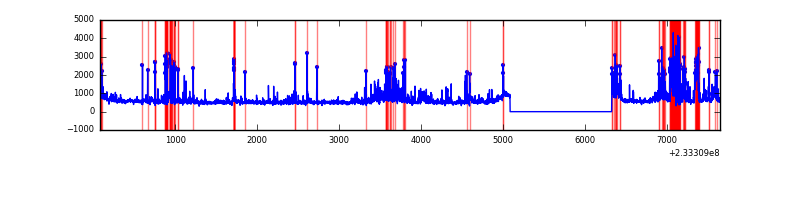 |
Top three noisy pixels from each quadrant. If the there are fewer than three noisy pixels in the level2.evt file, extra rows are filled as -1
| Pixel properties | Quadrant properties | ||||||
|---|---|---|---|---|---|---|---|
| Quadrant | DetID | PixID | Counts | Sigma | Mean | Median | Sigma |
| A | 8 | 5 | 259778 | 1572.18 | 824 | 808 | 164.7 |
| A | 5 | 16 | 54121 | 323.66 | 824 | 808 | 164.7 |
| A | 13 | 251 | 15199 | 87.37 | 824 | 808 | 164.7 |
| B | 6 | 51 | 31342 | 198.17 | 826 | 809 | 154.1 |
| B | 0 | 219 | 23595 | 147.89 | 826 | 809 | 154.1 |
| B | 12 | 111 | 15843 | 97.57 | 826 | 809 | 154.1 |
| C | 13 | 61 | 6132 | 29.23 | 803 | 807 | 182.2 |
| C | 12 | 4 | 3267 | 13.51 | 803 | 807 | 182.2 |
| C | 3 | 202 | 2095 | 7.07 | 803 | 807 | 182.2 |
| D | 12 | 233 | 567688 | 2920.81 | 789 | 771 | 194.1 |
| D | 13 | 29 | 219596 | 1127.41 | 789 | 771 | 194.1 |
| D | 1 | 52 | 210706 | 1081.6 | 789 | 771 | 194.1 |
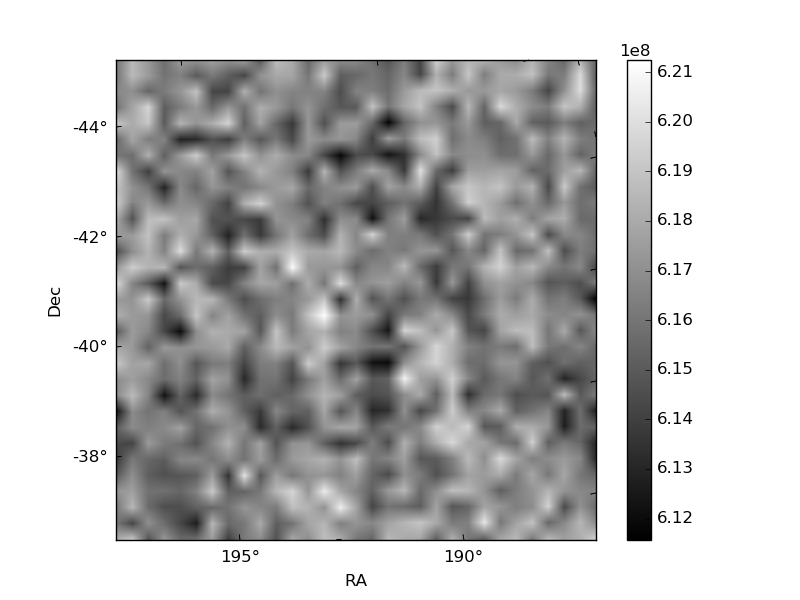
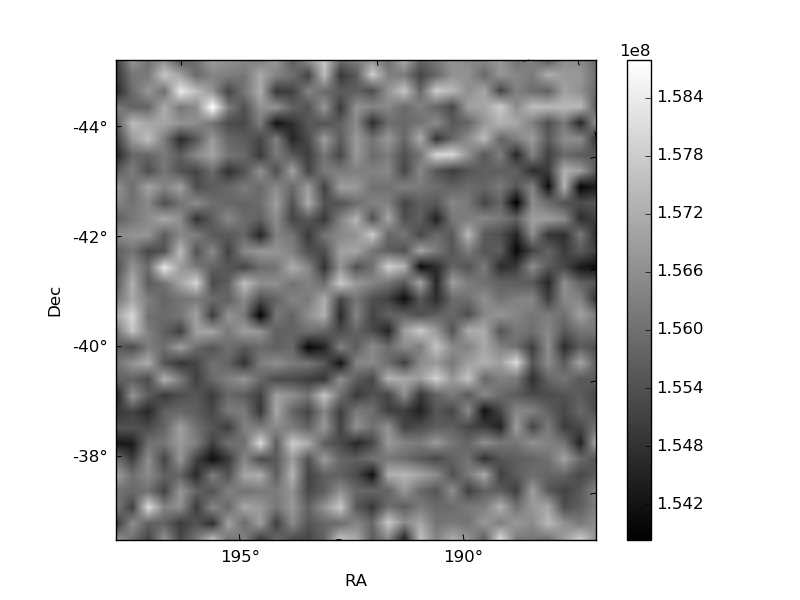
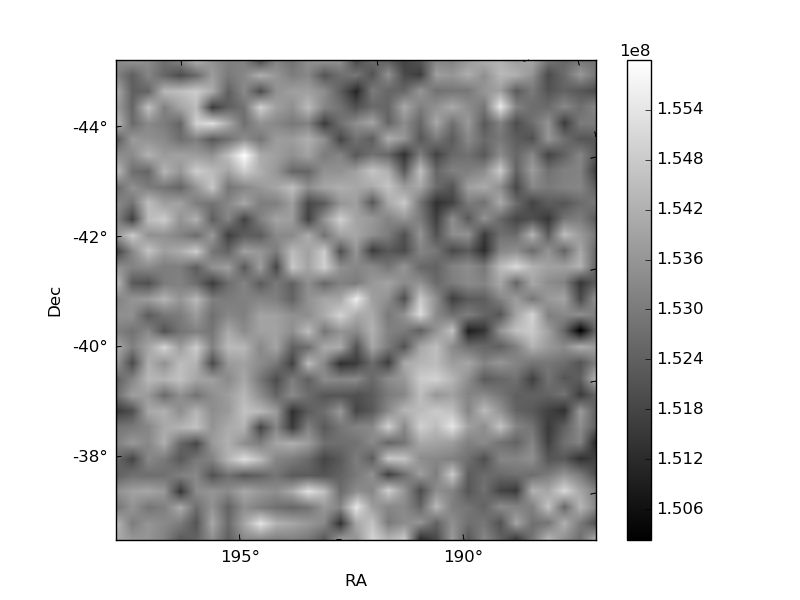
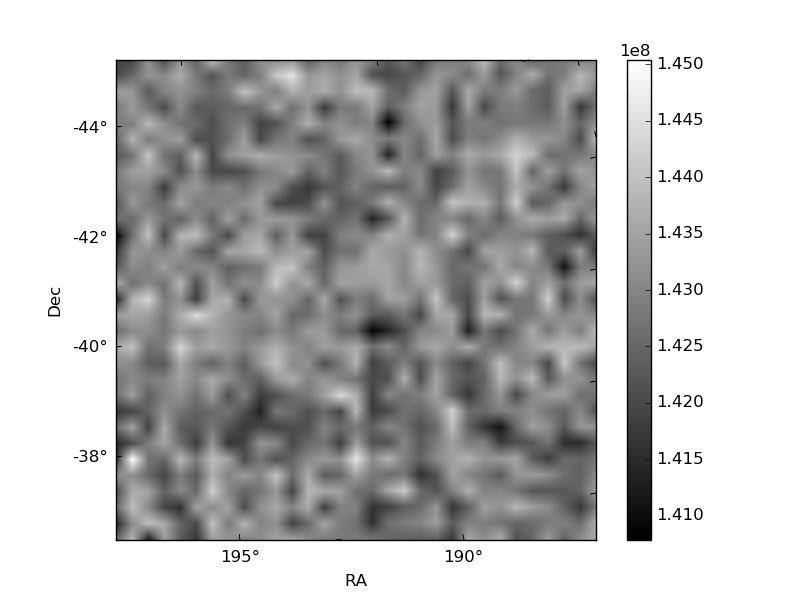
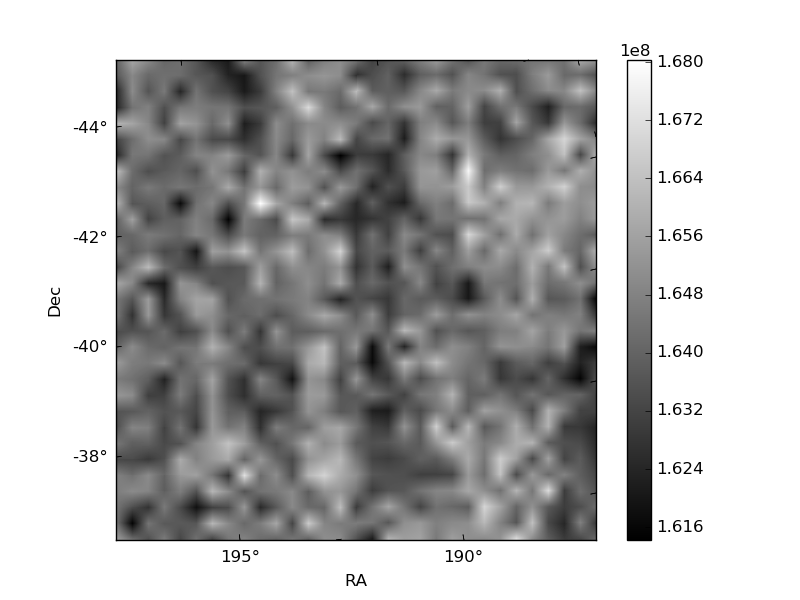
Histogram calculated using DETX and DETY for each event in the final _common_clean file
| Quadrant A | 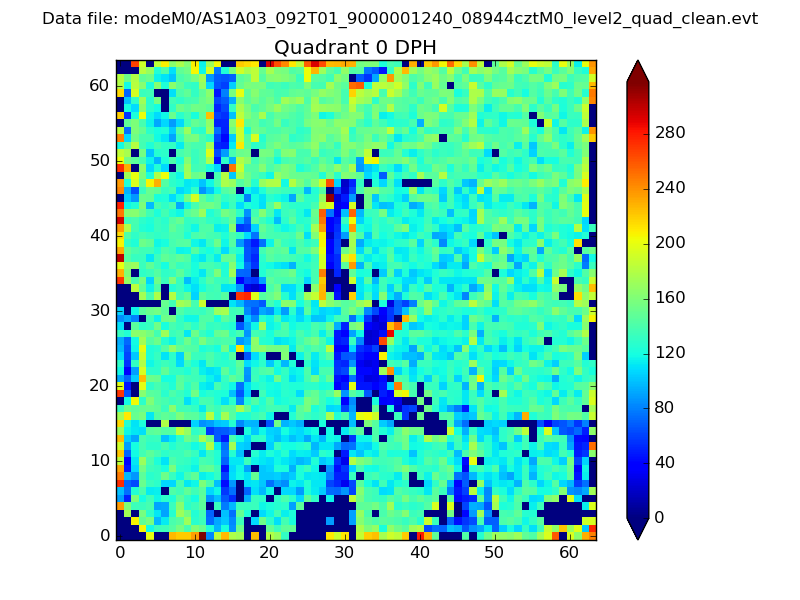 |
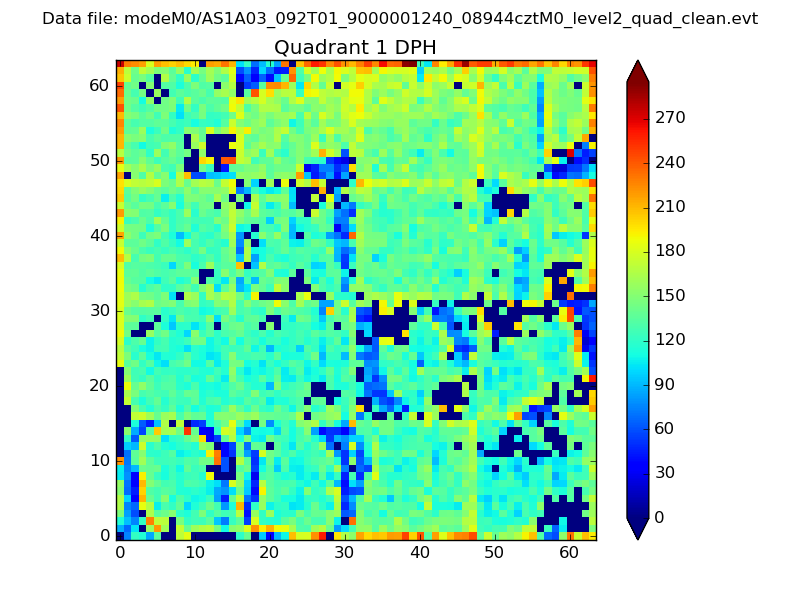 |
Quadrant B |
|---|---|---|---|
| Quadrant D | 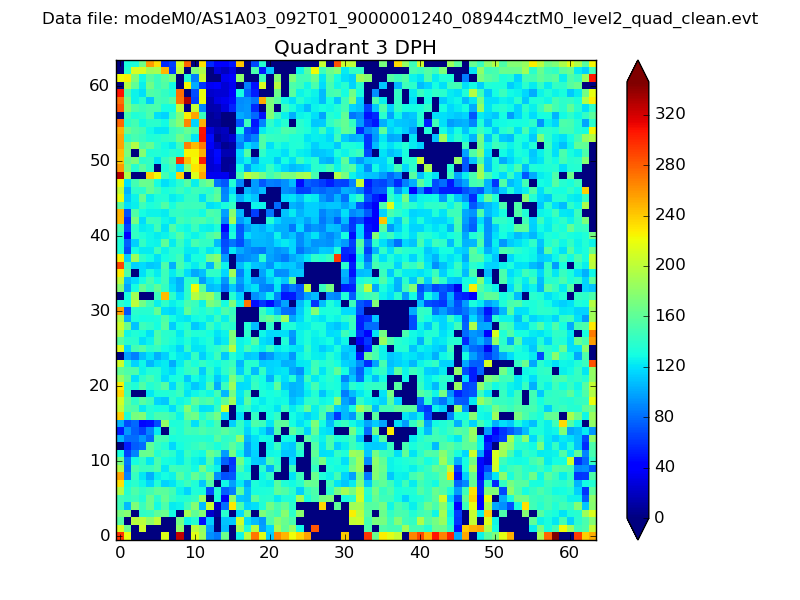 |
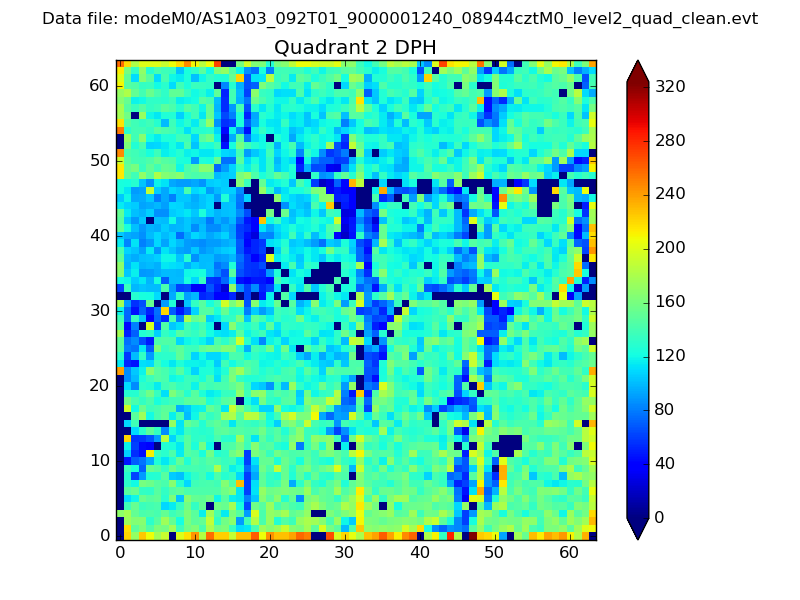 |
Quadrant C |
| Plot type | Count rate plots | Images |
|---|---|---|
| Comparison with Poisson distribution Blue bars denote a histogram of data divided into 1 sec bins. Red curve is a Poisson curve with rate = median count rate of data. |
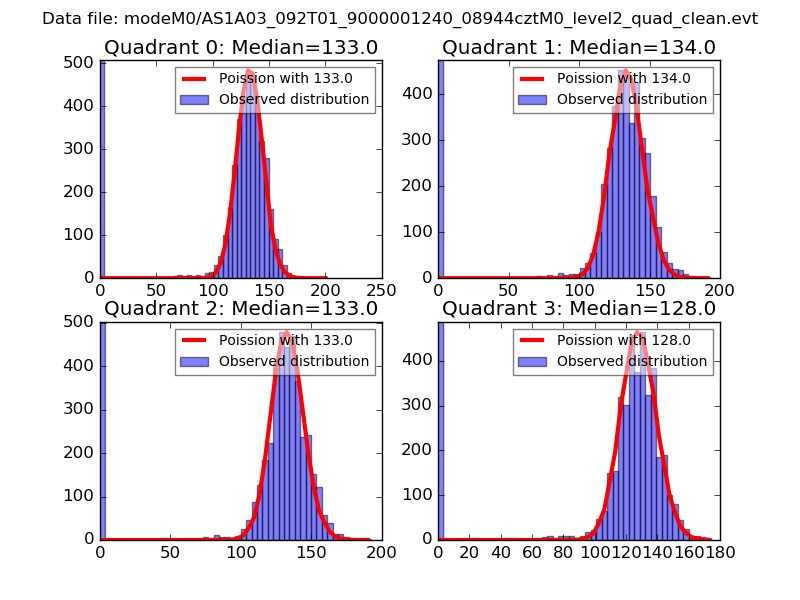 |
 |
| Quadrant-wise count rates Data is divided into 100 sec bins |
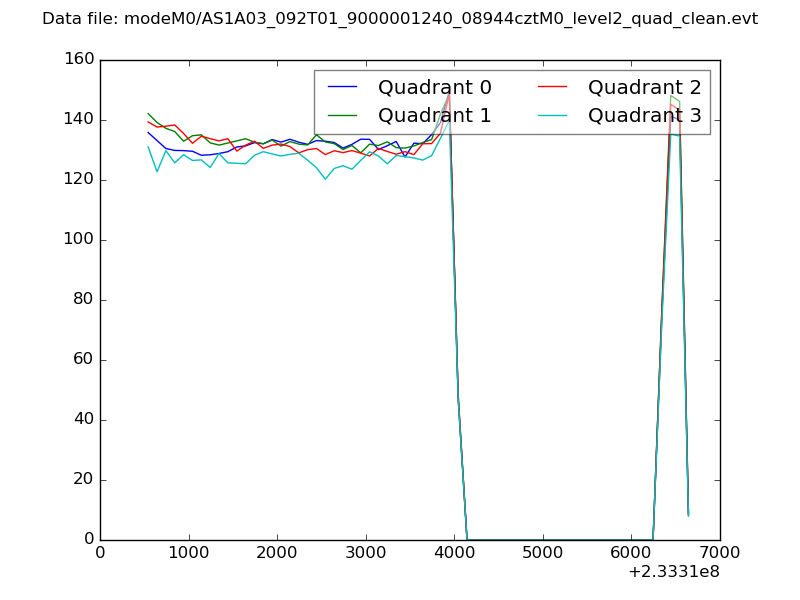 |
|
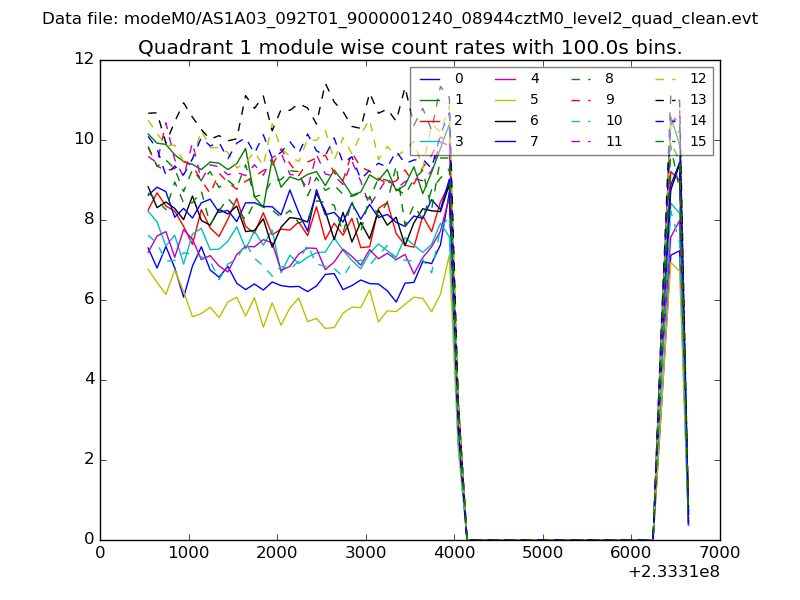
| Module-wise count rates for Quadrant A Data is divided into 100 sec bins |
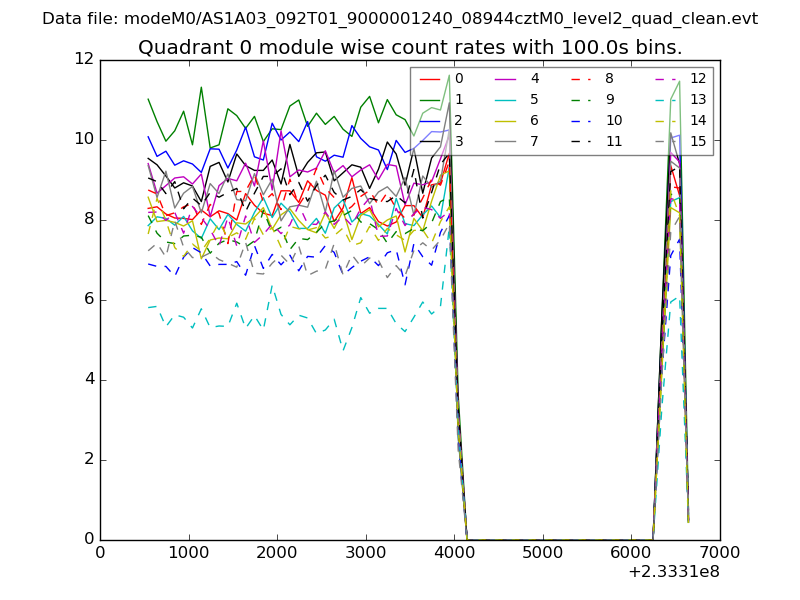 |
 |
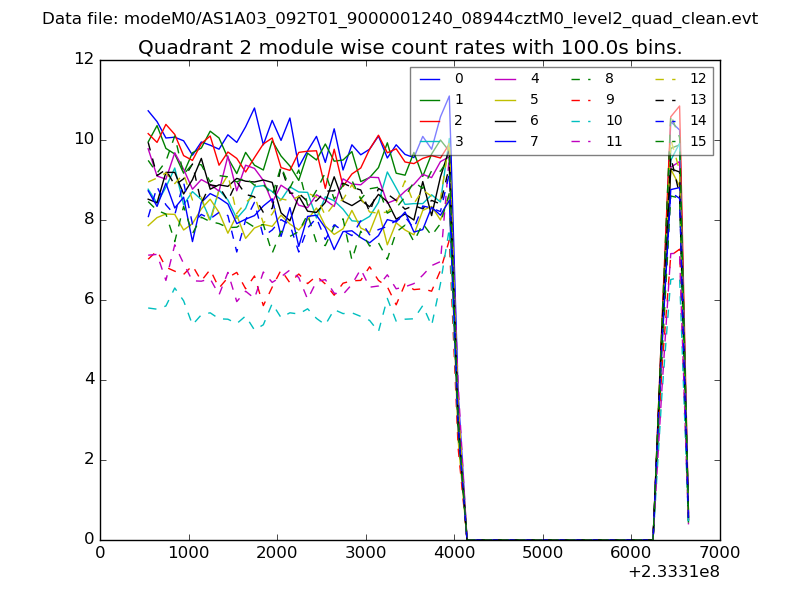
| Module-wise count rates for Quadrant B Data is divided into 100 sec bins |
 |
 |
| Module-wise count rates for Quadrant C Data is divided into 100 sec bins |
 |
 |
| Module-wise count rates for Quadrant D Data is divided into 100 sec bins |
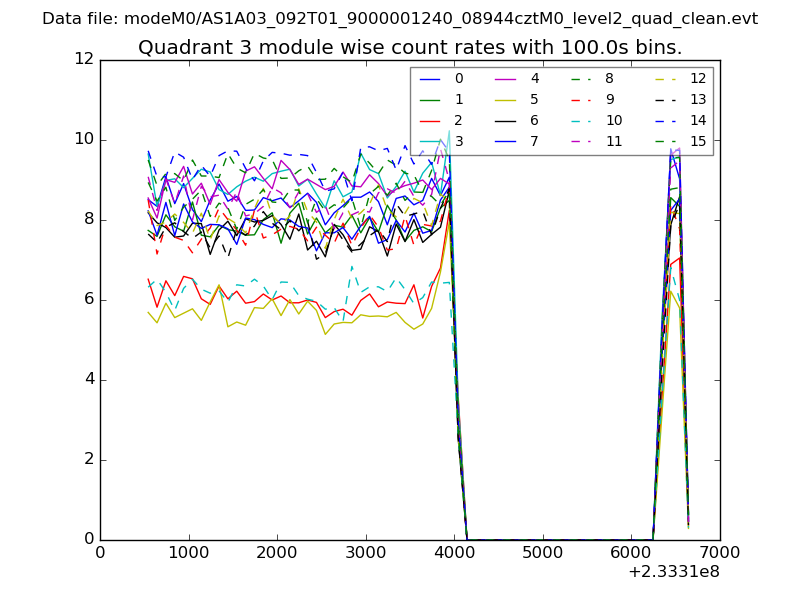 |
 |
| Parameter | Plot |
|---|---|
| CZT HV Monitor |  |
| D_VDD |  |
| Temperature 1 | 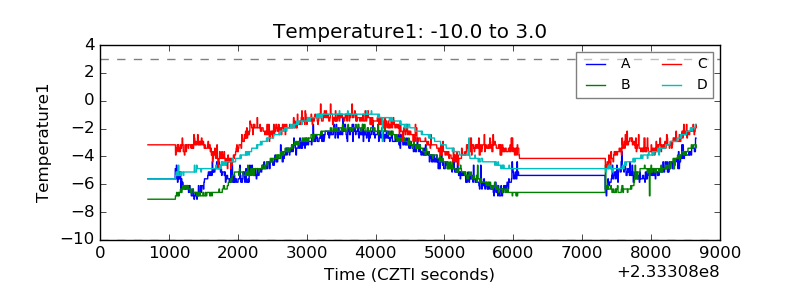 |
| Veto HV Monitor | 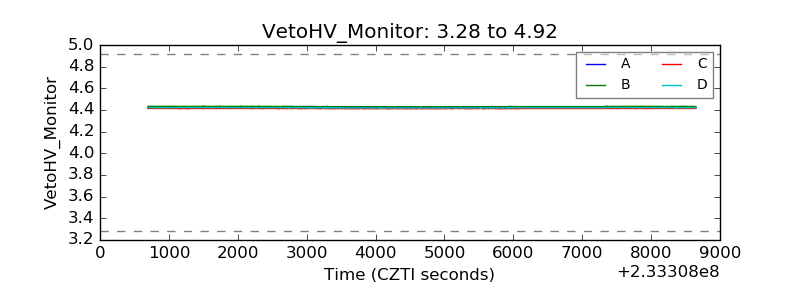 |
| Veto LLD | 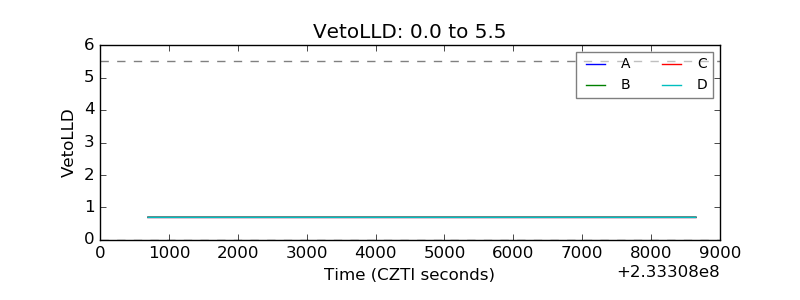 |
| Alpha Counter | 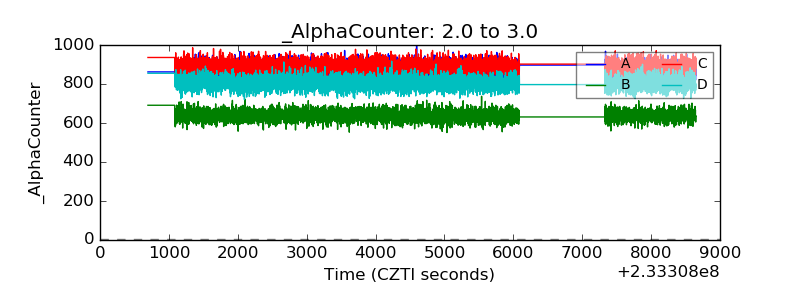 |
| _CPM_Rate | 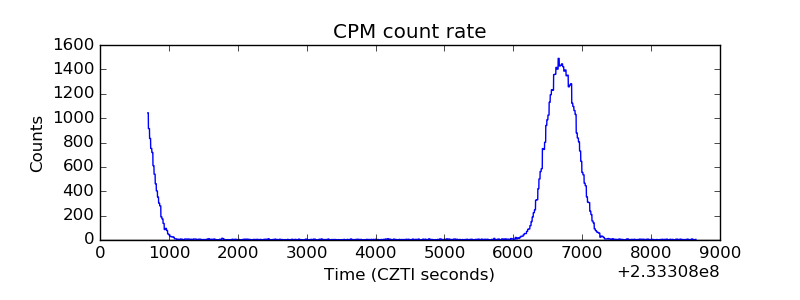 |
| CZT Counter | 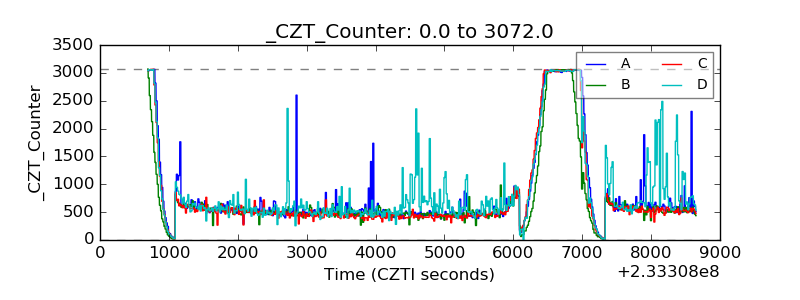 |
| +2.5 Volts monitor |  |
| +5 Volts monitor |  |
| _ROLL_ROT | 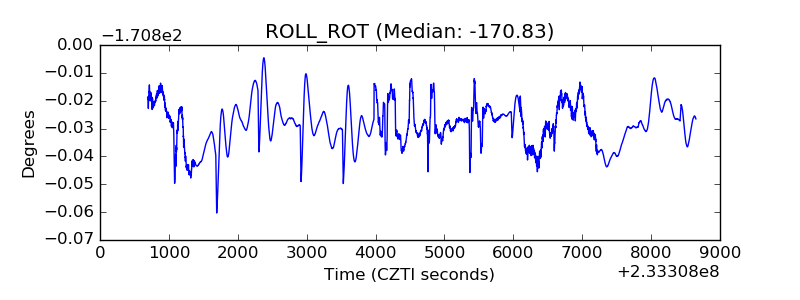 |
| _Roll_DEC | 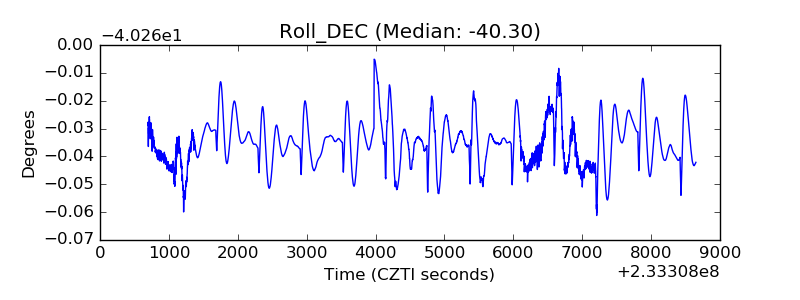 |
| _Roll_RA |  |
| Veto Counter | 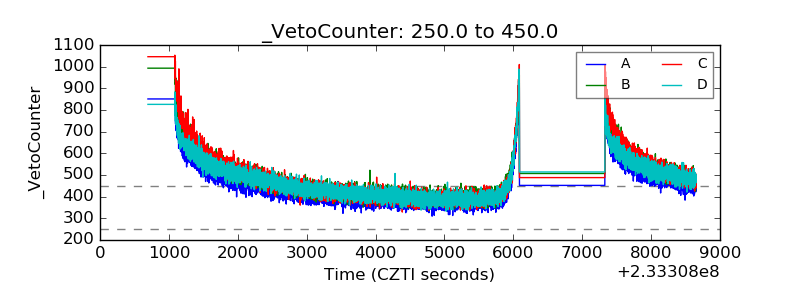 |