| Param | Original file | Final file |
|---|---|---|
| Filename | modeM0/AS1A03_092T01_9000001240_08945cztM0_level2.evt | modeM0/AS1A03_092T01_9000001240_08945cztM0_level2_quad_clean.evt |
| Size (bytes) | 511,488,000 | 98,262,720 |
| Size | 487.8 MB | 93.7 MB |
| Events in quadrant A | 3,841,016 | 635,127 |
| Events in quadrant B | 3,570,914 | 642,269 |
| Events in quadrant C | 3,253,424 | 630,434 |
| Events in quadrant D | 4,381,657 | 612,379 |
| Mode M9 | |||
|---|---|---|---|
| Quadrant | BADHDUFLAG | Total packets | Discarded packets |
| A | 0 | 25 | 0 |
| B | 0 | 25 | 0 |
| C | 0 | 25 | 0 |
| D | 0 | 25 | 0 |
| Mode SS | |||
|---|---|---|---|
| Quadrant | BADHDUFLAG | Total packets | Discarded packets |
| A | 0 | 134 | 0 |
| B | 0 | 134 | 0 |
| C | 0 | 134 | 0 |
| D | 0 | 134 | 0 |
| Mode M0 | |||
|---|---|---|---|
| Quadrant | BADHDUFLAG | Total packets | Discarded packets |
| A | 0 | 15470 | 3 |
| B | 0 | 14539 | 2 |
| C | 0 | 13825 | 2 |
| D | 0 | 17056 | 2 |
| Quadrant | Total seconds | Saturated seconds | Saturation percentage |
|---|---|---|---|
| A | 6537 | 223 | 3.411351% |
| B | 6537 | 214 | 3.273673% |
| C | 6537 | 162 | 2.478201% |
| D | 6537 | 363 | 5.553006% |
Noise dominated data is calculated using 1-second bins in cleaned event files. If a bin has >2000 counts, and if more than 50% of those come from <1% of pixels, then it is considered to be noise-dominated and hence unusable.
| Quadrant | # 1 sec bins | Bins with >0 counts | Bins with >2000 counts | High rate bins dominated by noise | Noise dominated (total time) | Noise dominated (detector-on time) | Marked lightcurve |
|---|---|---|---|---|---|---|---|
| A | 9037 | 6537 | 34 | 34 | 0.38% | 0.52% | 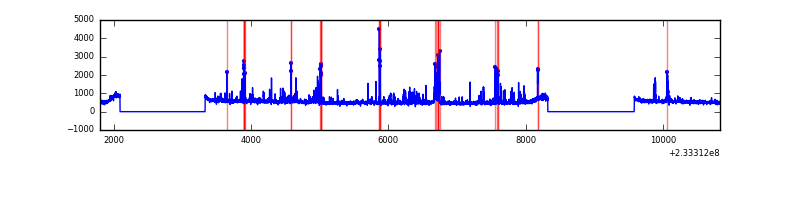 |
| B | 9037 | 6537 | 8 | 8 | 0.09% | 0.12% |  |
| C | 9037 | 6537 | 0 | 0 | 0.00% | 0.00% | 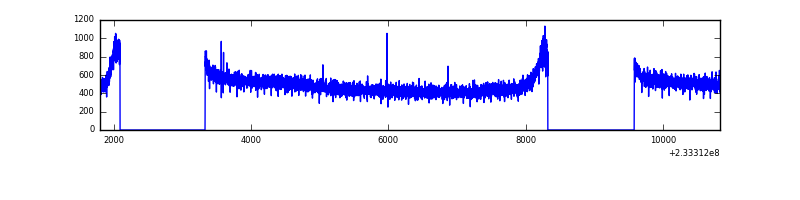 |
| D | 9037 | 6537 | 137 | 137 | 1.52% | 2.10% | 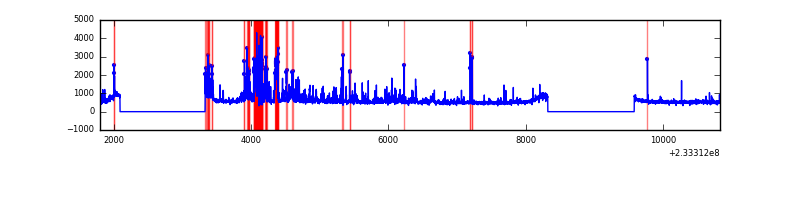 |
Top three noisy pixels from each quadrant. If the there are fewer than three noisy pixels in the level2.evt file, extra rows are filled as -1
| Pixel properties | Quadrant properties | ||||||
|---|---|---|---|---|---|---|---|
| Quadrant | DetID | PixID | Counts | Sigma | Mean | Median | Sigma |
| A | 8 | 5 | 358707 | 2069.61 | 860 | 843 | 172.9 |
| A | 5 | 16 | 64882 | 370.35 | 860 | 843 | 172.9 |
| A | 15 | 174 | 39626 | 224.29 | 860 | 843 | 172.9 |
| B | 12 | 32 | 134390 | 831.07 | 857 | 840 | 160.7 |
| B | 0 | 219 | 35558 | 216.05 | 857 | 840 | 160.7 |
| B | 6 | 51 | 21896 | 131.03 | 857 | 840 | 160.7 |
| C | 13 | 61 | 6330 | 28.97 | 833 | 838 | 189.6 |
| C | 12 | 4 | 2399 | 8.23 | 833 | 838 | 189.6 |
| C | 3 | 202 | 2084 | 6.57 | 833 | 838 | 189.6 |
| D | 12 | 233 | 567916 | 2692.04 | 828 | 805 | 210.7 |
| D | 8 | 195 | 278470 | 1318.06 | 828 | 805 | 210.7 |
| D | 1 | 52 | 174973 | 826.76 | 828 | 805 | 210.7 |
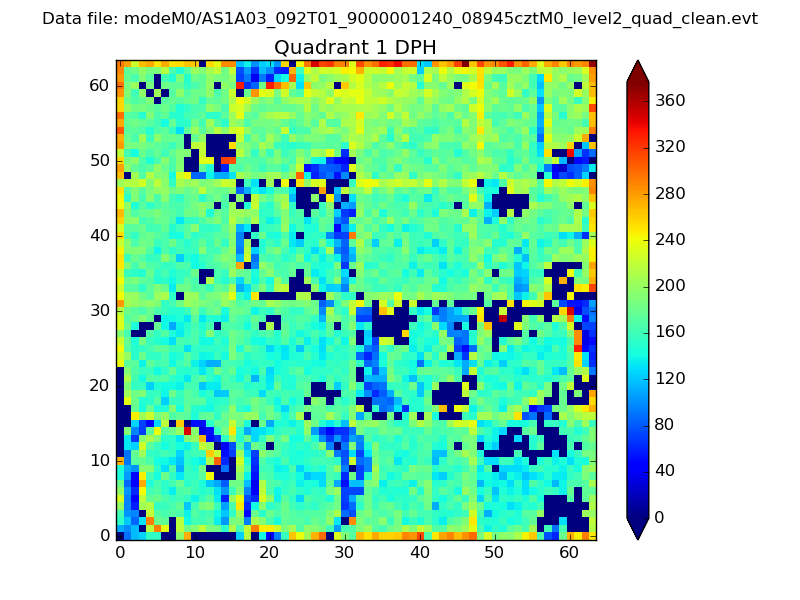
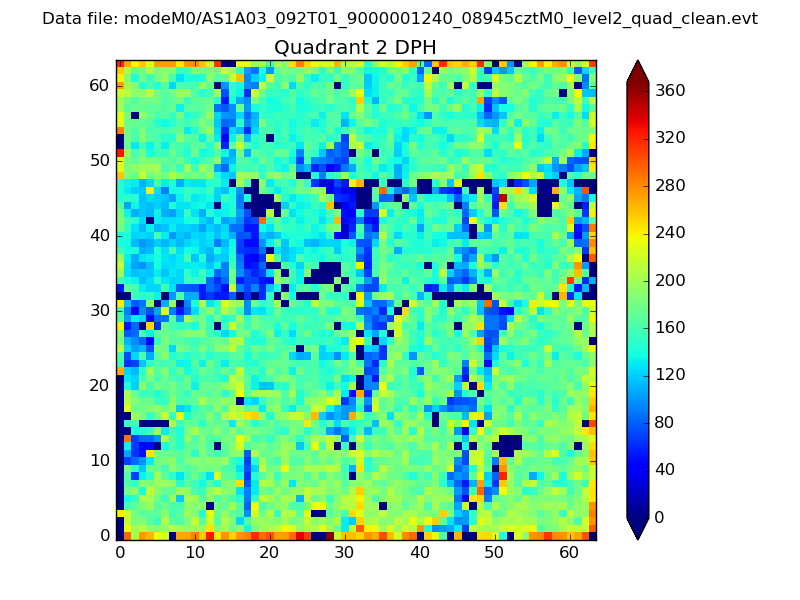
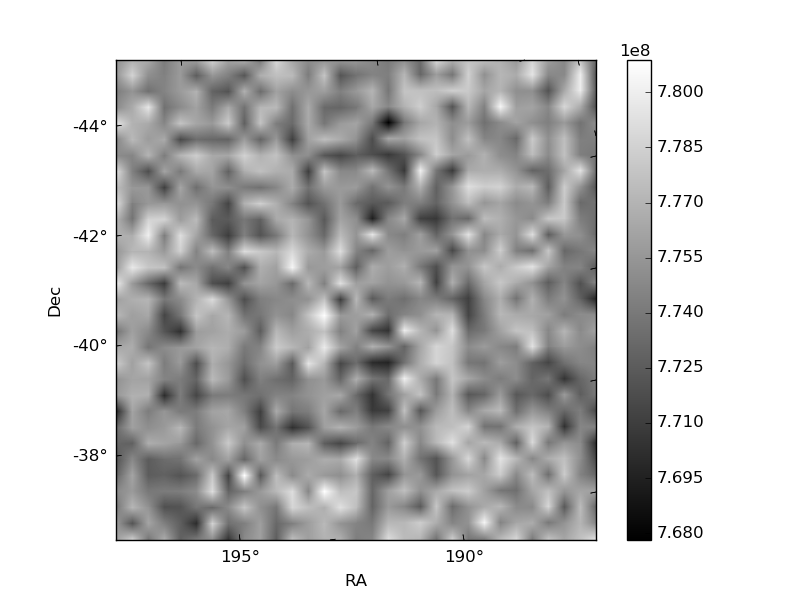
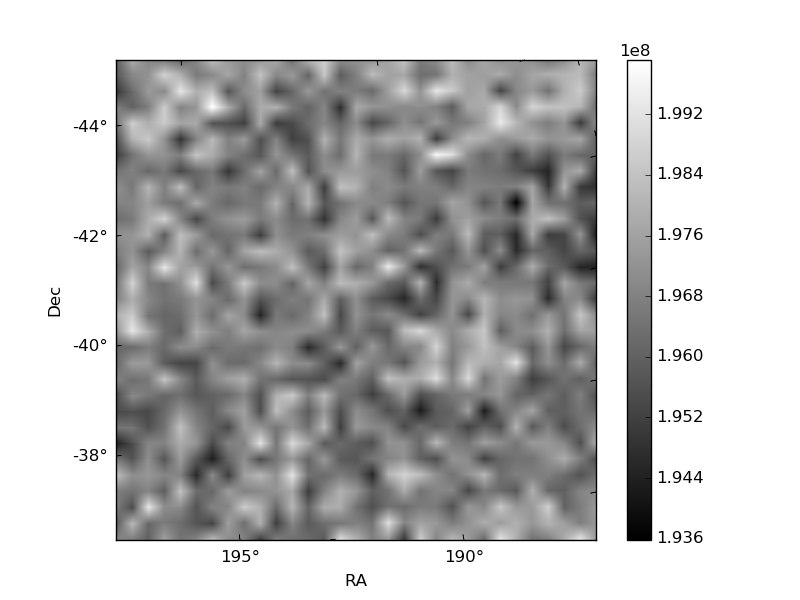
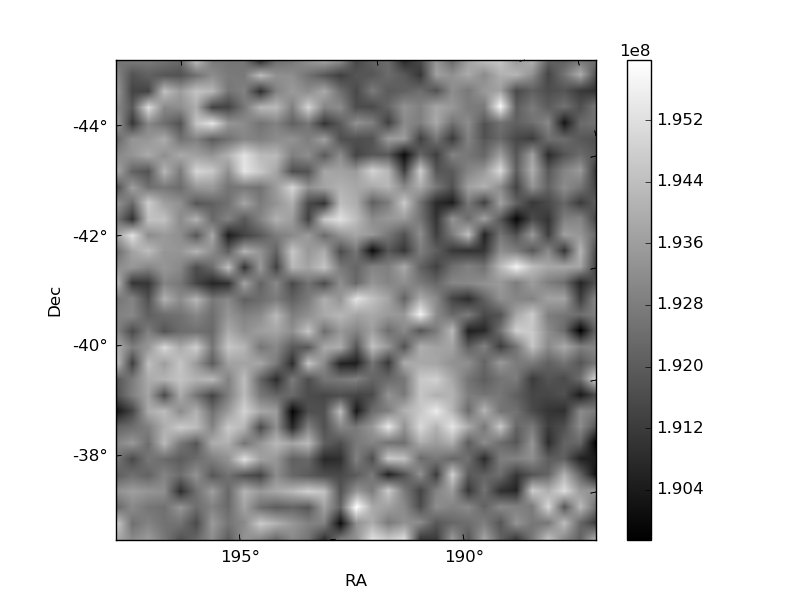
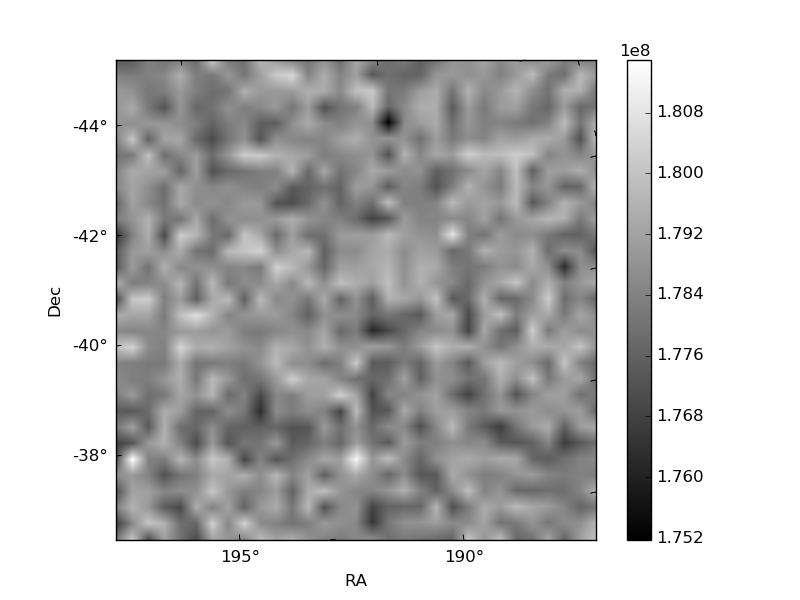
Histogram calculated using DETX and DETY for each event in the final _common_clean file
| Quadrant A | 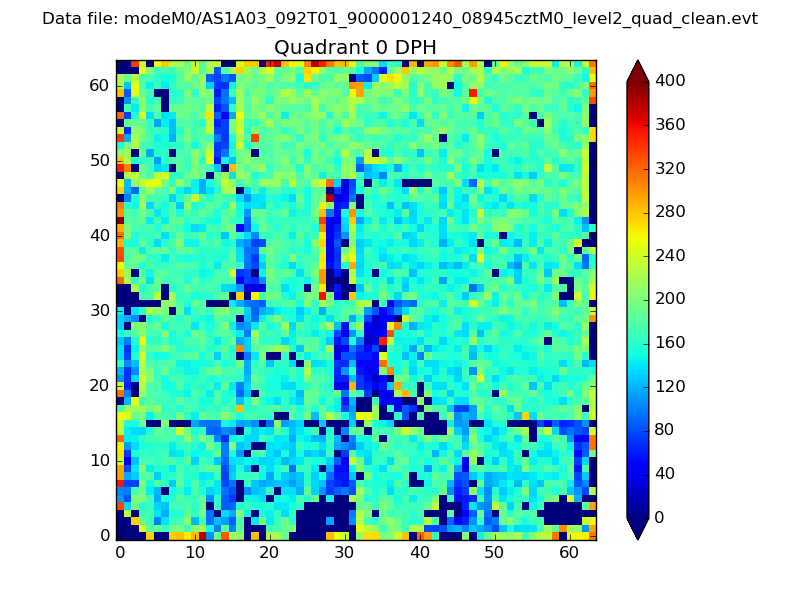 |
 |
Quadrant B |
|---|---|---|---|
| Quadrant D | 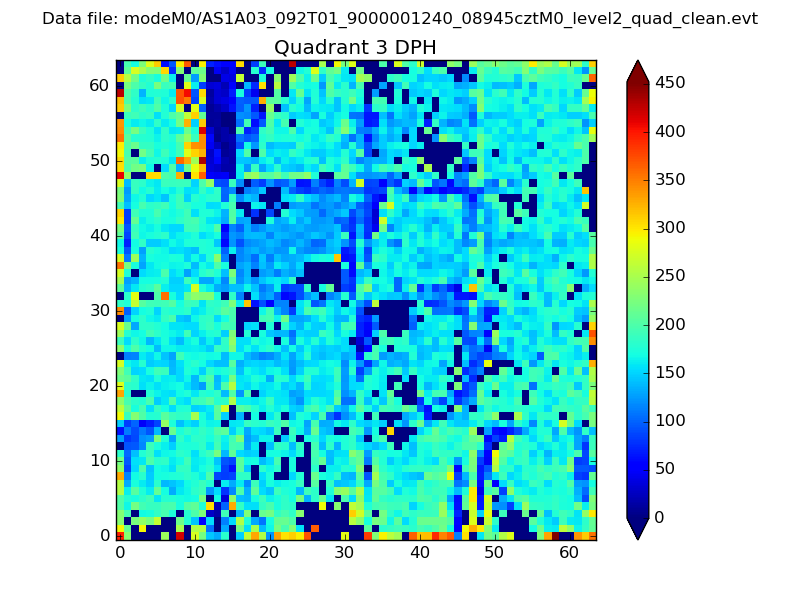 |
 |
Quadrant C |
| Plot type | Count rate plots | Images |
|---|---|---|
| Comparison with Poisson distribution Blue bars denote a histogram of data divided into 1 sec bins. Red curve is a Poisson curve with rate = median count rate of data. |
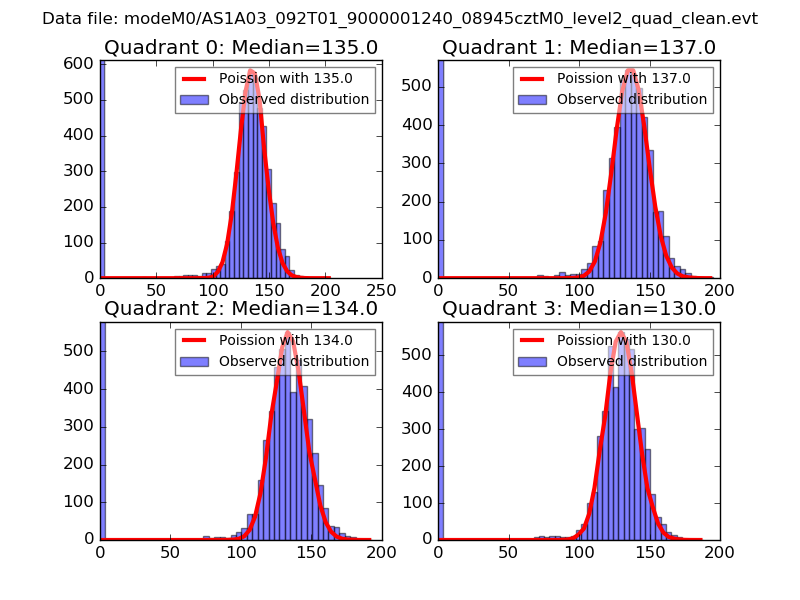 |
 |
| Quadrant-wise count rates Data is divided into 100 sec bins |
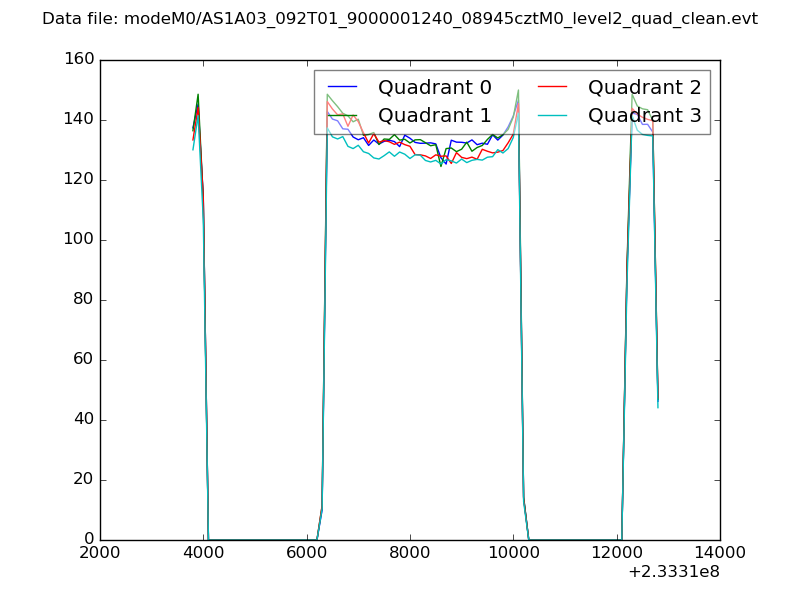 |
|
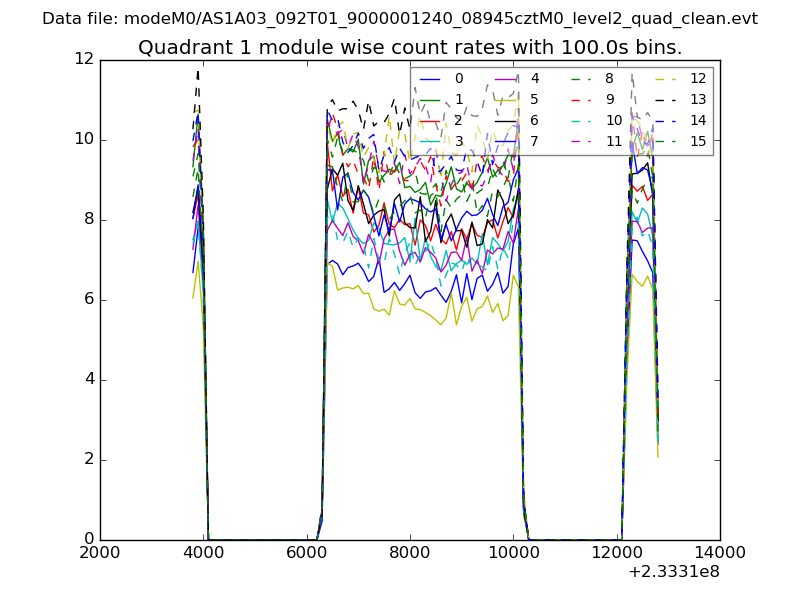
| Module-wise count rates for Quadrant A Data is divided into 100 sec bins |
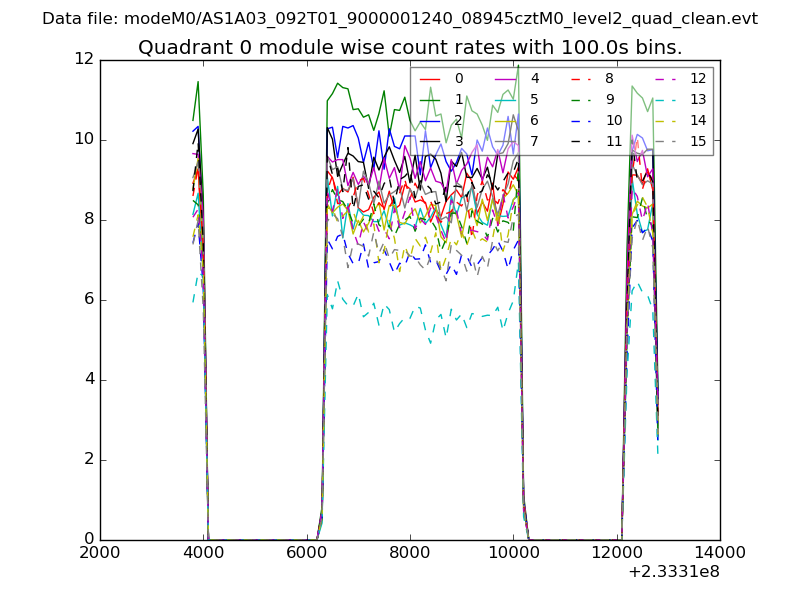 |
 |
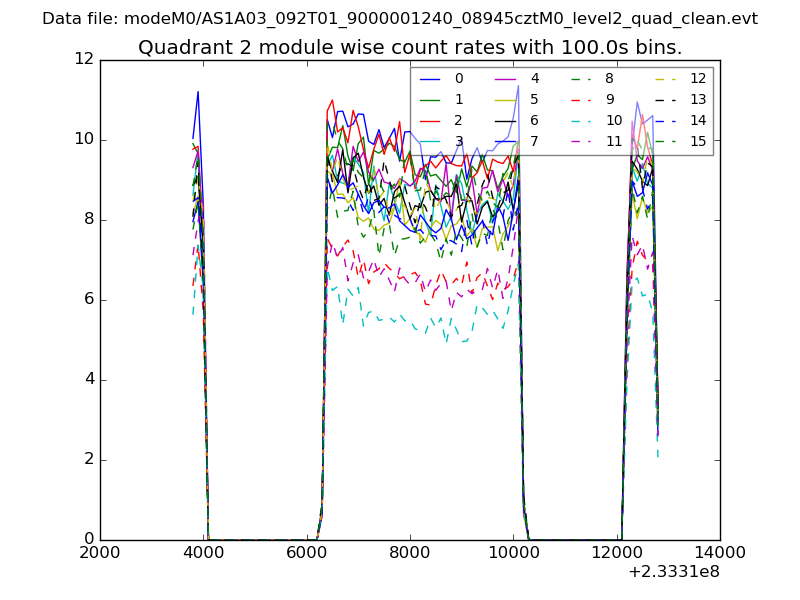
| Module-wise count rates for Quadrant B Data is divided into 100 sec bins |
 |
 |
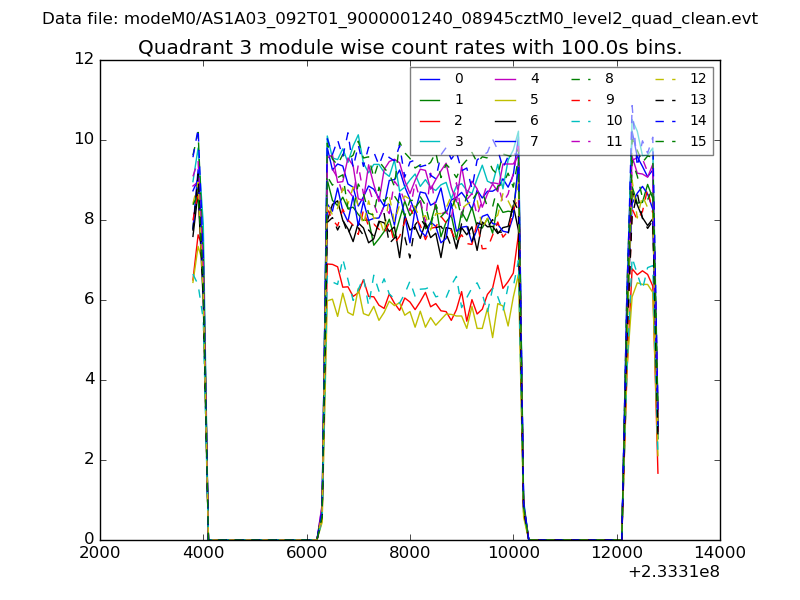
| Module-wise count rates for Quadrant C Data is divided into 100 sec bins |
 |
 |
| Module-wise count rates for Quadrant D Data is divided into 100 sec bins |
 |
 |
| Parameter | Plot |
|---|---|
| CZT HV Monitor | 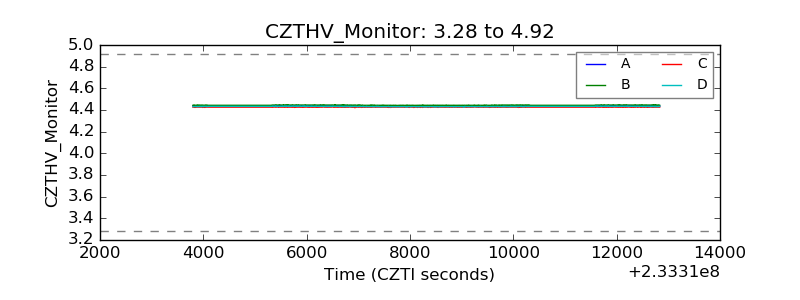 |
| D_VDD | 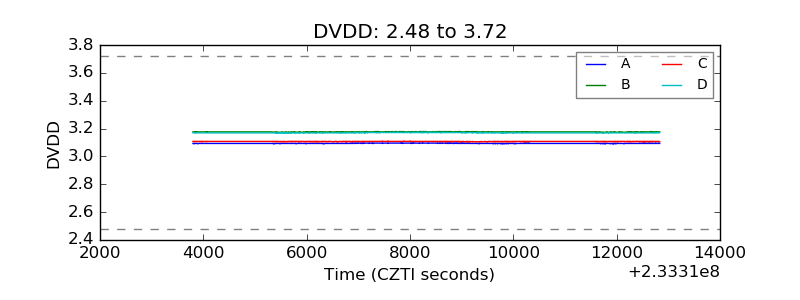 |
| Temperature 1 | 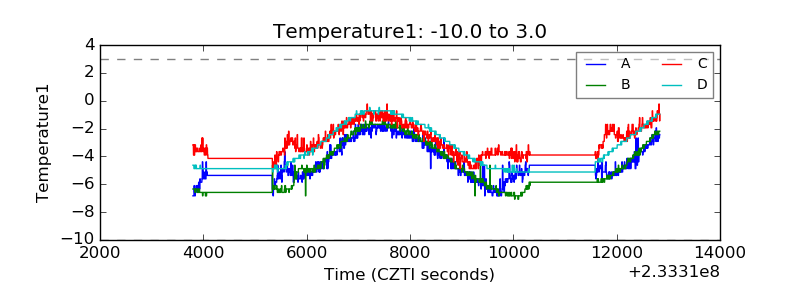 |
| Veto HV Monitor | 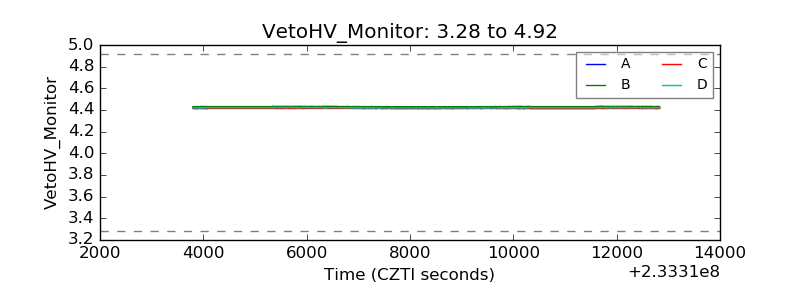 |
| Veto LLD | 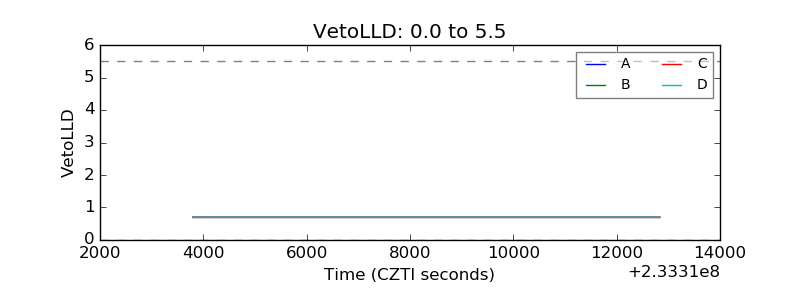 |
| Alpha Counter | 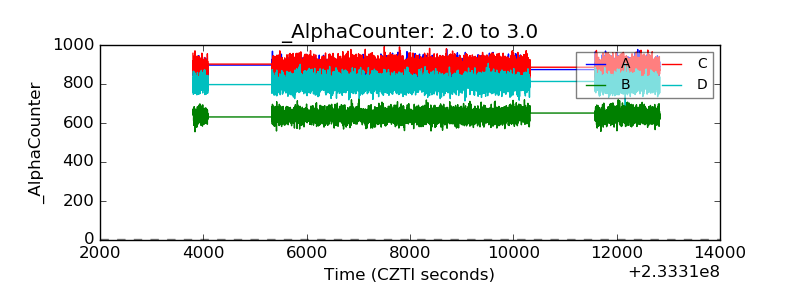 |
| _CPM_Rate | 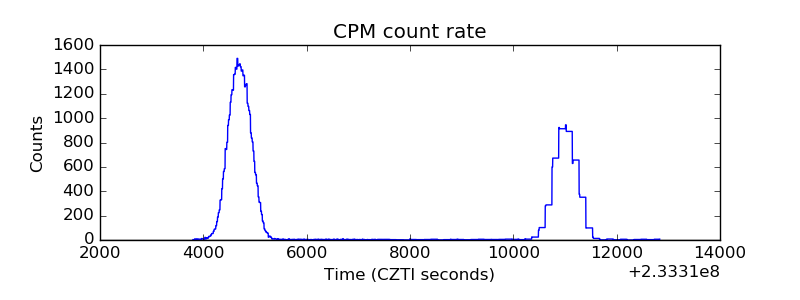 |
| CZT Counter | 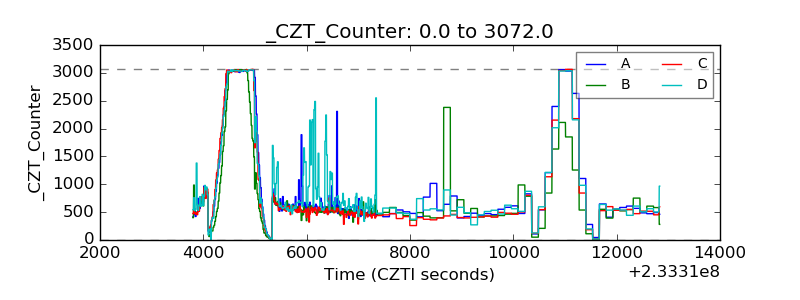 |
| +2.5 Volts monitor | 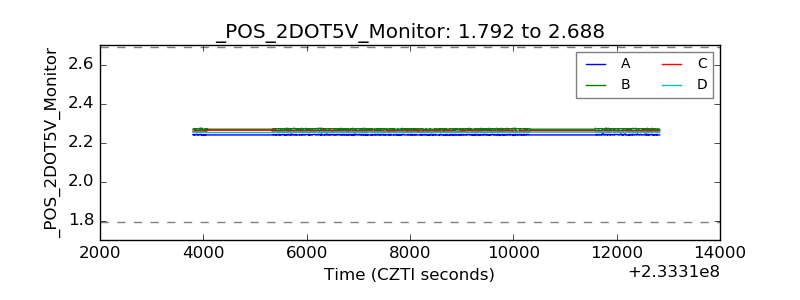 |
| +5 Volts monitor | 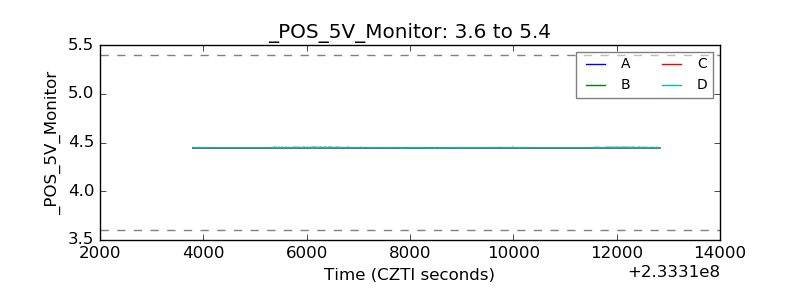 |
| _ROLL_ROT | 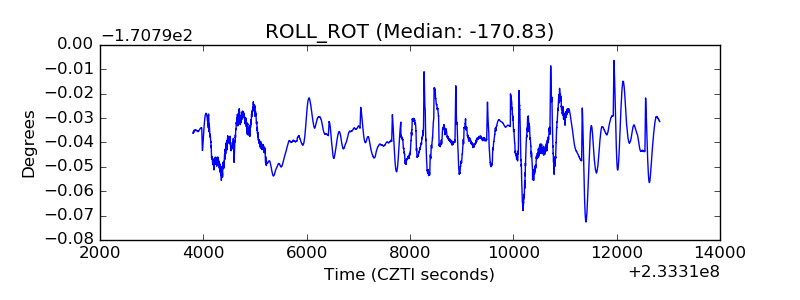 |
| _Roll_DEC | 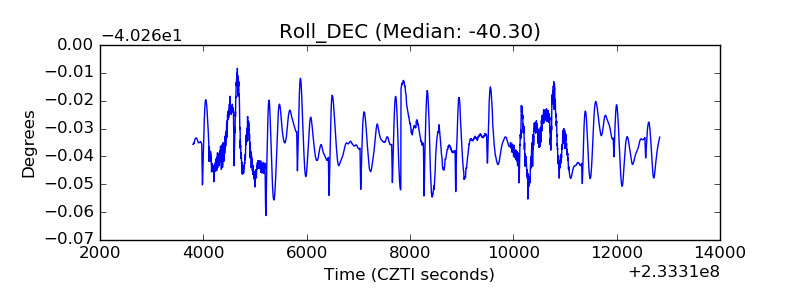 |
| _Roll_RA | 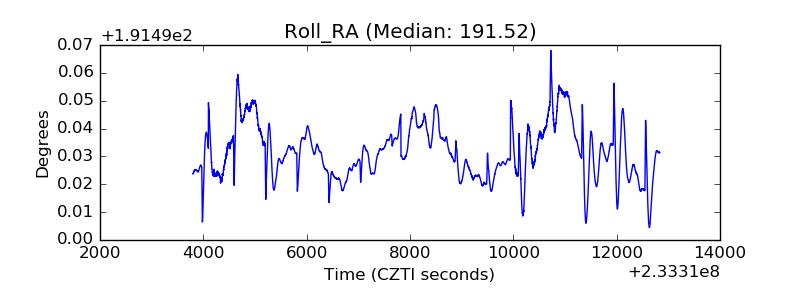 |
| Veto Counter | 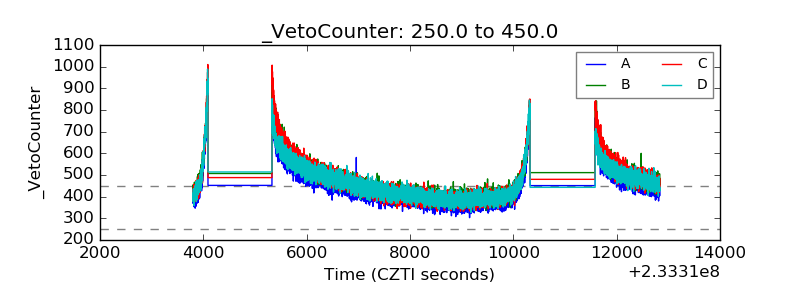 |